. 2023 Jan;42(5):389-405.
doi: 10.1038/s41388-022-02563-9. Epub 2022 Dec 7.

Characterization of mutant versions of the R-RAS2/TC21 GTPase found in tumors

Affiliations

Characterization of mutant versions of the R-RAS2/TC21 GTPase found in tumors

Laura Clavaín et al. Oncogene. 2023 Jan.

Abstract

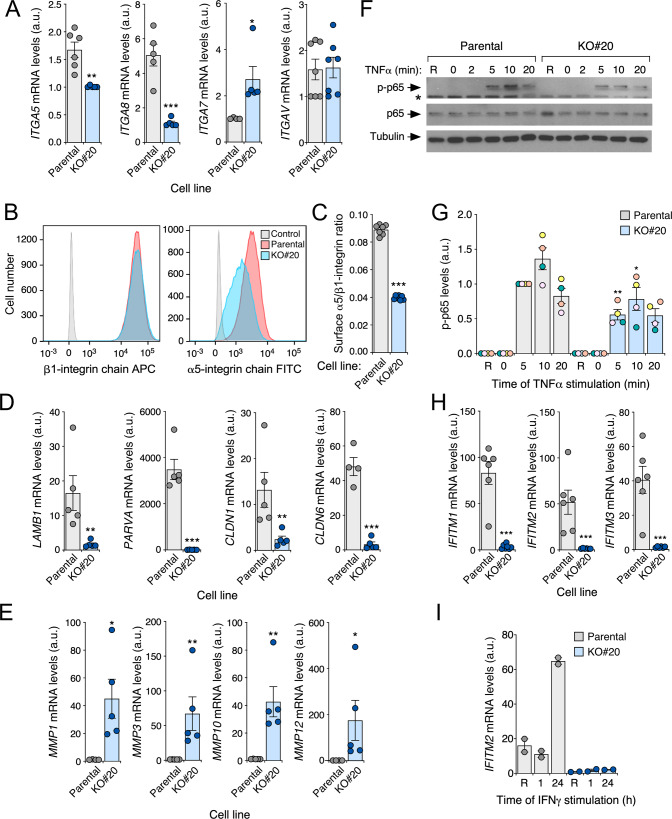
The R-RAS2 GTP hydrolase (GTPase) (also known as TC21) has been traditionally considered quite similar to classical RAS proteins at the regulatory and signaling levels. Recently, a long-tail hotspot mutation targeting the R-RAS2/TC21 Gln72 residue (Q72L) was identified as a potent oncogenic driver. Additional point mutations were also found in other tumors at low frequencies. Despite this, little information is available regarding the transforming role of these mutant versions and their relevance for the tumorigenic properties of already-transformed cancer cells. Here, we report that many of the RRAS2 mutations found in human cancers are highly transforming when expressed in immortalized cell lines. Moreover, the expression of endogenous R-RAS2Q72L is important for maintaining optimal levels of PI3K and ERK activities as well as for the adhesion, invasiveness, proliferation, and mitochondrial respiration of ovarian and breast cancer cell lines. Endogenous R-RAS2Q72L also regulates gene expression programs linked to both cell adhesion and inflammatory/immune-related responses. Endogenous R-RAS2Q72L is also quite relevant for the in vivo tumorigenic activity of these cells. This dependency is observed even though these cancer cell lines bear concurrent gain-of-function mutations in genes encoding RAS signaling elements. Finally, we show that endogenous R-RAS2, unlike the case of classical RAS proteins, specifically localizes in focal adhesions. Collectively, these results indicate that gain-of-function mutations of R-RAS2/TC21 play roles in tumor initiation and maintenance that are not fully redundant with those regulated by classical RAS oncoproteins.


Conflict of interest statement

The authors declare no competing interests.

Figures

Fig. 1
Fig. 1. Oncogenic activity of RRAS2 mutations found in tumors.
A Representative images of stained tissue culture plates at the end of the focus formation assays with the indicated R-RAS2 proteins. EV empty vector; WT wild-type. B Transforming activity of the indicated R-RAS2 mutant proteins. Data represent mean ± SEM (n = 3). Statistical significance was tested by one-way ANOVA and Dunnett’s multiple comparison tests (***p < 0.001). Non-transforming and transforming mutants are shown in green and red, respectively. C Representative immunoblots showing the levels of phosphorylation and total amount of indicated proteins (left) in lysates obtained from NIH3T3 cells stably expressing the described proteins (top) after starvation for four hours. Aliquots from the same lysates were analyzed in separate blots (each identified with asterisks of the same color). Levels of tubulin α were used as a loading control (n = 3). p, phosphorylated. D Heatmap illustrating the phosphorylation levels of the indicated proteins (left) obtained in C. Phosphorylation levels were normalized to total protein levels. Data are represented as the fold-change (FC) variation as compared to the wild-type protein using a gradient color according to the scale shown on the right. E Correlation of transforming activities and phospho-AKT (left) and phospho-ERK (right) triggered by the R-RAS2 mutants. Values were normalized (from 0 to 1) for representation purposes. Phospho-AKT levels were calculated by combining the signals of phospho-AKTT308 and phospho-AKTS473. Spearman correlation coefficient (Spearman r) is indicated for each analysis inside the appropriate graph.
Fig. 2
Fig. 2. Endogenous R-RAS2Q72L is required for tumorigenesis of cancer cells.
A Plot illustrating the R-RAS2 dependency of cancer cell lines using the data contained in the Novartis Drive Data Portal. The name of R-RAS2-dependent cell lines whose proliferation is above the minimal sensitivity score threshold (red line) is shown on the graph. B Representative immunoblot analysis showing the expression of indicated proteins (left) in lysates from the cells shown at the top. KO#3, KO#20, KO#1, KO#5 and KO#7 indicate independent clones of RRAS2 knockout (KO) cells. Levels of tubulin α were used as a loading control (n = 3). C Proliferation of indicated A2780 (left), COV362 (middle) and COV504 (right) control and derivative cells (insets) using MTT assays. “Selected WT” indicate cell clones that went through all to the CRISPR–Cas9 gene editing process but that have not lost the RRAS2 gene. Data represent mean ± SEM (n = 3). Statistical significance was tested by two-way ANOVA and Tukey’s multiple comparison tests (**p < 0.01; ***p < 0.001). D Representative images of tumors generated by indicated A2780 cell lines (left) upon implantation into the ovarian bursa of immunocompromised mice. Scale bar, 1 cm. E Quantitation of the tumors obtained in D. Points represent results from an individual mouse. Bars represent the mean ± SEM. n = 12 for controls; n = 16 for RRAS2-deficient clones #3 and #20 (which were pooled together). Statistical significance was tested by Mann–Whitney test (***p < 0.001). F Representative immunoblots showing the phosphorylation and total amount of indicated proteins (left) in lysates from the cells indicated at the top. Aliquots from the same lysates were analyzed in separate blots (each identified with asterisks of the same color). Levels of tubulin α were used as a loading control (n = 3). G to I Quantitation of phosphorylation levels of the described proteins (bottom) expressed in the indicated A2780 (G), COV362 (H) or COV504 (I) cell line derivatives and their appropriate controls (top). Bars represent mean ± SEM. n = 4 (for G); n = 3 (for H and I). For (G), statistical significance was tested by Mann–Whitney test (**p < 0.01).
Fig. 3
Fig. 3. Endogenous R-RAS2 proteins localize in focal adhesions.
A Schematic representation of the RRAS2 locus upon the CRISPR–Cas9 gene editing step described in the main text. B and C Representative confocal microscopy images of indicated GFP-tagged cell lines (B and C, top) after staining with antibodies to vinculin (left panels) or with phalloidin (B and C, two columns of panels on the right). Scale bars, 10 μm (human cells) and 25 μm (fibrosarcoma cells).
Fig. 4
Fig. 4. Endogenous R-RAS2Q72L regulates focal adhesion-related functions.
A Representative confocal microscopy images of parental and RRAS2Q72L knockout A2780 cells (top) upon staining with antibodies to vinculin. Scale bar, 10 μm. B Quantitation of the total area of focal adhesions per cell from experiments shown in A. Points represent individual cells (n = 3 independent experiments). Bars represent mean ± SEM. Statistical significance was tested by the Mann–Whitney test (***p < 0.001). C Representative confocal microscopy images of parental and RRAS2Q72L knockout CAL-51 cells (top) after staining with antibodies to vinculin. Scale bar, 10 μm. D Quantitation of the total area of focal adhesions per cell from the experiments shown in C. Points represent individual cells (n = 3). Bars represent mean ± SEM. Statistical significance was tested by the unpaired t-test (*p < 0.05). E to G Attachment of the cell lines A2780 (E), CAL-51 (F) or COV362 (G) and the appropriate control cells (top) at the indicated times after plating (bottom). Data were normalized using the number of cells initially seeded (counted at 6 h after plating). Points represent individual cells (n = 3). Bars represent mean ± SEM. Statistical significance was tested by two-way ANOVA analysis and Sidak’s multiple comparisons tests (***p < 0.001). H Scheme and formula of the two migration-related parameters utilized in I to L. AS average speed, ES effective speed. The migration of cells is shown as a broken blue lane. I and J Average (I) and effective (J) speed of the indicated A2780 cells (bottom) in collagen-based hydrogels. Points represent individual cells (n = 3). Bars represent mean ± SEM. Statistical significance was tested by the Mann–Whitney test (***p < 0.001). K and L Average speed (K) and effective speed (L) of the indicated A2780 cells (bottom) in collagen-based hydrogels with a gradient of insulin growth factor 1. Points represent individual cells (n = 3). Bars represent mean ± SEM. Statistical significance was tested by the Mann–Whitney test (***p < 0.001).
Fig. 5
Fig. 5. Impact on the transcriptome of endogenous R-RAS2Q72L.
A and B Examples of gene signatures enriched in the downregulated transcriptome of RRAS2Q72L knockout A2780 cells. The FDR q value and NES (normalized enrichment score) for the downregulated gene signatures are indicated in each plot. In both cases, GSEA analyses were conducted using selected gene signatures for adhesion-related processes (A) and the unbiased pathways contained in the MSigDB hallmark collection (B).
Fig. 6
Fig. 6. Validation of microarray data.
A Expression of the indicated integrin-encoding transcripts in parental and RRAS2Q72L-knockout A2780 (clone KO#20) cells using qRT-PCR analyses. Points represent independent experiments. Bars represent mean ± SEM. Values are given in arbitrary units, taking the lowest mean of each experiment as 1. Statistical significance was tested by the Student’s t-test (*, p < 0.05; **, p < 0.01; ***, p < 0.001). B and C Example (B) and quantitation (C) of the protein expression levels of indicated integrins in parental and RRAS2Q72L-knockout A2780 (clone KO#20) cells. In A, control means the staining with an isotype control antibody. In B, points represent independent experiments. Statistical significance was tested by the Student’s t-test (***p < 0.001). D and E Expression levels of indicated transcripts (D and E, left) in parental and RRAS2Q72L-knockout A2780 (clone KO#20) cells using qRT-PCR analyses. Points represent independent experiments. Bars represent mean ± SEM. Values are given in arbitrary units, taking the lowest mean as 1. Statistical significance was tested by the Student’s t-test (*p < 0.05; **p < 0.01; ***p < 0.001). F and G Representative immunoblot analysis (F, top panel) and quantitation (G) of the phosphorylation (p-) of the p65 NFκB subunit upon the stimulation of serum-starved parental and RRAS2Q72L-knockout A2780 (clone KO#20) cells with TNFα for the indicated periods of time. As control, we evaluated the level of total p65 (F, middle panel) and tubulin α (F, bottom panel) in each sample. R, resting cells. In G, points represent independent experiments (values for each independent experiment shown with points of different colors). Bars represent mean ± SEM. Values represent arbitrary densitometry units (with 1 assigned to value obtained in control cells stimulated with TNFα for 5 min). Statistical significance was tested by the Student’s t-test (*p < 0.05; **p < 0.01). H Expression of the indicated IFNITM transcripts in parental and RRAS2Q72L-knockout A2780 (clone KO#20) cells using qRT-PCR analyses. Points represent independent experiments. Bars represent mean ± SEM. Values are given in arbitrary units, taking the lowest mean of each experiment as 1. Statistical significance was tested by the Student’s t-test (***p < 0.001). I IFNγ-triggered stimulation of IFITM2 transcript levels in parental and RRAS2Q72L-knockout A2780 (clone KO#20) cells using qRT-PCR analyses (n = 2 independent experiments).
Fig. 7
Fig. 7. R-RAS2 regulates mitochondrial activity.
A Schematic representation of the expected respiratory profile obtained using the Seahorse Mito Stress test. Metabolic parameters (boxes) were determined based on the OCR measurement following addition of the indicated drugs at the specified time points. B Depiction of the electron transport chain. I to V represent the complexes participating in the oxidative phosphorylation process. Inhibitors and targets used in the Seahorse tests are indicated. C to E Quantification of indicated metabolic parameters (bottom) in RRAS2Q72L knockout A2780 (C), CAL-51 (D) and COV362 (E) cells and appropriate controls. Points represent independent experimental samples. Bars represent the mean ± SEM. *p < 0.05; **p < 0.01; ***p < 0.001 using unpaired t-test or Mann–Whitney test depending on the normality of each dataset (for n, see points on bars of each histogram). F to I Quantitation of the basal respiration (F), ATP production (G), maximal respiration (H), and spare respiratory activity (I) of NIH3T3 cells expressing the indicated R-RAS2 proteins (bottom) when compared to parental controls. Points represent independent experiments. Bars represent the mean ± SEM. *p < 0.05; **p < 0.01; ***p < 0.001 using one-way ANOVA and Sidak’s multiple comparisons tests (for n, see points on bars of each histogram). J to M Quantitation of basal respiration (J), ATP production (K), maximal respiration (L), and spare respiratory capacity (M) in NIH3T3 and Rras2Q72L/Q72L fibrosarcoma FS#2 cells. Points represent independent experiments. Bars represent the mean ± SEM. ***p < 0.001 using Mann–Whitney test (for n, see points on bars of each histogram). N Energy map depicting the metabolic phenotype (color dot) and metabolic potential (arrow connecting each paired cell line) for indicated cell lines. Each quadrant in the graph represents the indicated metabolic phenotype. (P), parental; (KO#n), knockout clone #n; Q72L, ectopic R-RAS2Q72L. Data represent mean ± SEM. Data were not analyzed statistically (n = 6).

References

    1. Drivas GT, Shih A, Coutavas E, Rush MG, D’Eustachio P. Characterization of four novel ras-like genes expressed in a human teratocarcinoma cell line. Mol Cell Biol. 1990;10:1793–8. - PMC - PubMed
    1. Chan AM, Miki T, Meyers KA, Aaronson SA. A human oncogene of the RAS superfamily unmasked by expression cDNA cloning. Proc Natl Acad Sci USA. 1994;91:7558–62. - PMC - PubMed
    1. Ohba Y, Mochizuki N, Yamashita S, Chan AM, Schrader JW, Hattori S, et al. Regulatory proteins of R-Ras, TC21/R-Ras2, and M-Ras/R-Ras3. J Biol Chem. 2000;275:20020–6. - PubMed
    1. Calvo F, Crespo P. Structural and spatial determinants regulating TC21 activation by RasGRF family nucleotide exchange factors. Mol Biol Cell. 2009;20:4289–302. - PMC - PubMed
    1. Zhang X, Spiegelman NA, Nelson OD, Jing H, Lin H. SIRT6 regulates Ras-related protein R-Ras2 by lysine defatty-acylation. Elife. 2017;6:e25158. - PMC - PubMed

Publication types