. 2022 Dec 6;41(10):111761.
doi: 10.1016/j.celrep.2022.111761.

Systematic multi-omics cell line profiling uncovers principles of Ewing sarcoma fusion oncogene-mediated gene regulation

Affiliations

Systematic multi-omics cell line profiling uncovers principles of Ewing sarcoma fusion oncogene-mediated gene regulation

Martin F Orth et al. Cell Rep. .

Abstract

Ewing sarcoma (EwS) is characterized by EWSR1-ETS fusion transcription factors converting polymorphic GGAA microsatellites (mSats) into potent neo-enhancers. Although the paucity of additional mutations makes EwS a genuine model to study principles of cooperation between dominant fusion oncogenes and neo-enhancers, this is impeded by the limited number of well-characterized models. Here we present the Ewing Sarcoma Cell Line Atlas (ESCLA), comprising whole-genome, DNA methylation, transcriptome, proteome, and chromatin immunoprecipitation sequencing (ChIP-seq) data of 18 cell lines with inducible EWSR1-ETS knockdown. The ESCLA shows hundreds of EWSR1-ETS-targets, the nature of EWSR1-ETS-preferred GGAA mSats, and putative indirect modes of EWSR1-ETS-mediated gene regulation, converging in the duality of a specific but plastic EwS signature. We identify heterogeneously regulated EWSR1-ETS-targets as potential prognostic EwS biomarkers. Our freely available ESCLA (http://r2platform.com/escla/) is a rich resource for EwS research and highlights the power of comprehensive datasets to unravel principles of heterogeneous gene regulation by chimeric transcription factors.

Keywords: CP: Cancer; ChiP-seq; EWSR1-ERG; EWSR1-ETS; EWSR1-FLI1; Ewing sarcoma; enhancer; microsatellites; multi-omics; pediatric sarcoma; tumor heterogeneity.


Conflict of interest statement

Declaration of interests The authors declare no competing interests.

Figures
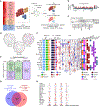
Figure 1.
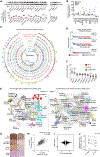
Figure 1.. The Ewing Sarcoma Cell Line Atlas (ESCLA)
(A) Schematic of the ESCLA. dox, doxycycline; WGS, whole-genome sequencing; ChIP-seq, chromatin immunoprecipitation sequencing. (B) Coverage of WGS data over the entire human genome, counted per 90-kb window, maximum (max), median, and minimum (min) coverage across cell lines; range is shown in gray. (C) Gel electrophoresis of the PCR-amplified FLI1-EWSR1 transcript as an indicator for reciprocal EWSR1-FLI1 translocation; 100-bp ladder. (D) Circos plots indicating the most significant genomic rearrangements per cell line in purple. (E) ESCLA cell lines and the respective type of fusion development. EF1t1/2, EF1 subtype 1/2. (F) Bar plots of counts for single-nucleotide variants (SNVs), structural variants (SVs), and copy number variants (CNVs; called using CNVkit) per cell line; additional CNV heatmap across the genome; and tile plot indicating clinical characteristics and commonly described variants (arm-level chromosomal gains/losses as defined by CNVnator). CDS, coding sequence; del, deletion; dup, duplication; inv, inversion. Sex refers to the genetic sex determined by analysis of sex chromosomes and STR profiling. (G) Venn diagram indicating the overlap of EWSR1-FLI1 binding sites described by Riggi et al. and the ESCLA core subset (EWSR1-ETS-bound sites in a minimum of 15 of 18 cell lines; Table S2A. (H) EWSR1-ETS-ChIP-seq at GGAA mSats regulating known EWSR1-ETS-targets.
Figure 2.
Figure 2.. Effects of EWSR1-ETS knockdown on the transcriptome, proteome, and methylome of EwS cell lines
(A) Representative western blot and dot plot for qRT-PCR (biological replicates, n = 4) for EWSR1-ETS without and with shRNA induction by dox addition. A bar indicates mean; GAPDH was used as a housekeeping protein. (B) Dot plot indicating differential expression of non-fused EWSR1, ERG, and FLI1 under EWSR1-ETS-low versus -high (EE-low/high) conditions (n = 4). Only genes with expression of at least 1‰ of the fusion in the EE-high state were considered as expressed and depicted. (C) Circos plot visualizing genome-wide EWSR1-ETS-binding and effects of EWSR1-ETS knockdown on the transcriptome, proteome, and DNA methylation. Fold changes (FCs) of protein and RNA levels are mean values for all cell lines. Differentially methylated regions (DMRs), ChIP peak sites, and CNVs are displayed stacked for each cell line. Avg., average; EETS, EWSR1-ETS; SE, super-enhancer. (D) Representative gene set enrichment analysis (GSEA) for EETS co- and anti-regulated genes. NES, normalized enrichment score. See also Tables S3A and S3B. (E) Weighted correlation network analysis (WGCNA) on the GSEA of EWSR1-ETS-correlated and -anticorrelated genes using average rank of expression FC across each cell line. The depicted network analyses were based on significant gene sets with an NES of a minimum of 2.5 (Table S3B). (F) Dot plot indicating FCs of the depicted EWSR1-ETS-target mRNA level upon EWSR1-ETS knockdown; lines medians. (G) Representative micrographs of immunohistochemically stained FLI1, p.MYBL2, PAX7 and SOX6 EwS cell line xenografts. Scale bars, 50 μm. (H) Scatterplot indicating average expression FC per gene across cell lines at the mRNA and protein level; a red line indicates linear regression (Table S4A). (I) Scatterplot indicating genes with absolute FC greater than 0.5 at the RNA level in EE-low versus -high condition in more than 6 cell lines and the average delta of the β values of CpG sites, which were uniquely annotated for the promoters of the respective gene. (J) Before-and-after plot indicating a consistent decrease of the calibrated score for the methylation class EwS (mean value for three replicates each) in the six ESCLA cell lines with highest scores; paired t test.
Figure 3.
Figure 3.. Differences and commonalities of distinct EWSR1-ETS fusions
(A) Boxplot indicating overlap of the top third of genes regulated at the mRNA level upon EWSR1-ETS knockdown (only the 924 genes with the highest FCs were considered regulated because this was the minimum number of regulated genes among all cell lines; the top third corresponds to the 208 genes of the 924 with the highest FCs) of any cell line positive for the fusion, indicated on the x axis with the top 924 regulated genes of all other cell lines with the color-coded fusion (sub)type. Center lines represent the median, boxes the interquartile range, and whiskers the 10th–90th percentiles. EF1t1/2, EWSR1-FLI1 subtype 1/2. (B) Boxplot as in (A) for the top third (72) of regulated proteins of any cell line, with fusion (sub)type indicated on the x axis, versus the top 216 regulated proteins (minimum number of regulated proteins among all cell lines) of all other cell lines. (C and D) Venn diagram indicating overlap of the top 100 GSEA results per fusion type. GSEA was performed on the gene list ranked by the average FC rank of each gene across all cell lines of a specific fusion (sub)type at the mRNA level (C) and protein level (D). (E and F) t-distributed stochastic neighbor embedding (t-SNE) plots for the full transcriptome and proteome of all 18 EwS cell lines in the ESCLA. (G) t-SNE plot for all 18 EwS cell lines in ESCLA based on DNA methylation.
Figure 4.
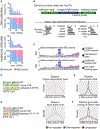
Figure 4.. Characteristics of EWSR1-ETS-bound GGAA mSats in the ESCLA
(A) Bar plots indicating absolute and average counts of genotyped GGAA microsatellites (mSats) stratified according to average (to panel) or maximum (bottom panel) consecutive (cons.) GGAA repeats for both alleles, EWSR1-ETS (EETS)-binding is indicated in pink. (B) Top panel: description of the GGAA mSat architecture with the terms additional motif, longest GGAA-stretch, flanking and interspersed bases and additional repeats in GGAA mSats. Bottom panel: bar plots indicating the ratio of GGAA mSats found to be EWSR1-ETS bound/unbound in ChIP, normalized to the expected ratio for the longest GGAA mSat, stratified by different components of the GGAA mSat architecture. (C) Motifs for the most often EETS-bound and -unbound GGAA mSats. (D) Left: de novo called motifin the flanking region of always EETS-bound GGAA mSats and the matched known reference binding motif for GATA2. Right: density plot indicating the relative position of the GATA2 motif relative to EWSR1-ETS-bound and -unbound GGAA mSats. bg, background (i.e., control sequence) frequency of the de novo motif; target, de novo motif frequency in investigated target sequences; ref, reference binding motif. (E) Density histogram of the dito the transcription start site (TSS; indicated as a dashed gray line) of a downregulated (blue), upregulated (red), and unregulated (green) gene upon EETS knockdown. Genes were considered down- or upregulated when the regulation was observed in at least 33% of cells. (F) Density histogram indicating the distance of the next EETS-bound GGAA mSat to the TSS (dashed gray line) of a downregulated (blue), upregulated (red), and unregulated (green) gene upon EETS knockdown in the respective cell line. (G) Left: de novo called motifs for TF binding in the promoters of EETS-regulated genes. Right: density plot for the distance of the de novo called E2F2 motif to the next TSS of any gene, stratified by the effect of EWSR1-ETS on the respective gene.

References

    1. Kaatsch P, Strothotte J, Becker C, Bielack S, Dirksen U, and Blettner M (2016). Pediatric bone tumors in Germany from 1987 to 2011: incidence rates, time trends and survival. Acta Oncol. 55, 1145–1151. 10.1080/0284186X.2016.1195509. - DOI - PubMed
    1. Ewing J. (2006). The classic: diffuse endothelioma of bone. Clin. Orthop. Relat. Res 450, 25–27. 10.1097/01.blo.0000229311.36007.c7. - DOI - PubMed
    1. Anderson ND, de Borja R, Young MD, Fuligni F, Rosic A, Roberts ND, Hajjar S, Layeghifard M, Novokmet A, Kowalski PE, et al. (2018). Rearrangement bursts generate canonical gene fusions in bone and soft tissue tumors. Science 361, eaam8419. 10.1126/science.aam8419. - DOI - PMC - PubMed
    1. Delattre O, Zucman J, Plougastel B, Desmaze C, Melot T, Peter M, Kovar H, Joubert I, de Jong P, and Rouleau G (1992). Gene fusion with an ETS DNA-binding domain caused by chromosome translocation in human tumours. Nature 359, 162–165. 10.1038/359162a0. - DOI - PubMed
    1. Sorensen PH, Lessnick SL, Lopez-Terrada D, Liu XF, Triche TJ, and Denny CT (1994). A second Ewing’s sarcoma translocation, t(21;22), fuses the EWS gene to another ETS-family transcription factor, ERG. Nat. Genet 6, 146–151. 10.1038/ng0294-146. - DOI - PubMed

Publication types

Substances