. 2022 Dec 6;34(12):1960-1976.e9.
doi: 10.1016/j.cmet.2022.11.003.

Lipid-laden lung mesenchymal cells foster breast cancer metastasis via metabolic reprogramming of tumor cells and natural killer cells

Affiliations

Lipid-laden lung mesenchymal cells foster breast cancer metastasis via metabolic reprogramming of tumor cells and natural killer cells

Zheng Gong et al. Cell Metab. .

Abstract

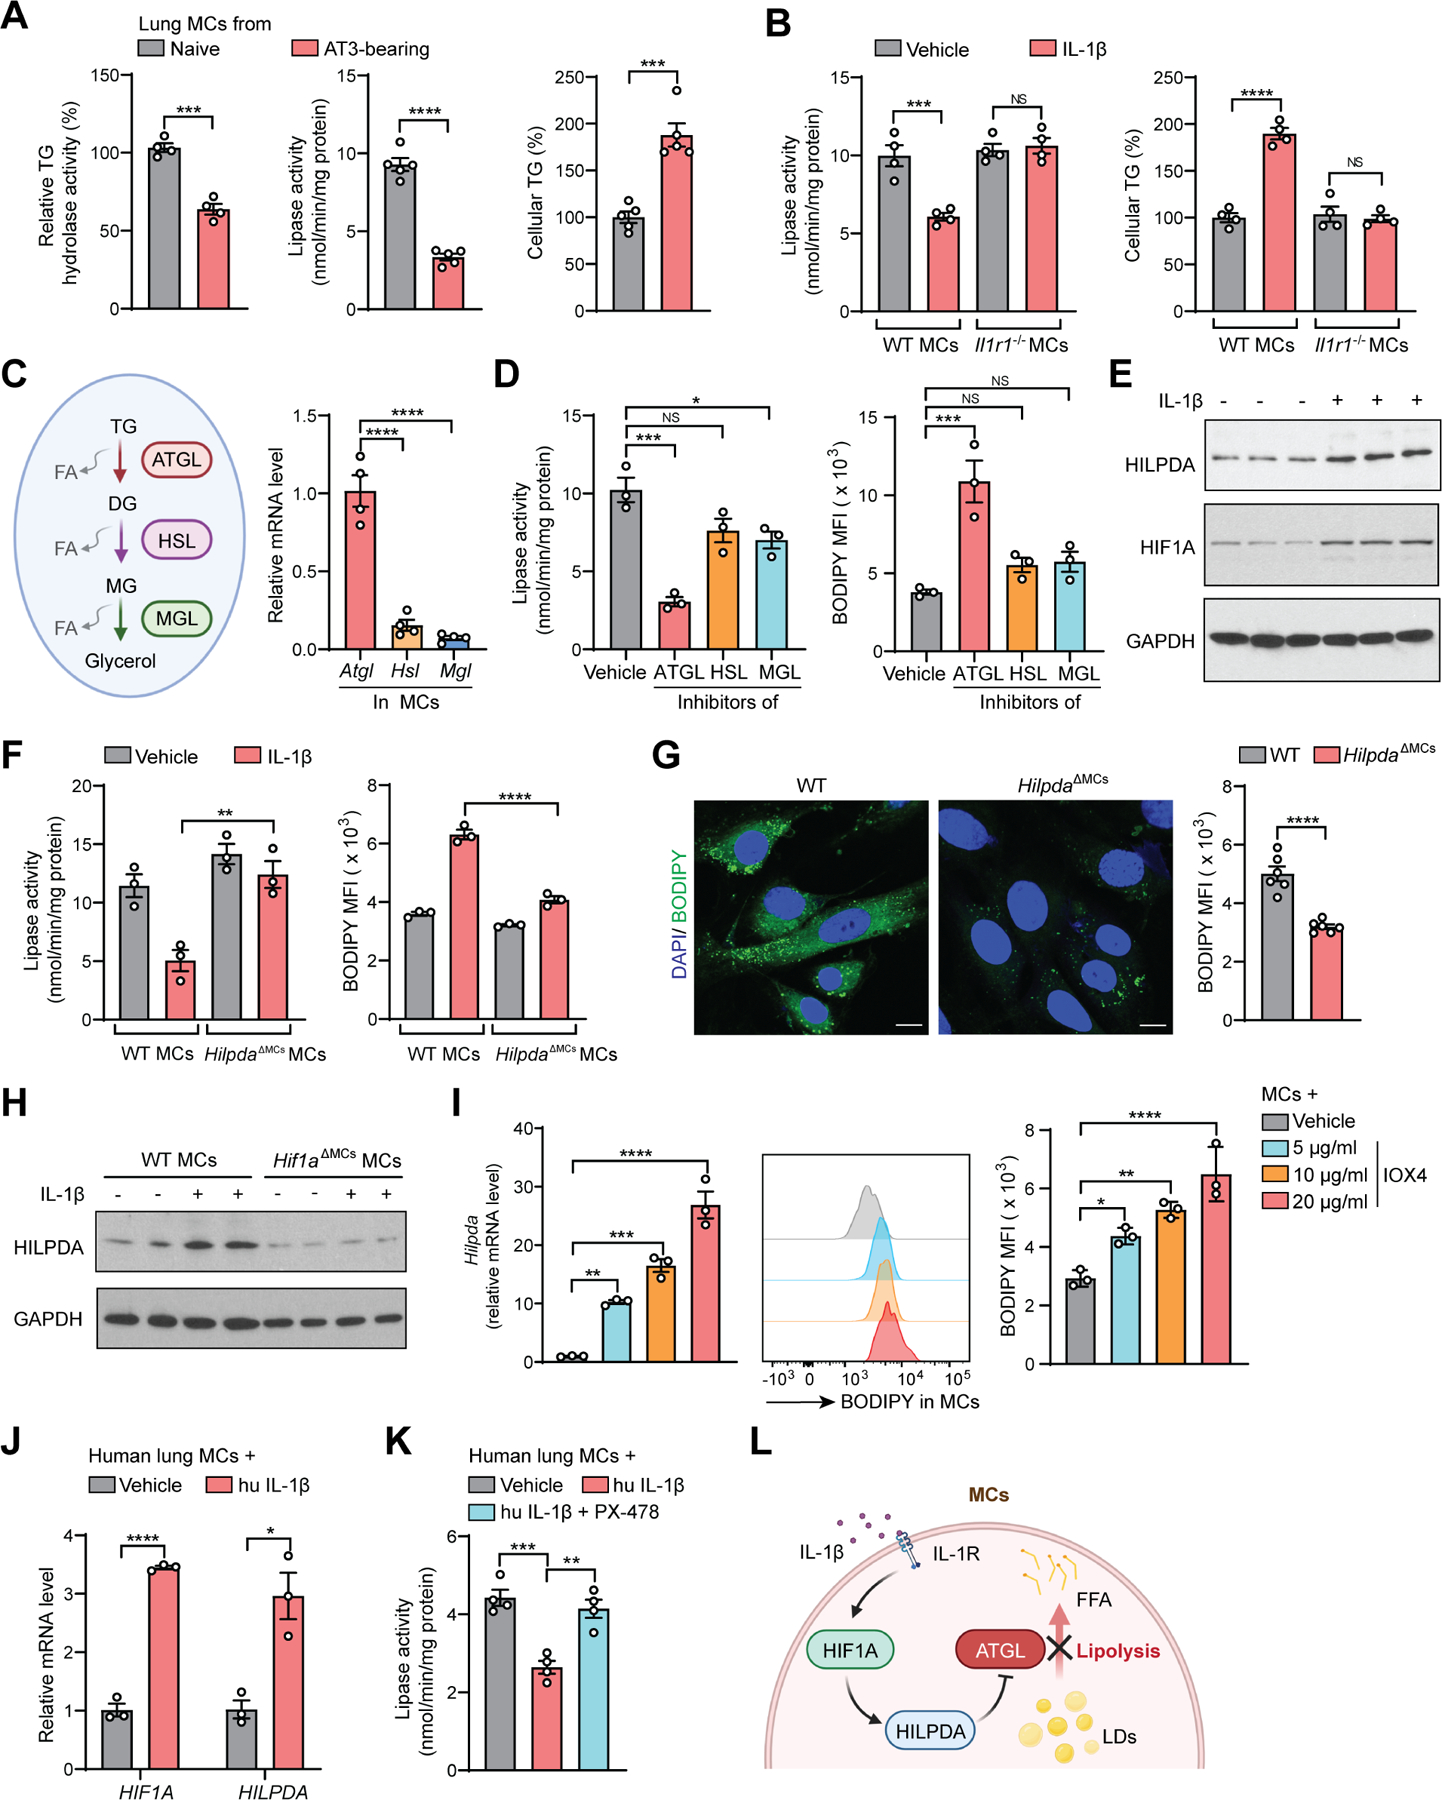
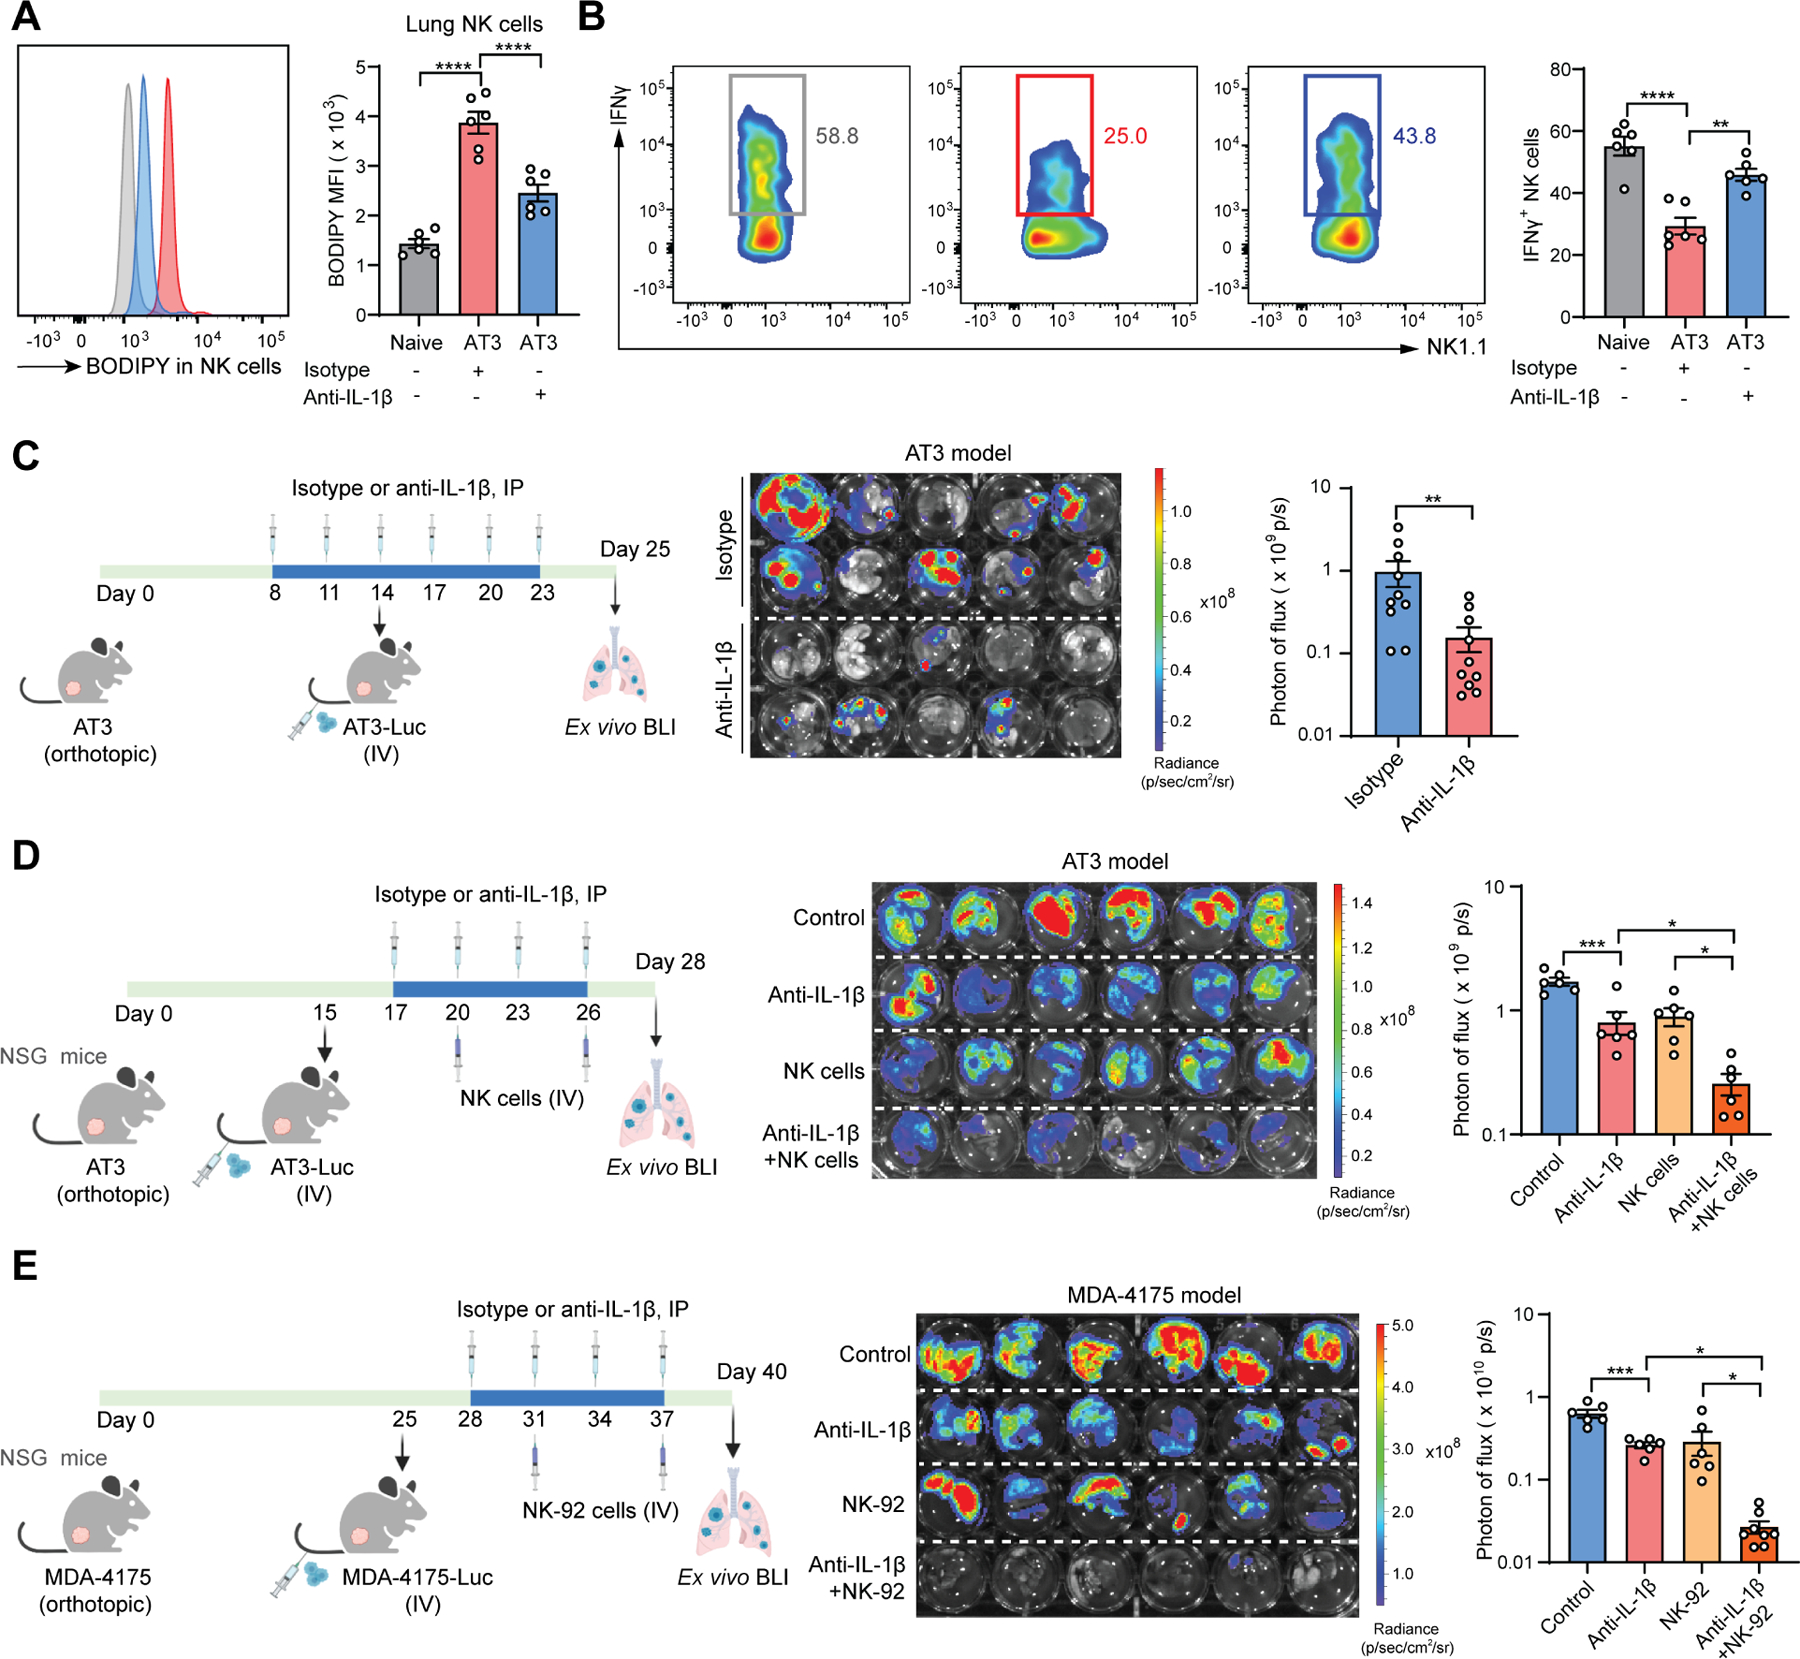
While the distant organ environment is known to support metastasis of primary tumors, its metabolic roles in this process remain underdetermined. Here, in breast cancer models, we found lung-resident mesenchymal cells (MCs) accumulating neutral lipids at the pre-metastatic stage. This was partially mediated by interleukin-1β (IL-1β)-induced hypoxia-inducible lipid droplet-associated (HILPDA) that subsequently represses adipose triglyceride lipase (ATGL) activity in lung MCs. MC-specific ablation of the ATGL or HILPDA genes in mice reinforced and reduced lung metastasis of breast cancer respectively, suggesting a metastasis-promoting effect of lipid-laden MCs. Mechanistically, lipid-laden MCs transported their lipids to tumor cells and natural killer (NK) cells via exosome-like vesicles, leading to heightened tumor cell survival and proliferation and NK cell dysfunction. Blockage of IL-1β, which was effective singly, improved the efficacy of adoptive NK cell immunotherapy in mitigating lung metastasis. Collectively, lung MCs metabolically regulate tumor cells and anti-tumor immunity to facilitate breast cancer lung metastasis.

Keywords: IL-1β; NK cells; breast cancer; disseminated tumor cells; inflammation; lipid storage; lung metastasis; mesenchymal cells; metabolic reprograming; triglycerides.


Conflict of interest statement

Declaration of interests The authors declare no competing of interests.

Figures

Figure 1.
Figure 1.. Lung MCs accumulate neutral lipids at the pre-metastatic stage.
(A) TG content was measured in the indicated lung stromal cells (n=5). (B) Immunostaining of lung sections showing in situ lipids in CD140a+ MCs. Scale bars, 5 μm. (C-D) Lipid content in lung MCs from the 4T1 (C) or MMTV-PyMT (D) model was measured (n=6–7). MFI, mean fluorescence intensity. (E) Workflow depicts isolation of lung CD140a+ MCs for scRNA-seq (left). t-SNE plots show three CD140a+ MC populations (middle), and the percentage of them is shown in pie charts (right). (F-G) The frequencies (F) and lipid content (G) of three lung MC clusters were measured (n=6). (H-K) The lipid content was measured in CD140a+ cells from indicated tissues by immunofluorescence (H, J) and flow cytometry (I, K) (n=5). Scale bars, 25 μm. MFP, mammary fat pad. n represents the number of biological replicates. The results (A-D, F-K) are representative of three independent experiments and shown as mean ± SEM. Statistical significance was determined by two-way ANOVA (A) or unpaired Student’s t-test (C-D, F-G, I, K). *p< 0.05, **p< 0.01, ***p< 0.001, ****p< 0.0001; NS, not significant. See also Figure S1.
Figure 2.
Figure 2.. IL-1β induces neutral lipid accumulation in lung MCs.
(A) Lipid content was measured in ex vivo cultured lung MCs upon stimulation by indicated regulators (n=3). (B) IL-1β level was measured in indicated samples (n=5). ND, not detected. BALF, bronchoalveolar lavage fluid. (C) The frequencies (left) and IL-1β production (right) of lung myeloid cells were measured (n=5–6). (D) Lipid content was measured in ex vivo cultured lung MCs upon IL-1β stimulation (n=3). (E) Immunofluorescence results showing lipid content in ex vivo cultured lung MCs upon IL-1β stimulation. Scale bars, 8 μm. (F) As depicted in the schematic (left), the lipid content in lung CD140a+ MCs was determined (n=5). IP, intraperitoneally. (G) Lipid content was measured in lung CD140a+ MCs from WT or Il1r1−/− mice under naïve or AT3 tumor-bearing condition (n=7). (H) As depicted in the schematic (left), the lipid content in lung CD140a+ MCs was measured (n=7). (I-J) Lipid content was measured in human lung MCs upon stimulation by hu IL-1β without or with hu IL-1 receptor antagonist (IL-1RA) by flow cytometry (I) (n=3–4 technical replicates) or immunofluorescence (J). Scale bars, 5 μm. n represents the number of biological replicates except (I). The results (A-J) are representative of three independent experiments and shown as mean ± SEM. Statistical significance was determined by one-way ANOVA (A, D, G-I) or unpaired Student’s t-test (B-C, F). *p< 0.05, **p< 0.01, ***p< 0.001, ****p< 0.0001; NS, not significant. See also Figure S2.
Figure 3.
Figure 3.. A cascade of HIF1A-HILPDA-ATGL in IL-1β-induced lipid accumulation in lung MCs.
(A) Relative TG hydrolase activity (left), lipase activity (right) and cellular TG content (left) were measured in lung CD140a+ MCs (n=4–5). (B) Lipase activity (left) and cellular TG content (right) were measured in ex vivo cultured lung MCs upon IL-1β stimulation (n=4). (C) A schematic description of intracellular lipolysis (left), and the expression of Atgl, Hsl and Mgl was measured in lung CD140a+ MCs (right) (n=4). DG, diglyceride; MG, monoglyceride; FA, fatty acid. (D) Lipase activity (left) and lipid content (right) were measured in ex vivo cultured lung MCs upon stimulation by indicated inhibitors (n=3). (E) Western blot showing HILPDA and HIF1A level in ex vivo cultured lung MCs upon IL-1β stimulation (n=3). (F) Lipase activity (left) and lipid content (right) were measured in ex vivo cultured WT or HilpdaΔMCs lung MCs upon IL-1β stimulation (n=3). (G) Lipid content in lung CD140a+ MCs from AT3 tumor-bearing WT or HilpdaΔMCs mice was detected by immunofluorescence (left; scale bars, 10 μm) or flow cytometry (right) (n=6). (H) Western blot showing HILPDA levels in ex vivo cultured WT or HilpdaΔMCs lung MCs upon IL-1β stimulation (n=2). (I) The Hilpda expression (left) and lipid content (middle and right) were determined in ex vivo cultured lung MCs upon IOX4 stimulation (n=3). (J) The HIF1A and HILPDA expression was measured in human lung MCs upon hu IL-1β stimulation (n=3 technical replicates). (K) Lipase activity was measured in human lung MCs upon hu IL-1β stimulation without or with HIF1A inhibitor PX-478 (n=4 technical replicates). (L) A schematic diagram showing the cascade of HIF1A-HILPDA-ATGL underlying IL-1β-induced lipid storage in lung MCs. n represents the number of biological replicates except (J-K). The results (A-K) are representative of three independent experiments and shown as mean ± SEM. Statistical significance was determined by unpaired Student’s t-test (A, G, J) or one-way ANOVA (B-D, F, I, K). *p< 0.05, **p< 0.01, ***p< 0.001, ****p< 0.0001; NS, not significant. See also Figure S3.
Figure 4.
Figure 4.. Lipid-laden MCs function to promote metastatic colonization.
(A-B) Lipase activity (A, left), cellular TG content (A, right) and lipid levels (B) were measured in lung CD140a+ MCs from naïve WT and AtglΔMCs mice (n=6). (C) Immunofluorescence results showing lipid content in lung CD140a+ MCs from naïve WT and AtglΔMCs mice. Scale bars, 8 μm. (D-G) As depicted in the schematic (D, left), lung metastatic colonization and primary tumor weight were compared between WT and AtglΔMCs mice (D, F) or between WT and HilpdaΔMCs mice (E, G) (n=10–12). IV, intravenously; BLI, bioluminescence imaging. (H) As depicted in the schematic (left), spontaneous lung metastasis was compared between WT and AtglΔMCs mice (n=9). (I) Comparison of the spontaneous lung metastasis developed in MMTV-PyMT; AtglΔMCs mice and their WT littermates. H&E staining of lung sections are shown, and arrowheads indicate metastatic lesions (n=10). Scale bars, 1mm. The Pymt expression in lung tissues was quantified (n=8). n represents the number of biological replicates. The results are representative of three (A-C) or two (D-I) independent experiments and shown as mean ± SEM. Statistical significance was determined by unpaired Student’s t-test (A-B) or Mann-Whitney test (D-I). *p< 0.05, **p< 0.01, ***p< 0.001, ****p< 0.0001; NS, not significant. See also Figure S4.
Figure 5.
Figure 5.. Lipid-laden lung MCs transport lipids to support tumor growth and survival.
(A) Immunofluorescence result showing adjacent localization of AT3-mCherry cells and lung CD140aEGFP MCs. Scale bar, 10 μm. (B) The lipid content in AT3 cells was measured after co-cultured with WT or AtglΔMCs lung CD140a+ MCs (n=3). (C) As depicted in the schematic (left), lipid content was measured in implanted AT3-mCherry cells (n=6). (D) Real-time analysis of oxygen consumption rate (OCR) in AT3 cells after incubated with CM from WT or AtglΔMCs lung MCs. Basal ΔOCR and maximal (Max) ΔOCR were quantified (n=3). (E) The proliferation of AT3 cells was measured after incubated with CM from WT or AtglΔMCs lung MCs (n=3). (F) As depicted in the schematic (left), metastasis colonization potentials of AT3-Luc cells were measured after incubated with CM from WT or AtglΔMCs lung MCs (n=8). (G) Comparison of the chemoresistant capacities of AT3 cells after incubated with CM from WT or AtglΔMCs lung MCs (n=3). DOX, doxorubicin; PTX, paclitaxel. (H) As depicted in the schematic (left), lung metastasis in WT or AtglΔMCs mice was determined before and after treatment with DOX (n=10). n represents the number of biological replicates. The results are representative of three independent experiments (A-H) and shown as mean ± SEM. Statistical significance was determined by one-way ANOVA (B, D), unpaired Student’s t-test (C), two-way ANOVA (E, G), Mann-Whitney test (F) or Paired t test (H). *p< 0.05, **p< 0.01, ***p< 0.001, ****p< 0.0001; NS, not significant. See also Figure S5.
Figure 6.
Figure 6.. Lipid-laden MCs metabolically reprogram NK cells leading to NK cell dysfunction.
(A-C) Lipid content (A), OCR (B) and extracellular acidification rate (ECAR) (C) was measured in lung NK cells from WT and AtglΔMCs mice (n=5–6). (D-E) The frequencies of lung interferon-gamma (IFNγ)+, granzyme B (GZMB)+ and perforin-1 (PRF1)+ NK cells (D) and the expression of Ifng, Gzmb and Prf1 in lung NK cells (E) were determined in WT and AtglΔMC mice (n=5–6). (F) Comparison of the tumoricidal activities of lung NK cells (n=3) from WT and AtglΔMC mice against indicated tumor cells. (G) As depicted in the schematic (left), lung metastasis colonization of AT3-Luc cells was measured after the recipient NSG mice were treated with lung NK cells derived from WT or AtglΔMC mice (n=8). (H-J) As depicted in the schematic (H), the lipids incorporated into the AT3 cells (I; scale bars, 10 μm) or NK cells (J; scale bars, 5 μm) were detected with confocal microscopy and flow cytometry (n=4). (K) Western blot showing the expression of exosomal markers in the CM portions from AtglΔMCs lung MCs. (L) As depicted in the schematic (left), the PKH26 signal in AT3 cells (middle) and lung NK cells (right) was measured (n=5). (M-N) The lipids incorporated into AT3 cells (M) or NK cells (N) were detected with confocal microscopy (scale bars, 10 μm) or flow cytometry after incubated with indicated endocytosis inhibitors and CM from AtglΔMCs lung MCs (n=4). (O) As depicted in the schematic (left), the effect of LY294002 in controlling lung metastasis was determined (n=8). n represents the number of biological replicates. The results are representative of three (A-F, I-N) or two (G, O) independent experiments and shown as mean ± SEM. Statistical significance was determined by unpaired Student’s t-test (A-E, L), two-way ANOVA (F), Mann-Whitney test (G) or one-way ANOVA (I-J, M-O). *p< 0.05, **p< 0.01, ***p< 0.001, ****p< 0.0001; NS, not significant. See also Figure S6.
Figure 7.
Figure 7.. Blockage of IL-1β mitigates lung metastasis and improves the efficacy of NK cell-based immunotherapy.
(A-B) As depicted in the schematic (Figure 2H, left), the lipid content in lung NK cells (A) and the frequencies of lung IFNγ+ NK cells (B) were determined at the endpoint (n=6). (C) As depicted in the schematic, the effect of anti-IL-1β in controlling lung metastasis was determined (n=10). (D-E) As depicted in the schematic, the combined effect of anti-IL-1β and adoptive transfer of mouse NK cells (D) or human NK-92 cells (E) in controlling lung metastasis was determined (n=6–8). n represents the number of biological replicates. The results are representative of two (A-E) independent experiments and shown as mean ± SEM. Statistical significance was determined by one-way ANOVA (A-B, D-E) or Mann-Whitney test (C). *p< 0.05, **p< 0.01, ***p< 0.001, ****p< 0.0001. See also Figure S7.

Comment in

References

    1. Chaffer CL & Weinberg RA A perspective on cancer cell metastasis. Science 331, 1559–1564 (2011). - PubMed
    1. Massague J & Obenauf AC Metastatic colonization by circulating tumour cells. Nature 529, 298–306 (2016). - PMC - PubMed
    1. Peinado H et al. Pre-metastatic niches: organ-specific homes for metastases. Nat Rev Cancer 17, 302–317 (2017). - PubMed
    1. Psaila B & Lyden D The metastatic niche: adapting the foreign soil. Nat Rev Cancer 9, 285–293 (2009). - PMC - PubMed
    1. Miranda F et al. Salt-Inducible Kinase 2 Couples Ovarian Cancer Cell Metabolism with Survival at the Adipocyte-Rich Metastatic Niche. Cancer Cell 30, 273–289 (2016). - PubMed

Publication types