. 2023 Jan:317:115526.
doi: 10.1016/j.socscimed.2022.115526. Epub 2022 Nov 9.

Modification of temperature-related human mortality by area-level socioeconomic and demographic characteristics in Latin American cities

Affiliations

Modification of temperature-related human mortality by area-level socioeconomic and demographic characteristics in Latin American cities

Maryia Bakhtsiyarava et al. Soc Sci Med. 2023 Jan.

Abstract

Background: In Latin America, where climate change and rapid urbanization converge, non-optimal ambient temperatures contribute to excess mortality. However, little is known about area-level characteristics that confer vulnerability to temperature-related mortality.

Objectives: Explore city-level socioeconomic and demographic characteristics associated with temperature-related mortality in Latin American cities.

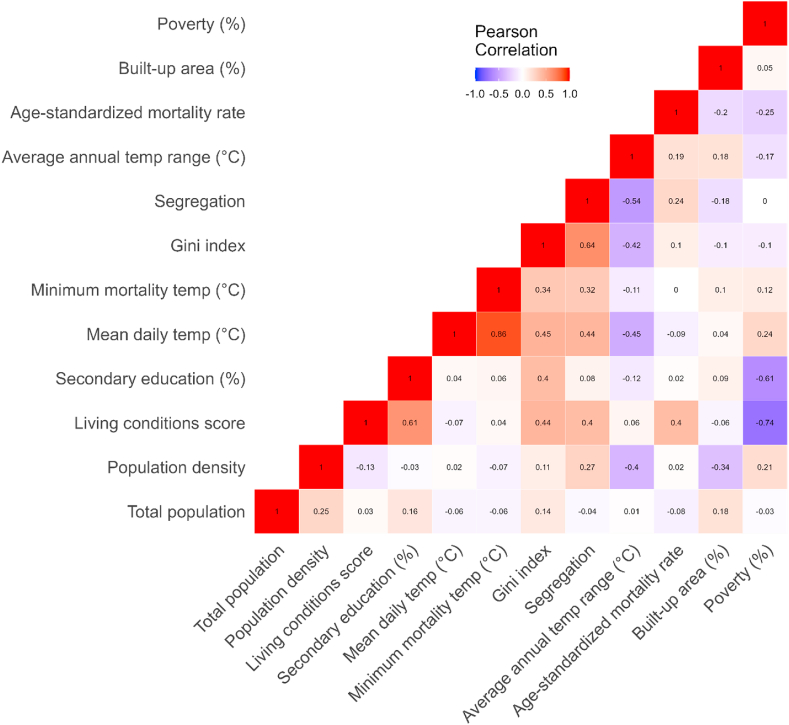
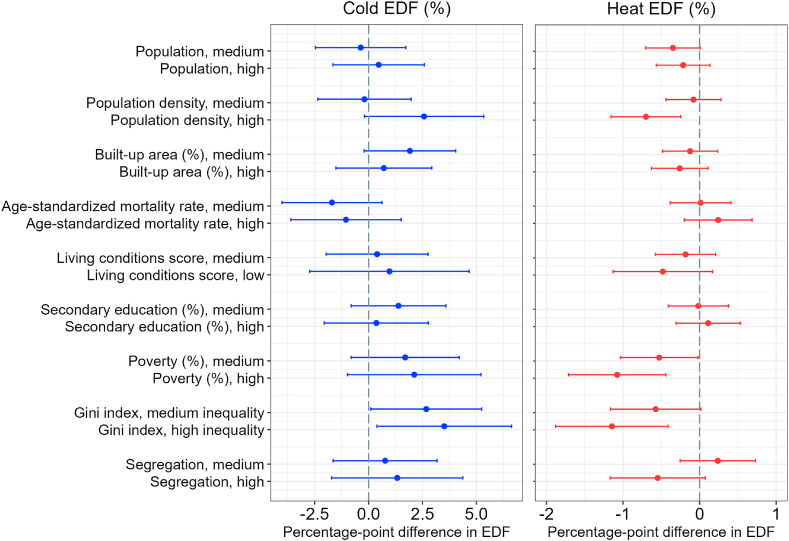
Methods: The dependent variables quantify city-specific associations between temperature and mortality: heat- and cold-related excess death fractions (EDF, or percentages of total deaths attributed to cold/hot temperatures), and the relative mortality risk (RR) associated with 1 °C difference in temperature in 325 cities during 2002-2015. Random effects meta-regressions were used to investigate whether EDFs and RRs associated with heat and cold varied by city-level characteristics, including population size, population density, built-up area, age-standardized mortality rate, poverty, living conditions, educational attainment, income inequality, and residential segregation by education level.

Results: We find limited effect modification of cold-related mortality by city-level demographic and socioeconomic characteristics and several unexpected associations for heat-related mortality. For example, cities in the highest compared to the lowest tertile of income inequality have all-age cold-related excess mortality that is, on average, 3.45 percentage points higher (95% CI: 0.33, 6.56). Higher poverty and higher segregation were also associated with higher cold EDF among those 65 and older. Large, densely populated cities, and cities with high levels of poverty and income inequality experience smaller heat EDFs compared to smaller and less densely populated cities, and cities with little poverty and income inequality.

Discussion: Evidence of effect modification of cold-related mortality in Latin American cities was limited, and unexpected patterns of modification of heat-related mortality were observed. Socioeconomic deprivation may impact cold-related mortality, particularly among the elderly. The findings of higher levels of poverty and income inequality associated with lower heat-related mortality deserve further investigation given the increasing importance of urban adaptation to climate change.

Keywords: Climate change; Latin America; Temperature-related mortality; Urban health.


Conflict of interest statement

Declaration of competing interest The authors declare no competing interests.

Figures

Fig. 1
Fig. 1
City-specific mean daily temperature and population size.
Fig. 2
Fig. 2
Correlations between pairs of the temperature, socioeconomic, and demographic indicators used in the study.
Fig. 3
Fig. 3
Difference in excess death fractions (EDF) of all-cause mortality associated with cold and hot temperatures by levels of the socioeconomic and demographic characteristics of Latin American cities. Cold temperatures are defined as those below the minimum mortality temperature. Hot temperatures are defined as those above the minimum mortality temperature. Point estimates and 95% confidence intervals are obtained from the random effects meta-regressions that include a socioeconomic indicator, city-level mean daily temperature, mean annual temperature range, climate zone, and country. Separate meta-regressions were fitted for each indicator. The socioeconomic characteristics were categorized as low, medium, and high according to the tertiles of their distribution. The reference category for each effect modifier are cities with desirable levels of the indicator (e.g., low poverty, high living conditions, etc.). In the case of population, population density, and % urban area, the reference are cities with low (bottom tertile) values of these characteristics. Refer to Table 1 for variables' definition. Supplementary Material Table S2 contains the estimates and confidence intervals shown in the figure. The analysis is based on 325 cities for all variables except poverty (n = 319 cities), Gini index (n = 296), and segregation (n = 303).
Fig. 4
Fig. 4
Interaction relative risks (IRRs) of all-cause mortality per 1 °C more extreme cold and extreme hot temperatures by levels of the socioeconomic characteristics of Latin American cities. The IRRs represent proportional difference in RR per 1 °C associated with the given characteristic. RR for extreme cold was computed by dividing the difference in log-relative risk of mortality between temperatures at the 1st and 5th percentile of the city-specific daily mean temperature distribution by the difference in degrees Celsius between the 1st percentile and 5th percentile of the temperature distribution, and exponentiating the quotient. RR for heat was analogously obtained as the difference between the log-relative risk of mortality at the 99th and 95th percentile of the city-specific observed distribution of daily temperatures divided by the difference in degrees Celsius between the 99th percentile and 95th percentile of the temperature distribution, and exponentiating the quotient. For extreme cold, the IRR results can be interpreted as a difference in the relative risk of mortality associated with a 1 °C decrease in mean daily temperature below the 5th percentile of the temperature distribution. For extreme heat, the IRR results present an estimated change in the relative risk of mortality associated with a 1 °C increase in daily mean temperature above the 95th percentile of the temperature distribution. Point estimates and 95% confidence intervals are obtained from the random effects meta-regressions that include a socioeconomic indicator, mean daily temperature, mean annual temperature range, climate zone, and country group. Separate meta-regressions were fitted for each socioeconomic indicator. The reference category for each socioeconomic effect modifier are cities with desirable levels of the indicator (e.g., low poverty, high living conditions score, etc.). In the case of population, population density, and % urban area, the reference are cities with low absolute values (bottom tertile) of these characteristics. The analysis is based on 325 cities for all variables except poverty (n = 319 cities), Gini index (n = 296), and segregation (n = 303). Supplementary Material Table S4 contains the estimates and confidence intervals shown in the figure.

References

    1. Adger W.N. Vulnerability. Glob. Environ. Change. 2006;16:268–281.
    1. Åström D.O., et al. Heat-wave related mortality in Sweden: a case-crossover study investigating effect modification by neighbourhood deprivation. Scand. J. Publ. Health. 2020;48:428–435. - PMC - PubMed
    1. Avashia V., Garg A., Dholakia H. Understanding temperature related health risk in context of urban land use changes. Landsc. Urban Plann. 2021;212
    1. Balbus J.M., Malina C. Identifying vulnerable subpopulations for climate change health effects in the United States. J. Occup. Environ. Med. 2009;51:33–37. - PubMed
    1. Barnard L.F.T., Baker M.G., Hales S., Howden-Chapman P.L. Excess winter morbidity and mortality: do housing and socio-economic status have an effect? Rev. Environ. Health. 2008;23:203–221. - PubMed

Publication types