. 2022 Dec;612(7939):283-291.
doi: 10.1038/s41586-022-05453-y. Epub 2022 Dec 7.

A 2-million-year-old ecosystem in Greenland uncovered by environmental DNA

Collaborators, Affiliations

A 2-million-year-old ecosystem in Greenland uncovered by environmental DNA

Kurt H Kjær et al. Nature. 2022 Dec.

Abstract

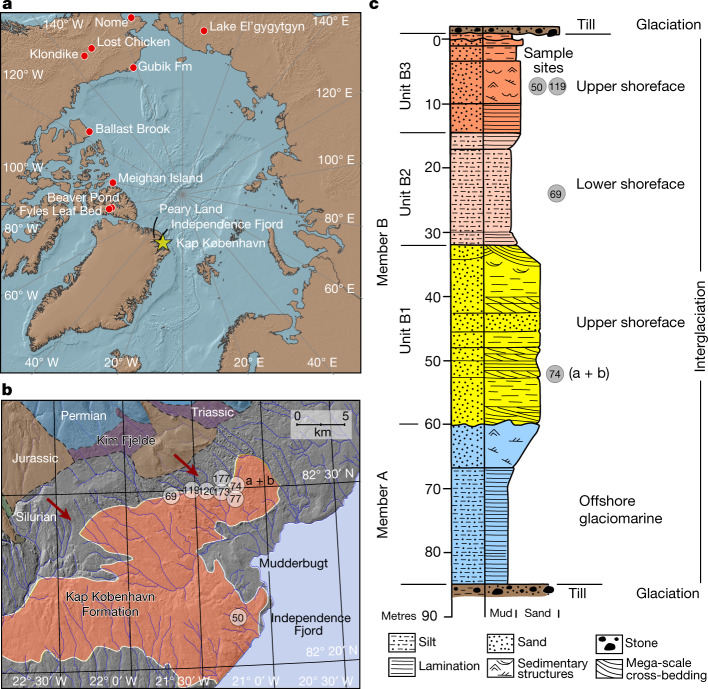
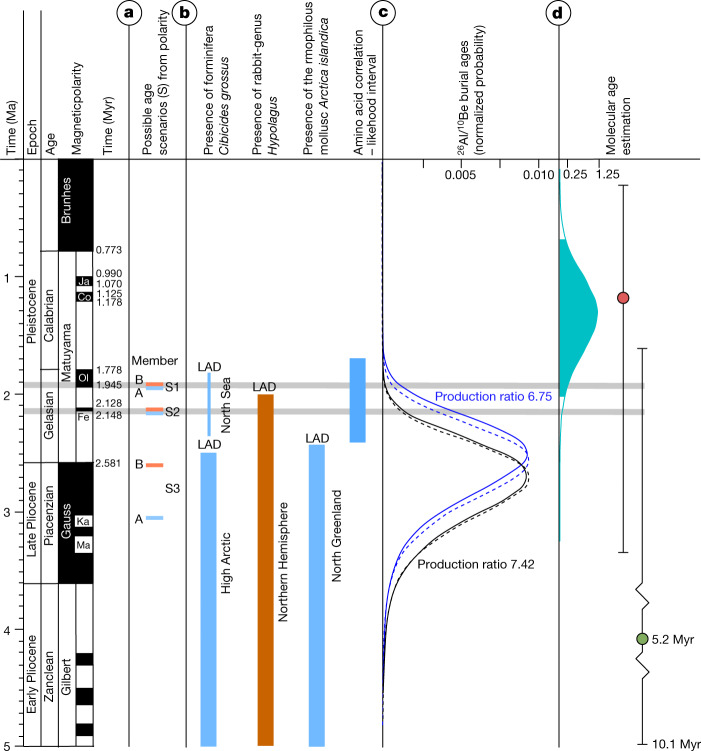
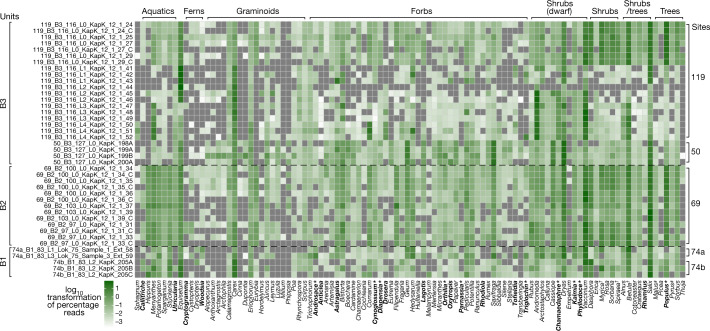
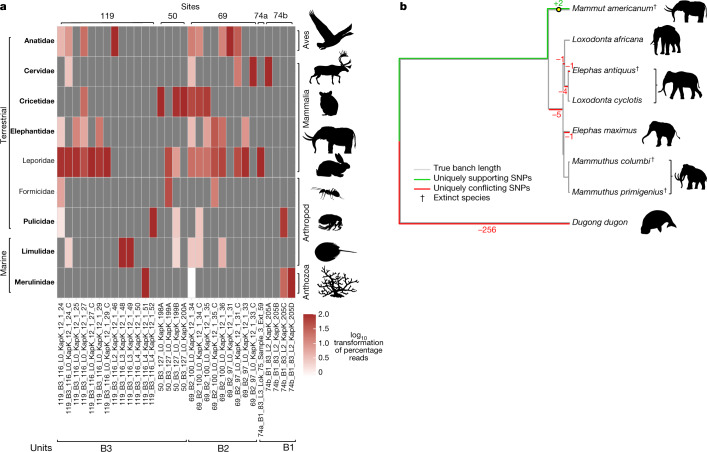
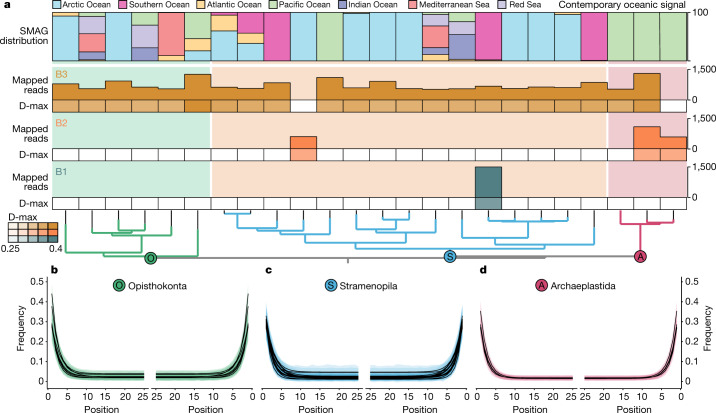
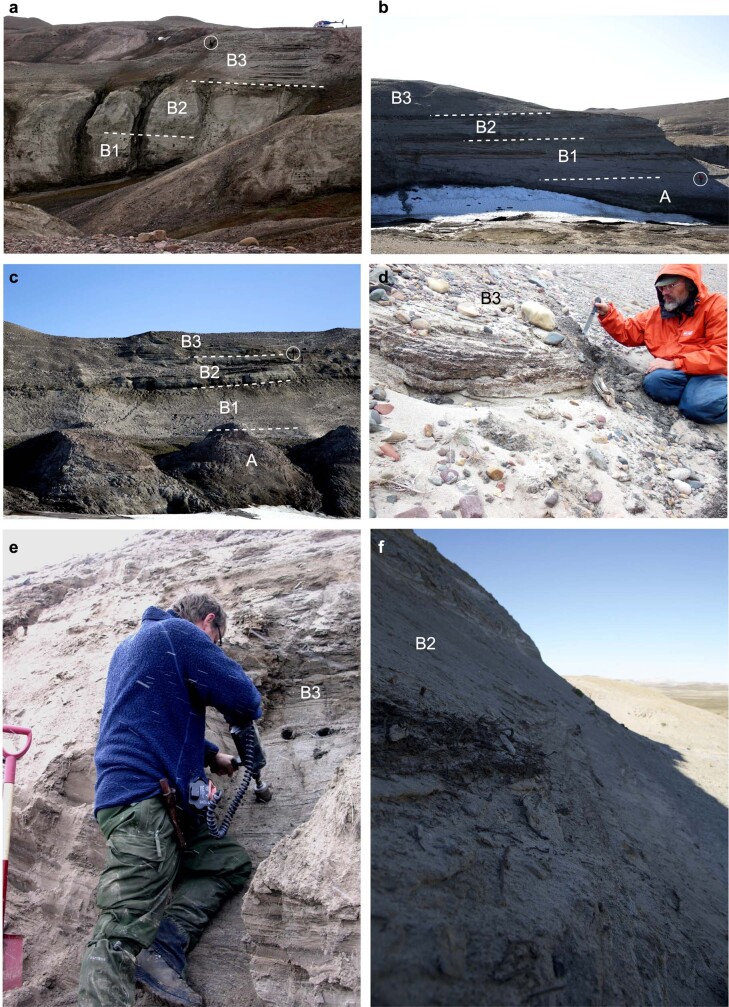
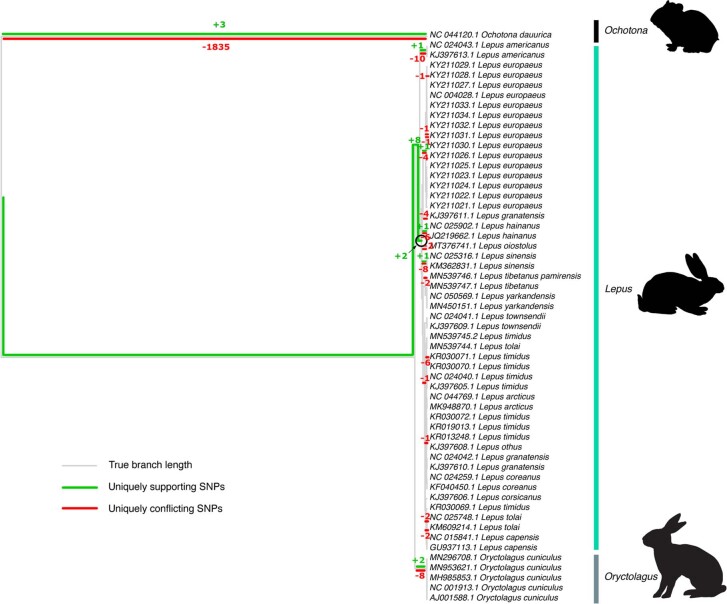
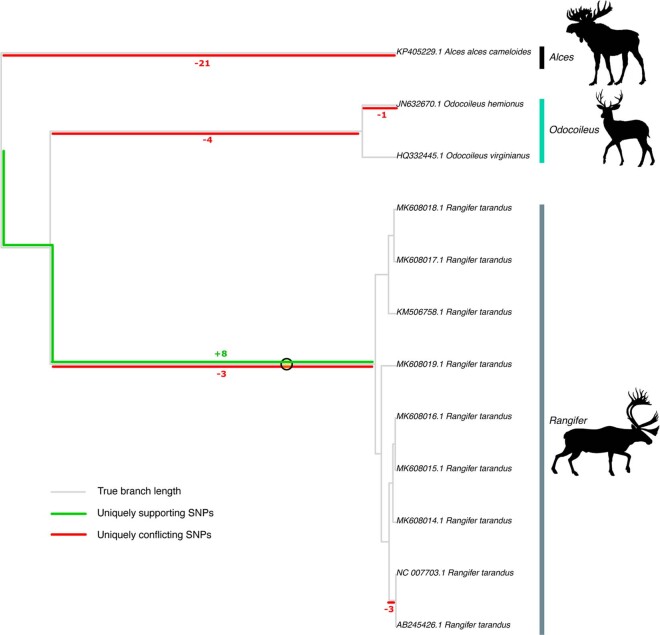
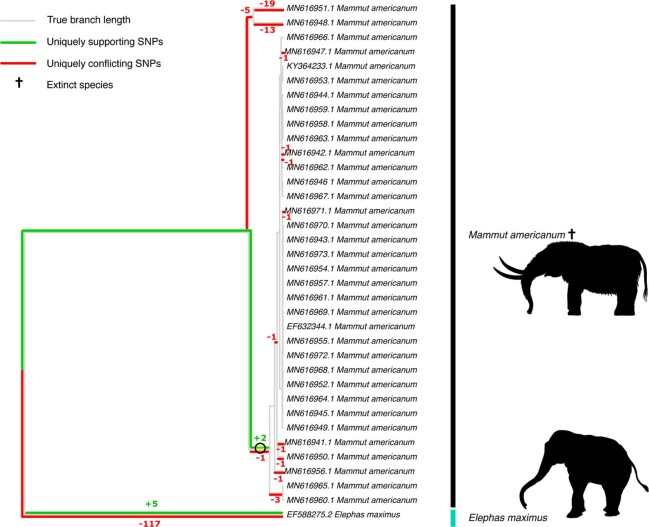
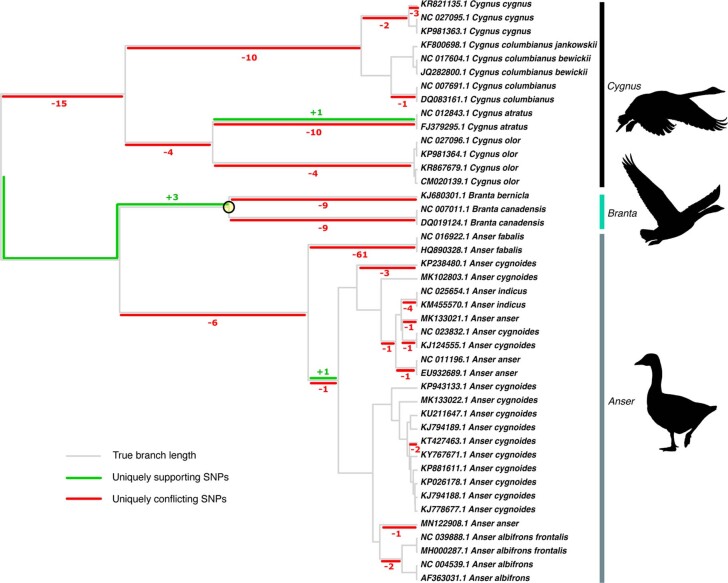
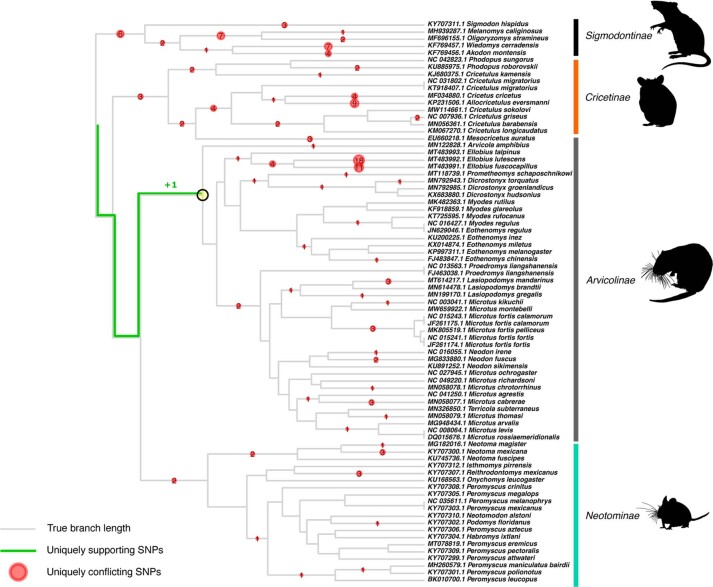
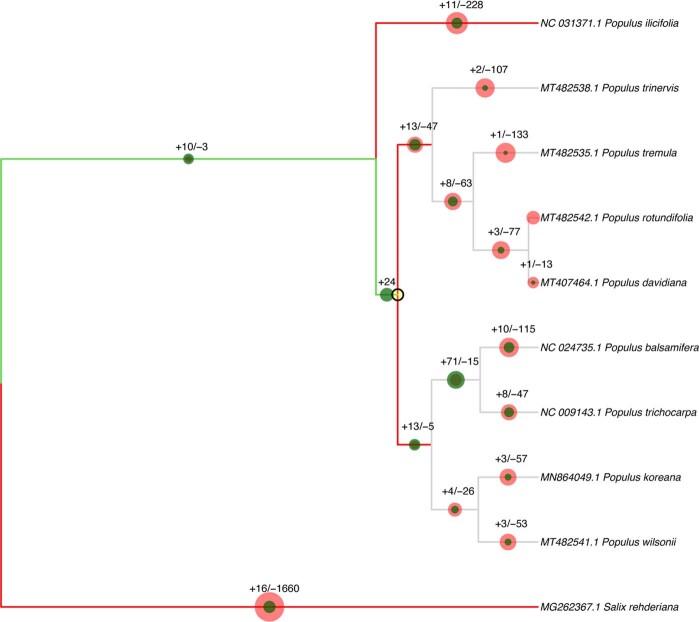
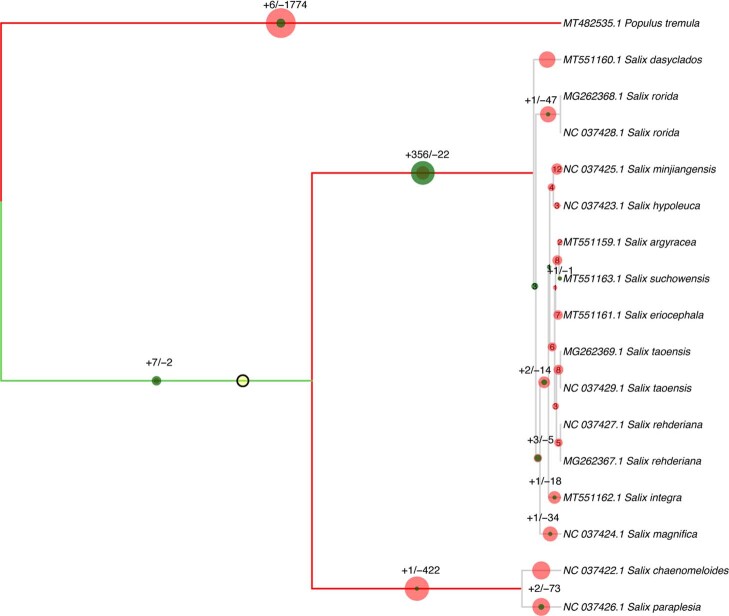
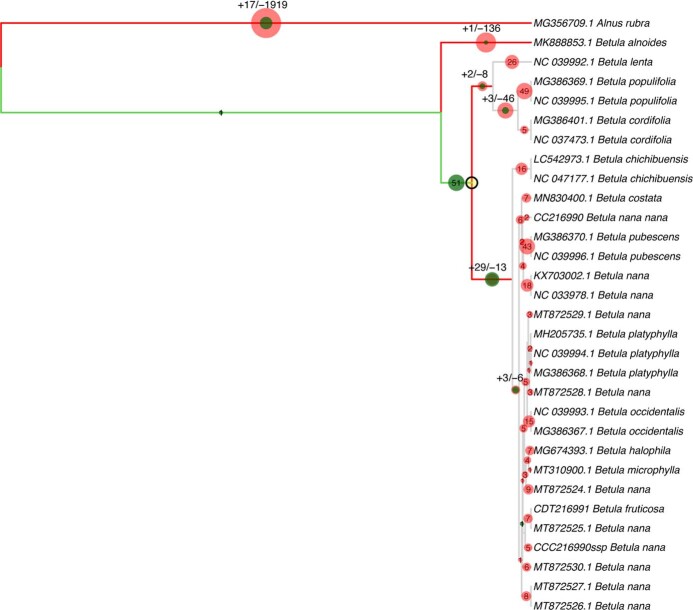
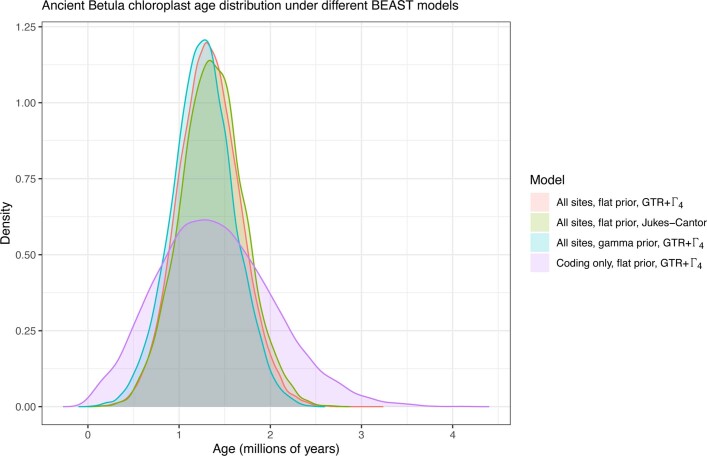
Late Pliocene and Early Pleistocene epochs 3.6 to 0.8 million years ago1 had climates resembling those forecasted under future warming2. Palaeoclimatic records show strong polar amplification with mean annual temperatures of 11-19 °C above contemporary values3,4. The biological communities inhabiting the Arctic during this time remain poorly known because fossils are rare5. Here we report an ancient environmental DNA6 (eDNA) record describing the rich plant and animal assemblages of the Kap København Formation in North Greenland, dated to around two million years ago. The record shows an open boreal forest ecosystem with mixed vegetation of poplar, birch and thuja trees, as well as a variety of Arctic and boreal shrubs and herbs, many of which had not previously been detected at the site from macrofossil and pollen records. The DNA record confirms the presence of hare and mitochondrial DNA from animals including mastodons, reindeer, rodents and geese, all ancestral to their present-day and late Pleistocene relatives. The presence of marine species including horseshoe crab and green algae support a warmer climate than today. The reconstructed ecosystem has no modern analogue. The survival of such ancient eDNA probably relates to its binding to mineral surfaces. Our findings open new areas of genetic research, demonstrating that it is possible to track the ecology and evolution of biological communities from two million years ago using ancient eDNA.


Conflict of interest statement

The authors declare no competing interests.

Figures

Fig. 1
Fig. 1. Geographical location and depositional sequence.
a. Location of Kap København Formation in North Greenland at the entrance to the Independence Fjord (82° 24′ N 22° 12′ W) and locations of other Arctic Plio-Pleistocene fossil-bearing sites (red dots). b, Spatial distribution of the erosional remnants of the 100-m thick succession of shallow marine near-shore sediments between Mudderbugt and the low mountains towards the north (a + b refers to location 74a and 74b). c, Glacial–interglacial division of the depositional succession of clay Member A and units B1, B2 and B3 constituting sandy Member B. Sampling intervals for all sites are projected onto the sedimentary succession of locality 50. Sedimentological log modified after ref. . Circled numbers on the map mark sample sites for environmental DNA analyses, absolute burial dating and palaeomagnetism. Numbered sites refer to previous publications,,,,.
Fig. 2
Fig. 2. Age proxies for the Kap København Formation.
a, Revised palaeomagnetic analysis shows unit B2 to have normal polarity and unlocks three possible age scenarios (S1–S3) including Members A (blue) and B (brown). Normal polarity is coloured black and reverse polarity is shown in white. Ja, Jaramillo; Co, Cobb Mountain; Ol, Olduvai; Fe, Feni; Ka, Kaena; Ma, Mammoth. b, Presence and last appearance datum (LAD) for marine foraminifera Cibicides grossus, rabbit-genus Hypolagus and the mollusc Arctica islandica in the High Arctic, Northern Hemisphere and North Greenland, respectively. The blue band on the far right indicates the age range for Member A estimated from amino acid ratios on shells. c, Convolved probability distribution functions for cosmogenic burial ages calculated for two different production ratios (7.42 (black) and 6.75 (blue)). The dashed line and the solid line show the distributions for steady erosion and zero erosion, respectively. These distributions are all maximum ages. d, Molecular dating of Betula sp. yielding a median age of the DNA in the sediment of 1.323 Myr, with whiskers confining the 95% height posterior density (HPD) of 0.68 to 2.02 Myr (blue density plot), running Markov chain Monte Carlo estimation for 100 million iterations. The red dot is the median molecular age estimate found using the Mastodon mitochondrial genome restricting to radiocarbon-dated specimens, whereas the green area includes molecular clock estimated specimens in BEAST, running Markov chain Monte Carlo estimation for 400 million iterations. Whiskers confine the 95% HPD.
Fig. 3
Fig. 3. Early Pleistocene plants of northern Greenland.
Taxonomic profiles of the plant assemblage found in the metagenomes. Taxa in bold are genera only found as DNA and not as macrofossil or pollen. Asterisks indicate those that are found at other Pliocene Arctic sites. Extinct species as identified by either macrofossils or phylogenetic placements are marked with a dagger. Reads classified as Pyrus and Malus are marked with a pound symbol, and are probably over-classified DNA sequences belonging to another species within Rosaceae that are not present as a reference genome.
Fig. 4
Fig. 4. Early Pleistocene animals of northern Greenland.
a, Taxonomic profiles of the animal assemblage from units B1, B2 and B3. Taxa in bold are genera only found as DNA. b, Phylogenetic placement and pathPhynder results of mitochondrial reads uniquely classified to Elephantidae or lower (Source Data 1). Extinct species as identified by either macrofossils or phylogenetic placements are marked with a dagger.
Fig. 5
Fig. 5. Marine planktonic eukaryotes identified at the Kap København Formation.
a, Detection of SMAGs and average damage (D-max) of a SMAG within a member unit. Top, the SMAG distribution in contemporary oceans based on the data of Delmont et al.. The SMAGs are ordered on the basis of phylogenomic inference from Delmont et al.. bd, Distribution of DNA damage among the taxonomic supergroup Opisthokonta (b), Stramenopila (c) and Archaeplastida (d) (Source Data 1).
Extended Data Fig. 1
Extended Data Fig. 1. Setting A.
Type locality 50 indicating units in formation b. Overview locality 74a+b with a complete sediment sequence. C. Overview of locality 69. D. Detail of organic rich sediment in unit B3 before excavation and cleaning for ancient eDNA samples. E. Sampling in the permafrost within unit B3 at locality 50. F. Organic rich sediment at the base of mega-scale cross-bedding within unit B2 at locality 74a+b. White circles mark persons for scale.
Extended Data Fig. 2
Extended Data Fig. 2. Phylogenetic placement results of Leporidae mitochondrial reads, using transversion SNPs only.
Reads have been merged from all layers and sites. The green numbers on each edge represent the number of supporting (+) SNPs, whereas the red numbers indicate conflicting (−) SNPs in the ancient Leporidae environmental mitochondrial genome overlapping the reference SNPs assigned to the respective edge. There is a clear placement for the ancient Leporidae environmental mitochondrial genome on the edge marked +2, basal to the extant Lepus lineage.
Extended Data Fig. 3
Extended Data Fig. 3. Phylogenetic placement results for representatives of the Capreolinae mitochondrial reads, using transversion SNPs only.
Reads have been merged from all layers and sites. The green numbers on each edge represent the number of supporting (+) SNPs, whereas the red numbers indicate conflicting (−) SNPs in the ancient Capreolinae environmental mitochondrial genome overlapping the reference SNPs assigned to the respective edge. There is a clear placement for the ancient Capreolinae environmental mitochondrial genome on the edge marked +8/−3, basal to the Rangifer genus.
Extended Data Fig. 4
Extended Data Fig. 4. Phylogenetic placement of Elephantidae mitochondrial reads within mastodons (Mammut americanum), using Elephas maximus as outgroup, including transitions and transversion SNPs.
(Please note that the NCBI taxonomy includes the Mammut genus within Elephantidae). The reference dataset consisted of mitochondria from mastodons (Mammut americanum) only and one Elephas maximus as an outgroup. Reads have been merged from all layers and sites. The green numbers on each edge represent the number of supporting (+) SNPs, whereas the red numbers indicate conflicting (−) SNPs in the ancient Elephantidae environmental mitochondrial genome overlapping the reference SNPs assigned to the respective edge. There is a placement for the ancient Elephantidae environmental mitochondrial genome on the edge marked +2/−1, identifying it as basal to the mastodon (Mammut americanum) clade, which contains most of all mastodon reference mitochondrial genomes. Please note that this placement is based on two transition SNPs with a read depth of three reads per SNP.
Extended Data Fig. 5
Extended Data Fig. 5. Phylogenetic placement of mitochondrial reads assigned within Anatidae and placed with representatives of the Anatidae, using transversion SNPs only.
Reads have been merged from all layers and sites. The green numbers on each edge represent the number of supporting (+) SNPs, whereas the red numbers indicate conflicting (−) SNPs in the ancient Anatidae environmental mitochondrial genome overlapping the reference SNPs assigned to the respective edge. There is a clear placement for the ancient Anatidae environmental mitochondrial genome on the edge marked +3, basal to the Branta genus.
Extended Data Fig. 6
Extended Data Fig. 6. Phylogenetic placement results of Cricetidae mitochondrial reads, using transversion SNPs only.
Reads have been merged from all layers and sites. The green numbers on each edge represent the number of supporting (+) SNPs, whereas the red numbers in the red circles indicate conflicting (−) SNPs in the ancient Cricetidae environmental mitochondrial genome overlapping the reference SNPs assigned to the respective edge. There is a placement for the ancient Cricetidae environmental mitochondrial genome on the edge marked +1, basal to the Arvicolinae subfamily.
Extended Data Fig. 7
Extended Data Fig. 7. Phylogenetic placement results for our Populus chloroplast reads, using both transition and transversion SNPs, and using reads merged from all layers and sites.
The numbers on each edge represent the number of supporting (+) and conflicting (−) SNPs in the ancient Populus environmental genome overlapping the reference SNPs assigned to that edge. The ancient Populus environmental genome clearly contains a mixture of different species. The most likely placement is on the edge above Populus trichocarpa (NC 009143.1) and Populus balsamifera (NC 024735.1), with +71/−15 supporting and conflicting SNPs. However, we find some support for both branches directly leading to these species as well. Populus balsamifera and P. trichocarpa are considered sister species. They are both distributed in North America, as far North as Alaska, are known to hybridise both among themselves and other Populus species and are morphologically very similar,,. Previous analyses found a very recent nuclear genome divergence time of only 75000 years ago for Populus trichocarpa and P. balsamifera, but a deep chloroplast genome divergence time of at least 6-7 Ma, which is an uncommon pattern in plants. Our ancient Populus sample could contain individuals either ancestral to, or hybridized from, the modern Populus trichocarpa and P. balsamifera species.
Extended Data Fig. 8
Extended Data Fig. 8. Phylogenetic placement results for our Salix chloroplast reads, using both transition and transversion SNPs, and using reads merged from all layers and sites.
The numbers on each edge represent the number of supporting (+) and conflicting (−) SNPs in the ancient Salix environmental genome overlapping the reference SNPs assigned to that edge. The ancient Salix environmental genome falls basal to a main Salix clade. Our ancient Salix sample is phylogenetically placed, with 356 supporting SNPs and 22 conflicting SNPs, on a basal branch leading to the main clade. Although the Salix chloroplast phylogeny is not considered fully resolved, the difficulties in resolution lie underneath our placement branch, and this along with the high number of SNPs on the placement branch allow us to be confident in the placement position. Our chloroplast phylogeny agrees roughly with, which estimated a divergence date between these two main Salix clades at 16.9 Ma, and a root age of the first clade, to which our ancient sample is basal to, of 8.1 Ma. It is reasonable, then, to conclude that our ancient Salix sample is at least 8.1 Ma diverged from modern Salix species, and probably represents an extinct species, or extant species without a reference genome sequenced, or a pool thereof.
Extended Data Fig. 9
Extended Data Fig. 9. Phylogenetic placement results for our Betula chloroplast reads, using both transition and transversion SNPs, and using reads merged from all layers and sites.
Our ancient Betula sample was placed basal to a main Betula clade, based on 29 supporting (green) and 13 conflicting (red) SNPs on its placement branch, and with very low numbers of supporting SNPs elsewhere in the tree other than those leading to this branch. This placement agrees with the BEAST molecular dating analysis (see Molecular Dating Methods).
Extended Data Fig 10
Extended Data Fig 10. Molecular age distribution.
Results of running the ancient Betula chloroplast molecular dating analysis BEAST v1.10.4 (ref. ) with different priors and nucleotide substitution models. Using only coding regions, and therefore fewer total sites, gives a larger confidence interval as expected. Results reported in the text are for the red curve, with a flat prior and a GTR+Γ4 substitution model.

References

    1. Salzmann N, et al. Glacier changes and climate trends derived from multiple sources in the data scarce Cordillera Vilcanota region, southern Peruvian Andes. Cryosphere. 2013;7:103–118. doi: 10.5194/tc-7-103-2013. - DOI
    1. IPCC Climate Change 2013: The Physical Science Basis (eds Stocker, T. F. et al.) (Cambridge Univ. Press, 2013).
    1. Brigham-Grette J, et al. Pliocene warmth, polar amplification, and stepped Pleistocene cooling recorded in NE Arctic Russia. Science. 2013;340:1421–1427. doi: 10.1126/science.1233137. - DOI - PubMed
    1. Gosse JC, et al. PoLAR-FIT: Pliocene Landscapes and Arctic Remains—Frozen in Time. Geosci. Can. 2017;44:47–54. doi: 10.12789/geocanj.2017.44.116. - DOI
    1. Matthews JV, Telka A, Jr, Kuzmina SA. Late Neogene insect and other invertebrate fossils from Alaska and Arctic/Subarctic Canada. Zool. Bespozvon. 2019;16:126–153.

Publication types

Substances