. 2022 Dec 7;13(1):7535.
doi: 10.1038/s41467-022-35071-1.

CD1a promotes systemic manifestations of skin inflammation

Affiliations

CD1a promotes systemic manifestations of skin inflammation

Clare S Hardman et al. Nat Commun. .

Abstract

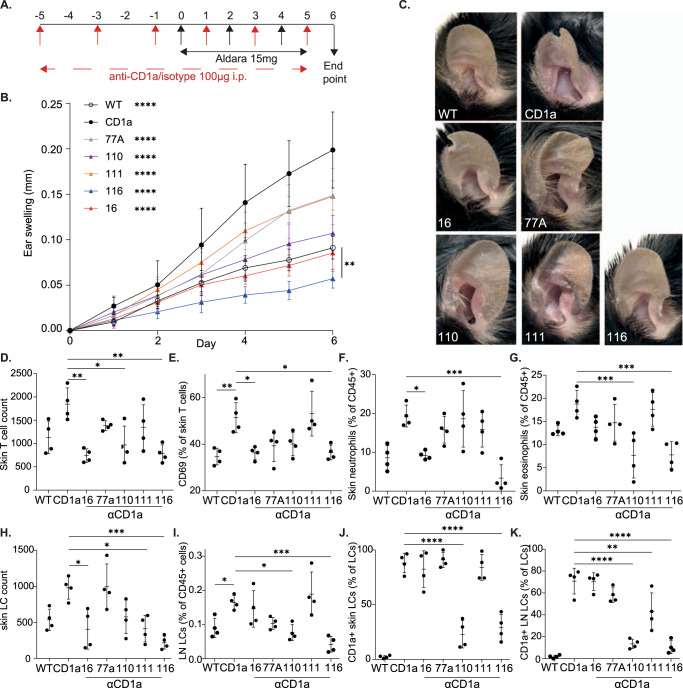
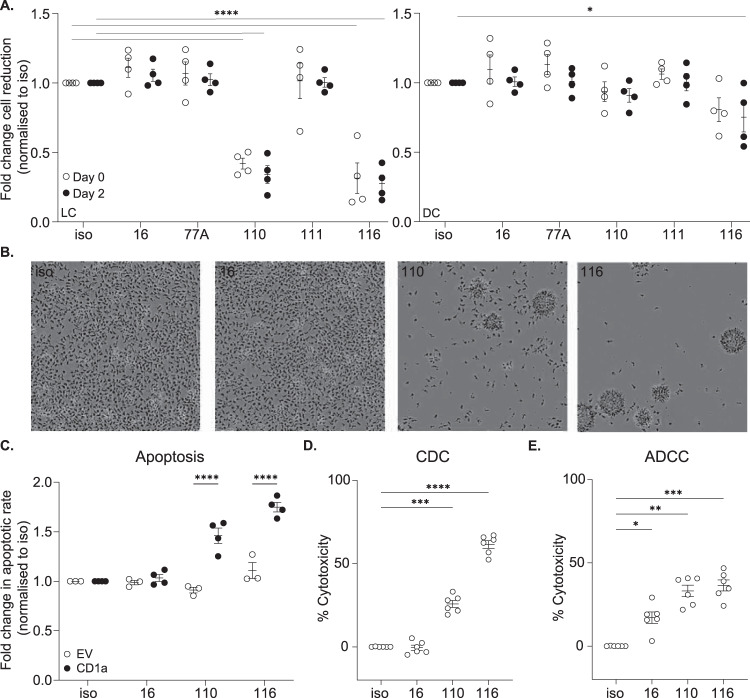
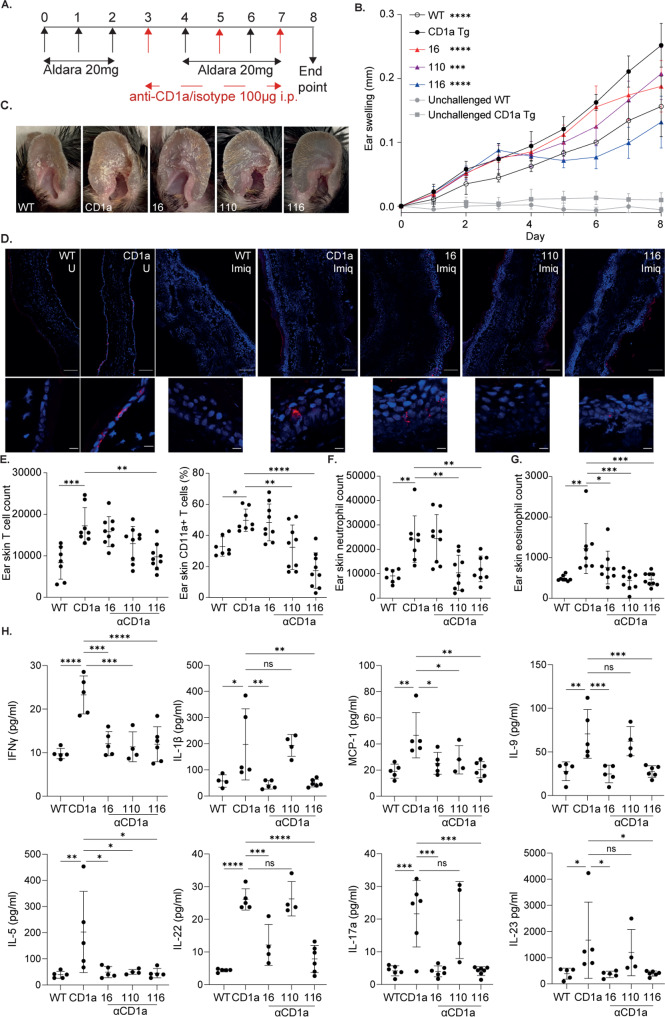
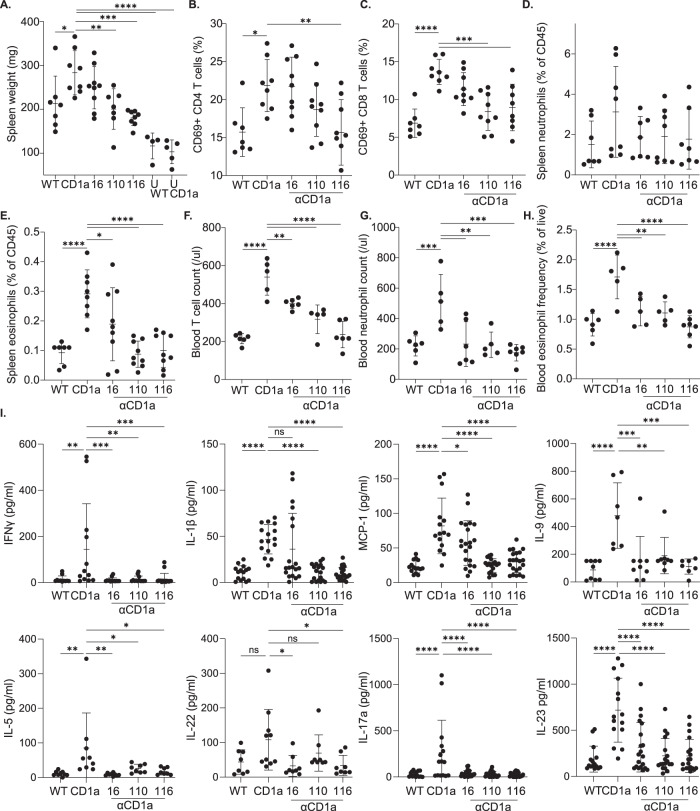
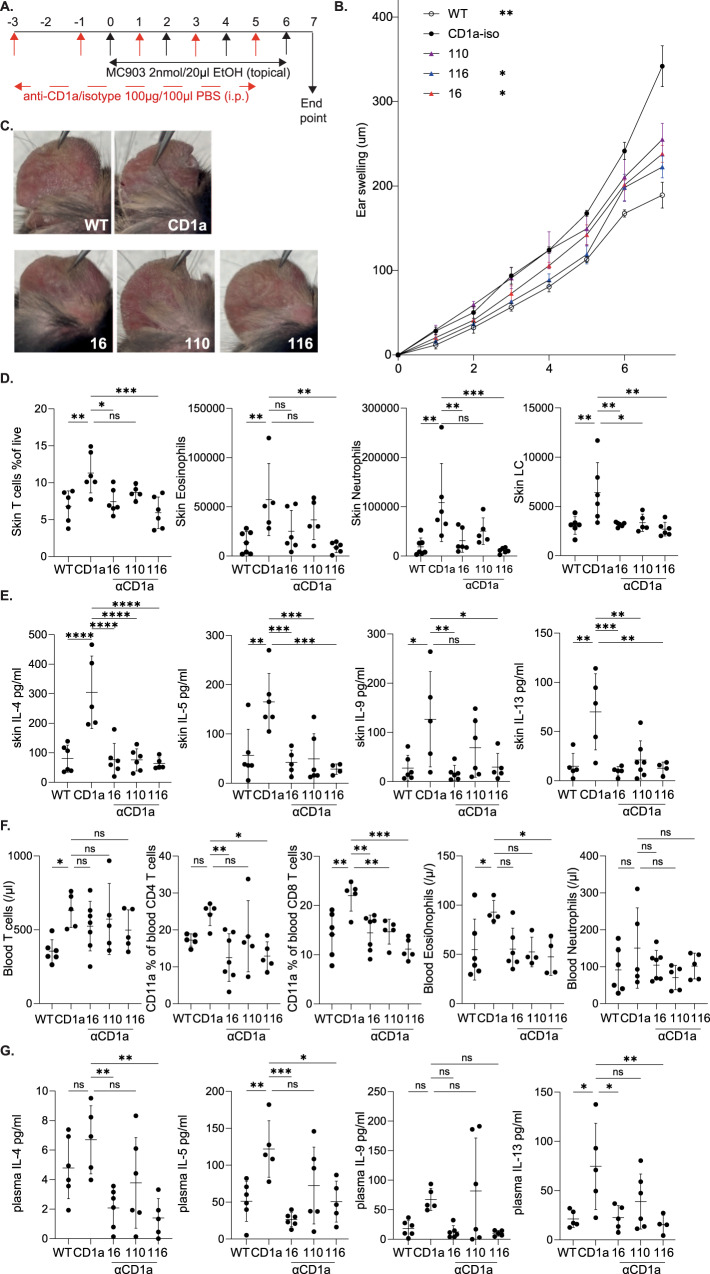
Inflammatory skin conditions are increasingly recognised as being associated with systemic inflammation. The mechanisms connecting the cutaneous and systemic disease are not well understood. CD1a is a virtually monomorphic major histocompatibility complex (MHC) class I-like molecule, highly expressed by skin and mucosal Langerhans cells, and presents lipid antigens to T-cells. Here we show an important role for CD1a in linking cutaneous and systemic inflammation in two experimental disease models. In human CD1a transgenic mice, the toll-like receptor (TLR)7 agonist imiquimod induces more pronounced splenomegaly, expansion of the peripheral blood and spleen T cell compartments, and enhanced neutrophil and eosinophil responses compared to the wild-type, accompanied by elevated skin and plasma cytokine levels, including IL-23, IL-1α, IL-1β, MCP-1 and IL-17A. Similar systemic escalation is shown in MC903-induced skin inflammation. The exacerbated inflammation could be counter-acted by CD1a-blocking antibodies, developed and screened in our laboratories. The beneficial effect is epitope dependent, and we further characterise the five best-performing antibodies for their capacity to modulate CD1a-expressing cells and ameliorate CD1a-dependent systemic inflammatory responses. In summary, we show that a therapeutically targetable CD1a-dependent pathway may play a role in the systemic spread of cutaneous inflammation.


Conflict of interest statement

C.S.H., Y.-L.C. and G.S.O. are on filed patents pertaining to the antibodies. R. Murren, D.M., J.P.S., R. Munro, W.Y.C., V.O.D., C.D., P.M., A.P. and D.L. are employees of UCB Pharma, which has initial licensing rights to the antibodies. The authors have no additional competing interests to declare.

Figures

Fig. 1
Fig. 1. Characterization of CD1a transgenic mouse.
A Representative flow cytometry plots and B graphical summary of CD1a protein expression by wild-type (WT) and CD1a transgenic (CD1a Tg) C57BL/6 J mice. CD1a protein expression evaluated on (left-right) total live ear skin cells, CD45 + skin cells, dermal dendritic cells (dDCs, CD45+/CD11c+/langerin-) and Langerhans cells (LCs, CD45+/CD11c+/langerin+). n = 4 for all groups examined over 2 independent experiments. Mean ± SD is shown. n represents biologically independent animals in each group. C CD1a protein expression within ear skin of wild-type (WT) and CD1a transgenic (CD1a) mice, visualized by immunofluorescence. Cryosections were stained with DAPI (blue) and anti-CD1a AF-594 (OKT6, red), scale bars left to right 50, 50 and 10 µm. Data shown are representative of 3 independent experiments. D Frequency of T cells (T), Eosinophils (Eos.), Neutrophils (Neut.) and Langerhans cells (LC) in the skin of wild-type (WT) and CD1a transgenic (CD1a) mice as measured by flow cytometry as a percentage of CD45 + cells. n = 11 examined over 3 independent experiments. Grouped analysis multiple unpaired two-tailed t-tests with Holm-Sidak correction, mean ± SD, **P < 0.01; ***P < 0.001. Mean ± SD is shown. n represents biologically independent animals in each group. Exact p-values are recorded in Supplementary Table 1. Source Data are provided as a Source Data file.
Fig. 2
Fig. 2. Characterization of anti-CD1a antibodies in the inhibition of T-cell responses.
A Dose titration curve of polyclonal T-cell IFNγ response with increasing concentration of a refined panel of anti-CD1a antibody (0.01–10 µg/ml) as determined by ELISpot (n = 6 donors, mean ± SD). And table of half maximal inhibitory concentration (IC50) values (µg/ml) calculated for the panel of newly generated anti-CD1a antibodies and commercial antibodies (OKT6, HI149 and SK9). n = 6 biologically independent blood donors for all groups examined over 4 independent experiments. BD Characterization of anti-CD1a antibodies in the inhibition of CD1a-restricted T cells. n represents biologically independent CD1a-restricted T-cell lines. B, C Cytokine secretion response of CD1a-restricted T cells induced by empty-vector (EV)- or CD1a-transfected (CD1a)-K562 presenting endogenous ligands. Inhibition of IFNγ (B) and IL-22 (C) was assessed for the panel of anti-CD1a antibodies by flow cytometry. D IFNγ secretion response of CD1a-restricted T cells induced by CD1a-coated beads presenting endogenous ligands. Inhibition was assessed for the panel of newly generated anti-CD1a antibodies by flow cytometry. B n = 9 examined over 4 independent experiments. C n = 4 examined over 2 independent experiments. D n = 19 examined over 4 independent experiments. One-way-ANOVA with Dunnett’s or Tukey’s test, *P < 0.05; **P < 0.01; ***P < 0.001; ****P < 0.0001 where asterisk (*) indicates significance on comparison to “CD1a”, mean ± SEM). Exact p-values are recorded in Supplementary Table 2. Source Data are provided as a Source Data file.
Fig. 3
Fig. 3. CD1a epitope analysis.
A Matrix heatmap representation of CD1a antibody binding by flow cytometry as measured by CD1a-AF647 mean fluorescence intensity (MFI). Before staining of CD1a-K652 with anti-CD1a antibodies conjugated to fluorophore AF647 (horizontal axis), the relevant purified antibodies (vertical axis) were incubated with the cells to assess interference in CD1a binding of the AF647-conjugated antibodies. Greyscale shows degree of binding, with the tone in the top row (−) indicating no interference. Representative of 3 independent experiments. B Matrix heatmap representation of CD1a antibody binding to CD1a mutant proteins as represented by normalized CD1a-AF647 MFI. Biotinylated CD1a mutant proteins and wild-type CD1a proteins were conjugated to streptavidin magnetic beads and binding of the panel of AF647-conjugated anti-CD1a antibodies was determined by flow cytometry. Greyscale shows degree of binding as a percentage of parent CD1a minor allele. Examined over 4 independent experiments. C Summary of CD1a mutants that affect binding of anti-CD1a antibodies OX77a, OX111, OX16, OX110. The top surface of CD1a (grey) is formed by α 1 and α 2 helices. The approximate area of A’ roof/F’ portal is marked with pink and cyan bars. The side chains of residues mutated to alanine are shown in magenta (A’ roof) or cyan (F’ portal). Mutated residues that had a negative impact on binding to the corresponding Ab are labelled and their surface is coloured in red.
Fig. 4
Fig. 4. Characterization of anti-CD1a antibodies in vivo.
A Schematic of imiquimod-induced skin inflammation and anti-CD1a preventative administration. B Daily measurement of ear swelling induced by imiquimod treatment of wild-type (WT) and CD1a transgenic mice (CD1a) injected i.p. with mouse IgG1 isotype control and CD1a transgenic injected with the refined panel of anti-CD1a antibodies as in the schematic panel A. Mean ± SD is shown. n represents biologically independent animals in each group. B n = 6 for all groups examined over 3 independent experiments. Two-way-ANOVA with Tukey’s test, **P < 0.01; ****P < 0.0001 indicates significance at day 6 on comparison to “CD1a” or as shown. C Representative images of inflammation on day 6 of the imiquimod treatment of wild-type (WT) and CD1a transgenic mice (CD1a) injected i.p. with mouse IgG1 isotype control and CD1a transgenic injected with the refined panel of anti-CD1a antibodies as in the schematic panel A. DG Flow cytometric analysis of ear skin of mouse IgG1 isotype treated wild-type (WT) and CD1a transgenic (CD1a) and CD1a transgenic injected with the refined panel of anti-CD1a antibodies following the preventative model of administration (panel A). Skin T cells were enumerated (/ear) (D) and assessed for cell surface CD69 expression (E) and skin neutrophil (F) and eosinophil (G) frequency was determined. Skin (H) and draining lymph node (LN) (I) LCs were enumerated and assessed for cell surface CD1a expression (JK). DK n = 4 examined over 3 independent experiments. One-way-ANOVA with Tukey’s (DF, H, J, K) or Dunnett’s test (G, I), *P < 0.05; **P < 0.01; ***P < 0.001; ****P < 0.0001. Exact p-values are recorded in Supplementary Table 3. Source Data are provided as a Source Data file.
Fig. 5
Fig. 5. Analysis of anti-CD1a-antibody-induced phenotype change and cytotoxicity.
A Anti-CD1a antibodies or mouse IgG1 isotype control (iso, 5 µg/ml) were incubated with monocyte-derived Langerhans cells (LC) (left panel) and monocyte-derived dendritic cells (DC) (right panel) as indicated for 5 days with antibodies added on day 0 or day 2 and fold change in cell culture confluency was calculated in relation to the isotype control as measured by percentage confluence using Incucyte live cell imaging. n = 4 biologically independent blood monocyte donors examined over 2 independent experiments. Two-way-ANOVA with Dunnett’s multiple comparisons test, *P < 0.05, ****P < 0.0001, mean ± SEM. B Representative images of monocyte-derived LCs. data shown representative of 2 independent experiments. C K562-CD1a (CD1a) or K562-Empty vector (EV) were incubated with anti-CD1a antibodies for 24 h and stained for Annexin V and analyzed by flow cytometry. n = 4 independent cultures of K562 cells, examined over 2 independent experiments. D Flow cytometric analysis of complement-dependent cytotoxicity (CDC). K562-CD1a cells were incubated with 10% normal human serum for 3 h at 37 °C in the presence of either 5 µg/ml isotype control antibody or indicated antibodies. Percentage cytotoxicity was calculated in relation to a reference population of untreated K562 and was normalized to isotype control-treated cells. n = 6 biologically independent human serum donors examined over 2 independent experiments. E Flow cytometric analysis of antibody-dependent cell-mediated cytotoxicity (ADCC). K562-CD1a cells were co-cultured with PBMC at 1:50 ratio for 5 h at 37 °C in the presence of either 5 µg/ml isotype control antibody or indicated antibodies. Percentage cytotoxicity was calculated in relation to a reference population of untreated K562 and was normalized to isotype control-treated cells. n = 6 biologically independent PBMC donors examined over 2 independent experiments. CE One-way-ANOVA with Tukey’s test, *P < 0.05; **P < 0.01; ***P < 0.001; ****P < 0.0001 where aterisk (*) indicates significance on comparison to “CD1a”, mean ± SEM). Exact p-values are recorded in Supplementary Table 4. Source Data are provided as a Source Data file.
Fig. 6
Fig. 6. Application of anti-CD1a antibodies in the treatment of imiquimod-induced inflammation.
A Schematic of imiquimod-induced inflammation with therapeutic anti-CD1a administration. B Daily measurement of ear swelling. n = 4 (WT), n = 6 (CD1a), n = 8 (16), n = 8 (110), n = 10 (116), n = 2 (WT unchallenged), n = 6 (CD1a unchallenged), examined over 3 independent experiments. Two-way-ANOVA with Dunnett’s test, ***P < 0.001; ****P < 0.0001 indicates significance at day 6 on comparison to “CD1a”. C Representative images of inflammation (day 8) induced by imiquimod treatment of wild-type (WT) and CD1a transgenic mice (CD1a Tg) followed by the treatment i.p. with mouse IgG1 isotype control or CD1a transgenic injected with the refined panel of anti-CD1a antibodies as in the schematic panel A (at day 3 arrowpoint). D Whole ear (upper panels) and epidermal (lower panels) thickness and CD1a protein expression within ear skin of wild-type (WT) and CD1a transgenic (CD1a) mice treated with imiquimod (Imiq) or untreated (U) visualized by immunofluorescence. Cryosections were stained with DAPI (blue) and anti-CD1a AF-594 (OKT6, red), scale bars 10 µm upper panels and 100 µm lower panels. Data shown representative of 2 independent experiments. EG Flow cytometric analysis of ear skin of mouse IgG1 isotype treated wild-type (WT) and CD1a transgenic (CD1a) and CD1a transgenic injected with the refined panel of anti-CD1a antibodies following the treatment model of administration. Skin T cells were enumerated (/ear) and assessed for cell surface CD11a expression (E) and neutrophil (F) and eosinophil (G) enumerated (/ear). EG n = 7 (WT), n = 8 (CD1a), n = 9 (16, 110, 116), examined over 3 independent experiments. One-way-ANOVA with Dunnett’s test, *P < 0.05; **P < 0.01; ***P < 0.001; ****P < 0.0001. H Skin cytokine levels of mouse IgG1 isotype treated wild-type (WT) and CD1a transgenic (CD1a); and CD1a transgenic injected with anti-CD1a antibodies following the treatment model of administration as measured by cytometric bead array. n = 5 (WT, CD1a, 16), n = 4 (110), n = 6 (116), examined over 3 independent experiments. One-way-ANOVA with Dunnett’s test, *P < 0.05; **P < 0.01; ***P < 0.001; ****P < 0.0001. Mean ± SD is shown. n represents biologically independent animals in each group. Exact p-values are recorded in Supplementary Table 5. Source Data are provided as a Source Data file.
Fig. 7
Fig. 7. Investigation of the CD1a dependency of the systemic effects of imiquimod application.
A Spleen weight (mg) measurements on day 8 by imiquimod treatment of wild-type (WT) and CD1a transgenic mice (CD1a) followed by treatment i.p. with mouse IgG1 isotype control or CD1a transgenic injected with the refined panel of anti-CD1a antibodies as in the schematic (Fig. 6A). BE Flow cytometric analysis of spleen of mouse IgG1 isotype treated wild-type (WT) and CD1a transgenic (CD1a); and CD1a transgenic injected with the refined panel of anti-CD1a antibodies following the treatment model of administration. Splenic CD4 (B) and CD8 (C) T-cell CD69 expression was assessed and neutrophils (D) and eosinophils (E) were enumerated. FH Blood cellular analysis of the blood of mouse IgG1 isotype treated wild-type (WT) and CD1a transgenic (CD1a); and CD1a transgenic injected with the refined panel of anti-CD1a antibodies following the treatment model of administration. Circulating T cells (F), neutrophils (G) and eosinophils (H) were enumerated. I Plasma cytokine levels of the blood of mouse IgG1 isotype treated wild-type (WT) and CD1a transgenic (CD1a); and CD1a transgenic injected with anti-CD1a antibodies following the treatment model of administration as measured by cytometric bead array. Mean ± SD is shown. n represents biologically independent animals in each group. One-way-ANOVA with Dunnett’s test, *P < 0.05; **P < 0.01; ***P < 0.001; ****P < 0.0001, examined over 3 (AH I. IL-9, IL-5, IL-22) or 4 (I IFNγ, IL-1β, MCP-1, IL-17a, IL-23) independent experiments. Exact p-values and group sizes are recorded in Supplementary Table 6. Source Data are provided as a Source Data file.
Fig. 8
Fig. 8. Analysis of the contribution of CD1a to MC903-induced inflammation.
A Schematic of MC903-induced inflammation with therapeutic anti-CD1a administration. B Daily measurement of ear swelling. n = 5 for all groups, two-way-ANOVA with Dunnett’s test, **P < 0.01; ****P < 0.0001 indicates significance on comparison to “CD1a” at day 7, examined over 2 independent experiments. C Representative images of inflammation (day 7), induced by MC903 treatment of wild-type (WT) and CD1a transgenic mice (CD1a) and countered by the treatment i.p. with mouse IgG1 isotype control or CD1a transgenic injected with the refined panel of anti-CD1a antibodies as in the schematic panel. D Flow cytometric analysis of ear skin of mouse IgG1 isotype treated wild-type (WT) and CD1a transgenic (CD1a) and CD1a transgenic injected with the refined panel of anti-CD1a antibodies. Skin T cells, neutrophils, eosinophils and LCs were enumerated (/ear). E Skin cytokine levels of mouse IgG1 isotype treated wild-type (WT) and CD1a transgenic (CD1a); and CD1a transgenic injected with anti-CD1a antibodies following the treatment model of administration. F Flow cytometric analysis of the blood of mouse IgG1 isotype treated wild-type (WT) and CD1a transgenic (CD1a) and CD1a transgenic injected with the refined panel of anti-CD1a antibodies. Skin T cells were enumerated and assessed for activation marker expression and blood neutrophil and, eosinophils were enumerated. G Plasma cytokine levels of mouse IgG1 isotype treated wild-type (WT) and CD1a transgenic (CD1a); and CD1a transgenic injected with anti-CD1a antibodies following the treatment model of administration as measured by cytometric bead array. DG n = 7 (WT), n = 6 (CD1a, 16, 116), n = 5 (110), examined over 2 independent experiments. One-way-ANOVA with Dunnett’s test, *P < 0.05; **P < 0.01; ***P < 0.001; ****P < 0.0001. Mean ± SD is shown. n represents biologically independent animals in each group. Exact p-values are recorded in Supplementary Table 7. Source Data are provided as a Source Data file.

References

    1. Palmer CN, et al. Common loss-of-function variants of the epidermal barrier protein filaggrin are a major predisposing factor for atopic dermatitis. Nat. Genet. 2006;38:441–446. doi: 10.1038/ng1767. - DOI - PubMed
    1. Beck LA, et al. Dupilumab treatment in adults with moderate-to-severe atopic dermatitis. N. Engl. J. Med. 2014;371:130–139. doi: 10.1056/NEJMoa1314768. - DOI - PubMed
    1. Leyva-Castillo JM, et al. Mechanical skin injury promotes food anaphylaxis by driving intestinal mast cell expansion. Immunity. 2019;50:1262–1275 e1264. doi: 10.1016/j.immuni.2019.03.023. - DOI - PMC - PubMed
    1. van Splunter, M. et al. Mechanisms underlying the skin-gut cross talk in the development of IgE-mediated food allergy. Nutrients10.3390/nu12123830 (2020). - PMC - PubMed
    1. Brunner PM, et al. The atopic dermatitis blood signature is characterized by increases in inflammatory and cardiovascular risk proteins. Sci. Rep. 2017;7:8707. doi: 10.1038/s41598-017-09207-z. - DOI - PMC - PubMed

Publication types