. 2022 Dec 7;12(1):21189.
doi: 10.1038/s41598-022-25543-1.

Age-associated B cells are long-lasting effectors that impede latent γHV68 reactivation

Affiliations

Age-associated B cells are long-lasting effectors that impede latent γHV68 reactivation

Isobel C Mouat et al. Sci Rep. .

Abstract

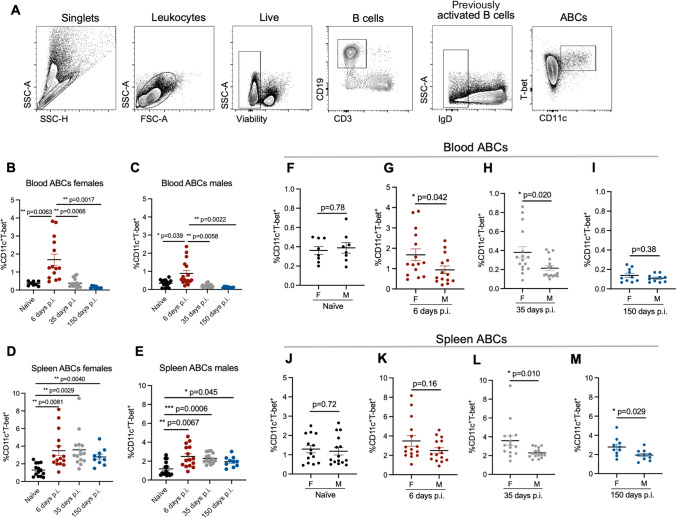
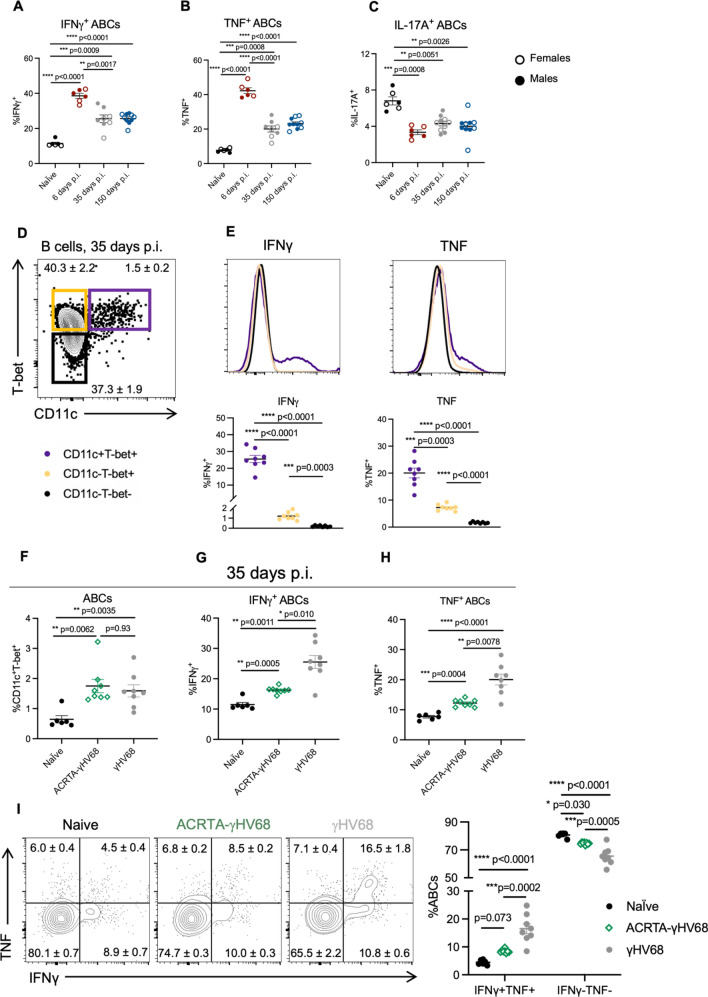
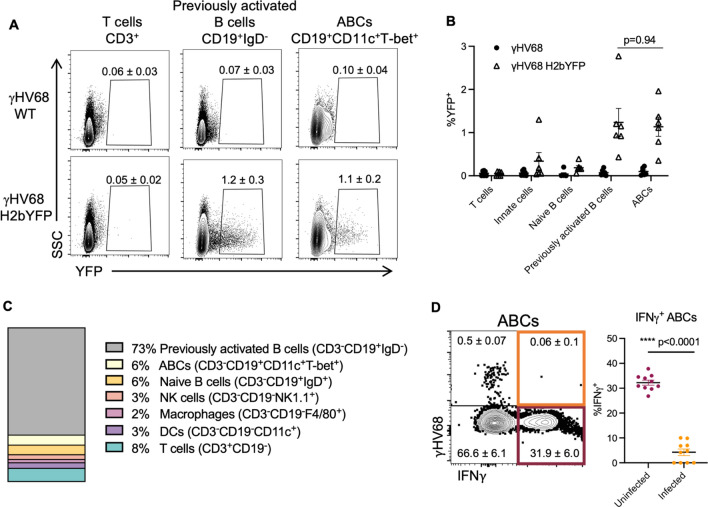
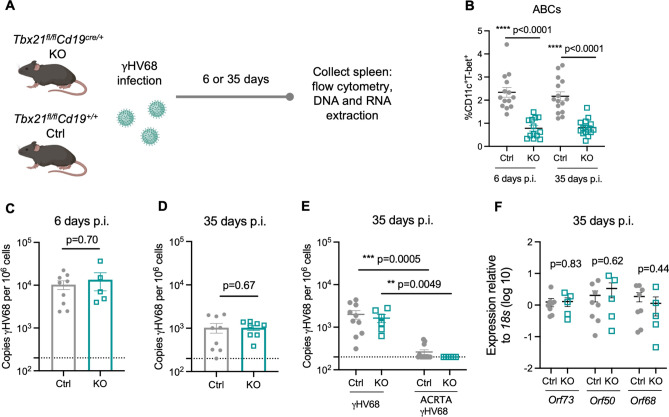
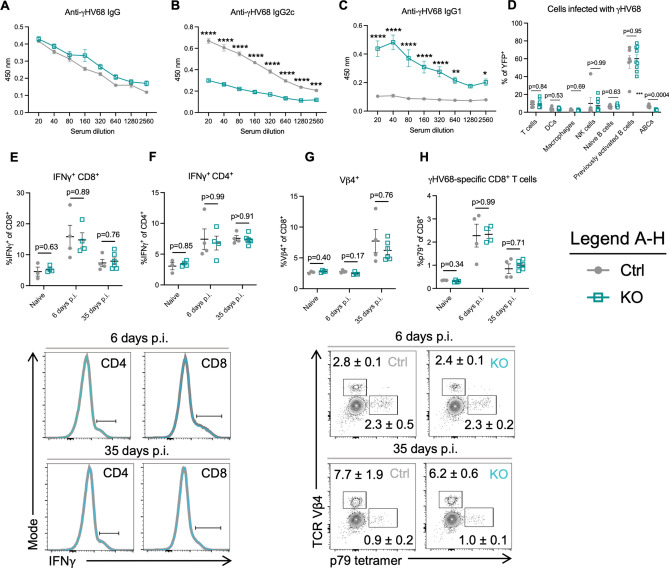
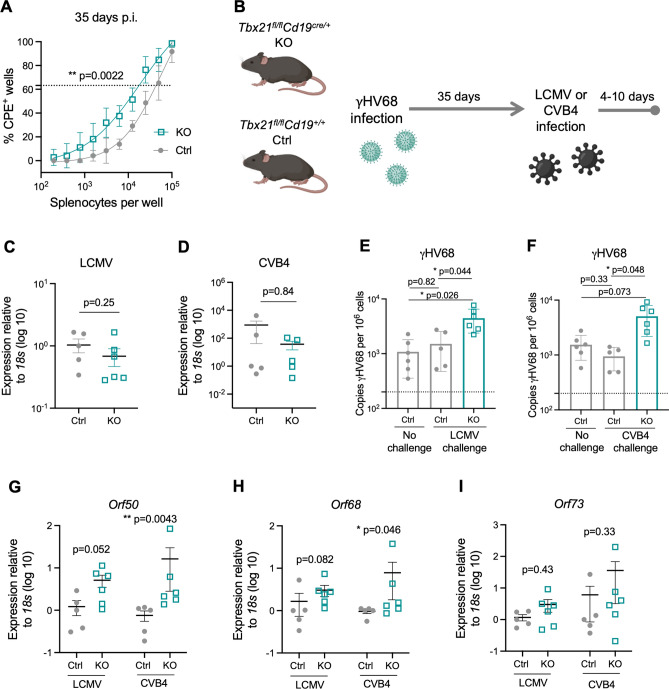
Age-associated B cells (ABCs; CD19+CD11c+T-bet+) are a unique population that are increased in an array of viral infections, though their role during latent infection is largely unexplored. Here, we use murine gammaherpesvirus 68 (γHV68) to demonstrate that ABCs remain elevated long-term during latent infection and express IFNγ and TNF. Using a recombinant γHV68 that is cleared following acute infection, we show that ABCs persist in the absence of latent virus, though their expression of IFNγ and TNF is decreased. With a fluorescent reporter gene-expressing γHV68 we demonstrate that ABCs are infected with γHV68 at similar rates to other previously activated B cells. We find that mice without ABCs display defects in anti-viral IgG2a/c antibodies and are more susceptible to reactivation of γHV68 following virus challenges that typically do not break latency. Together, these results indicate that ABCs are a persistent effector subset during latent viral infection that impedes γHV68 reactivation.


Conflict of interest statement

The authors declare no competing interests.

Figures

Figure 1
Figure 1
ABCs expand in the blood and spleen throughout γHV68 infection. Blood and spleen collected from C57BL/6(J) mice (6–8-week-old at infection) mock-infected with media (naïve, black circles) or infected i.p. with γHV68 for 6 (red circles), 35 (grey circles), or 150 (blue circles) days and processed for flow cytometry. (A) Representative gating strategy of ABCs. IgD, CD11c, and T-bet gating used fluorescence-minus-one (FMO) controls. (B–E) Proportion of ABCs (CD11c+T-bet+) of previously activated B cells (CD19+IgD) in the blood and spleen of male and female mice. (F–I) Proportion of ABCs (CD11c+T-bet+) of previously activated B cells (CD19+IgD) in the blood or spleen of male and female mice. Same data as presented in panels (B–E). n = 10–15 mice per group, data compiled from 4 experiments. Each data point represents an individual mouse. Data presented as mean ± SEM. Analyzed by (B–E) one-way ANOVA or (F–M) Mann–Whitney test. p-values indicated as asterixis as follows: ***p < 0.001, **p < 0.01, *p < 0.05.
Figure 2
Figure 2
Cytokine production by ABCs in the spleen during γHV68 and ACRTA-γHV68 infection. (A–C) C57BL/6(J) mice (6–8-week-old at infection) mock-infected with media (naïve) or infected i.p. with γHV68 for 6, 35, or 150 days. Spleens collected and processed for flow cytometry. Proportion of ABCs in the spleen expressing (A) IFNγ, (B) TNF, or (C) IL-17A, with females presented as open circles and males as filled circles. (D) Gating of ABCs (CD11c+T-bet+) and non-ABC B cells (CD11cT-bet+ and CD11cT-bet), previously gated on CD19+IgD cells in the spleen. (E) Representative histograms and dot plots of the proportion of ABCs and non-ABC B cells (CD11cT-bet+ and CD11cT-bet) expressing IFNγ and TNF from mice infected with γHV68 for 35 days. (F–H) C57BL/6(J) mice mock-infected with media (Naïve, black circles) or infected i.p. with γHV68 (grey circles) or ACRTA-γHV68 (green diamonds) for 35 days and spleens processed for flow cytometry. (F) Proportion of ABCs (CD11c+T-bet+) of previously activated B cells (CD19+IgD) in the spleen. Proportion of ABCs (CD19+CD11c+T-bet+) in the spleen expressing (G) IFNγ or (H) TNF. (I) Representative plots and quantification of the proportion of ABCs expressing IFNγ and TNF. Equivalent numbers of females and males per group in all panels. (A–C) n = 6–10 mice per group, data combined from two experiments. (E–I) n = 6–8 mice per group, representative of two experiments. Each data point represents an individual mouse. Data presented as mean ± SEM. Analyzed by one-way ANOVA. p-values indicated as asterisks as follows: ****p < 0.0001, ***p < 0.001, **p < 0.01, *p < 0.05.
Figure 3
Figure 3
Analysis of ABC infection status with fluorescent γHV68 strain. Female C57BL/6(J) mice (6 to 8-week-old at infection) infected i.p. with γHV68 or γHV68.H2bYFP. 8 days p.i. spleen collected and processed for flow cytometry. (A) Representative flow cytometry plots displaying yellow fluorescent protein (YFP) expression (x-axis) versus side-scatter (SSC, y-axis) from mice infected with γHV68 or γHV68.H2bYFP with mean ± SEM. Samples gated on live, single lymphocytes, and then T cells (CD3+), total B cells (CD19+), previously activated B cells (CD19+IgD), or ABCs (CD19+CD11c+T-bet+). Two samples per group concatenated for the purpose of visualization. Representative of two experiments. (B) Proportion of cell subsets positive for YFP expression from γHV68-infected mice (filled circles) and γHV68.H2bYFP-infected mice (open triangles). Each data point represents an individual mouse. (C) Proportion of YFP+ cells that are non-B cells (CD19, white), non-ABC B cells (CD19+CD11cT-bet, grey), or ABCs (CD19+CD11c+T-bet+, black). Data n = 6 mice per group, data compiled from two experiments, representative of three experiments. (D) Representative flow plot of ABCs (CD19+CD11c+T-bet+) in the spleen gated for YFP (γHV68.H2bYFP) and IFNγ with mean ± SEM. Dot plot displays the proportion of either uninfected (YFP) or infected (YFP+) ABCs in the spleen that are positive for IFNγ. (B,D) Data presented as mean ± SEM, analyzed by Mann–Whitney test. Each data point represents an individual mouse. p-values indicated as asterisks as follows: ****p < 0.0001.
Figure 4
Figure 4
ABCs are not required for controlling lytic infection and achieving long-term latency. Tbx21fl/flCd19+/+ (Ctrl, filled grey circles) and Tbx21fl/flCd19cre/+ (KO, open blue squares) mice were infected i.p. with γHV68 or ACRTA-γHV68. 6 or 35 days p.i., spleens collected and processed for RNA extraction, DNA extraction, and flow cytometry. (A) Experimental scheme for data shown in panels (B–D,F). (B) Proportion of ABCs (CD11c+T-bet+) of previously activated B cells (CD19+IgD) in the spleen in Ctrl and KO mice 6 and 35 days post-γHV68 infection. (C,D) Splenic γHV68 viral load (copies Orf50 per million cells) in Ctrl (filled circles) and KO (open squares) mice as determined by qPCR day 6 and 35 p.i., with limit of detection indicated by dotted line. (E) Splenic γHV68 viral load (copies Orf50 per million cells) in Ctrl and KO mice infected with γHV68 or ACRTA-γHV68 35 days p.i. (F) Relative expression in the spleen of Orf73, Orf50, and Orf68 in Ctrl and KO mice at day 35 p.i. Each data point represents an individual mouse. Both male and female mice were included in the experiments. Data presented as mean ± SEM, analyzed by Mann–Whitney test (B–D,F) or Kruskal–Wallis H test (E).
Figure 5
Figure 5
Mice without ABCs display a dysregulated anti-γHV68 antibody response, though no alterations to the cell populations infected with γHV68 or γHV68-responding T cells, compared to mice with ABCs. (A–C) Tbx21fl/flCd19+/+ (Ctrl, filled grey circles) and Tbx21fl/flCd19cre/+ (KO, open blue squares) mice were infected i.p. with γHV68 for 35 days. N = 5 per group, representative of 2 experiments. (D) Ctrl and KO mice were infected i.p. with γHV68.H2bYFP for 8 days, and various immune cell populations in the spleen analyzed for YFP expression. N = 6–8 per group, data compiled from 2 experiments. (E–H) Ctrl and KO mice were infected i.p. with γHV68 for 6 or 35 days, at which point spleens were collected for flow cytometry. Representative of 2 experiments. Flow cytometry plots are representative samples previously gated on live (E,F) CD45+CD3+ or (G,H) CD45+CD3+CD8+ splenocytes, with mean ± SEM. Each data point represents an individual mouse. Both male and female mice included in experiments. Data presented as mean ± SEM. Analyzed by two-way ANOVA (A–C) or Mann–Whitney test (D–H). p-values indicated as asterisks as follows: ****p < 0.0001, ***p < 0.001, **p < 0.01, *p < 0.05.
Figure 6
Figure 6
ABC knockout mice are more susceptible to reactivation. (A) Tbx21fl/flCd19+/+ (Ctrl, filled grey circles) and Tbx21fl/flCd19cre/+ (KO, open blue squares) mice were infected i.p. with γHV68. 35 days p.i., spleens were collected and processed for reactivation assay. N = 6 mice per group, data compiled from two independent experiments. (B) Experimental scheme for data shown in panels (C–I). Ctrl and KO mice were infected i.p. with γHV68 for 35 days and then challenged with either LCMV (Armstrong) or CVB4 for 10 to 4 days, respectively. (C–I) Spleens collected, processed, and DNA and RNA was extracted from total splenocytes following RBC lysis. (C,D) Relative expression of LCMV (C) and CVB4 (D) between Ctrl and KO mice measured by RT-qPCR. (E,F) Copies of γHV68 detected by qPCR in the spleen per million cells following challenge with LCMV or CVB4. (G–I) Relative expression in the spleen of Orf73, Orf50, and Orf68 in Ctrl and KO mice. Each data point represents an individual mouse. Both male and female mice included in experiments. Data presented as mean ± SEM, analyzed by Mann–Whitney test (A,C,D,G–I) or one-way ANOVA (E,F). p-values indicated as asterixis as follows: **p < 0.01, *p < 0.05.

Similar articles

Cited by

References

    1. Dong S, Forrest JC, Liang X. Murine gammaherpesvirus 68: A small animal model for gammaherpesvirus-associated diseases. In: Cai Q, Yuan Z, Lan K, editors. Infectious Agents Associated Cancers: Epidemiology and Molecular Biology. Springer; 2017. pp. 225–236. - PubMed
    1. Barton E, Mandal P, Speck SH. Pathogenesis and host control of gammaherpesviruses: Lessons from the mouse. Annu. Rev. Immunol. 2011;29:351–397. doi: 10.1146/annurev-immunol-072710-081639. - DOI - PubMed
    1. Hao Y, O’Neill P, Naradikian MS, Scholz JL, Cancro MP. A B-cell subset uniquely responsive to innate stimuli accumulates in aged mice. Blood. 2011;118(5):1294–1304. doi: 10.1182/blood-2011-01-330530. - DOI - PMC - PubMed
    1. Rubtsov AV, Rubtsova K, Fischer A, et al. Toll-like receptor 7 (TLR7)-driven accumulation of a novel CD11c+ B-cell population is important for the development of autoimmunity. Blood. 2011;118(5):1305–1315. doi: 10.1182/blood-2011-01-331462. - DOI - PMC - PubMed
    1. Cancro MP. Age-associated B cells. Cells Annu. Rev. Immunol. 2020;38(1):315–340. doi: 10.1146/annurev-immunol-092419-031130. - DOI - PubMed

Publication types