. 2022 Dec 7;17(12):e0271145.
doi: 10.1371/journal.pone.0271145. eCollection 2022.

Characterization of a KDM5 small molecule inhibitor with antiviral activity against hepatitis B virus

Affiliations

Characterization of a KDM5 small molecule inhibitor with antiviral activity against hepatitis B virus

Sarah A Gilmore et al. PLoS One. .

Abstract

Chronic hepatitis B (CHB) is a global health care challenge and a major cause of liver disease. To find new therapeutic avenues with a potential to functionally cure chronic Hepatitis B virus (HBV) infection, we performed a focused screen of epigenetic modifiers to identify potential inhibitors of replication or gene expression. From this work we identified isonicotinic acid inhibitors of the histone lysine demethylase 5 (KDM5) with potent anti-HBV activity. To enhance the cellular permeability and liver accumulation of the most potent KDM5 inhibitor identified (GS-080) an ester prodrug was developed (GS-5801) that resulted in improved bioavailability and liver exposure as well as an increased H3K4me3:H3 ratio on chromatin. GS-5801 treatment of HBV-infected primary human hepatocytes reduced the levels of HBV RNA, DNA and antigen. Evaluation of GS-5801 antiviral activity in a humanized mouse model of HBV infection, however, did not result in antiviral efficacy, despite achieving pharmacodynamic levels of H3K4me3:H3 predicted to be efficacious from the in vitro model. Here we discuss potential reasons for the disconnect between in vitro and in vivo efficacy, which highlight the translational difficulties of epigenetic targets for viral diseases.


Conflict of interest statement

The authors have declared that no competing interests exist.

Figures
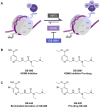
Fig 1
Fig 1. GS-5801 is a prodrug of KDM5 inhibitor GS-080.
(A) KDM5 demethylates the lysine 4 of the histone 3 (H3K4) subunit of nucleosomes. Inhibition of KDM5 activity by compounds such as GS-5801 results in accumulation of methylated H3K4 on chromatin through the activity of cellular histone methyltransferases (HMT) that catalyze the mono-, di-, and tri- methylation of H3K4. Chemical structures of prodrug GS-5801 and parent GS-080 (B) as well as prodrug GS-420 and parent GS-444 (C) are shown.
Fig 2
Fig 2. Knockdown of KDM5 confers antiviral activity in PHH.
KDM4 and KDM5 transcripts were depleted by siRNA either individually (KDM4A, B, C, D, or E; KDM5A, B, C, or D) or simultaneously (KDM4AE pool; KDM5AD pool) in HBV-infected PHH. DDB1, the well-characterized HBV host restriction factor, was also depleted by siRNA for comparison. Fourteen days after initiation of siRNA transfection, levels of (A) intracellular HBV RNA, (B) secreted HBeAg, and (C) secreted HBsAg were measured by qRT-PCR or immunoassay, respectively, for each siRNA condition. (D) The kinetics of HBeAg inhibition is shown for KDM4AE pool, KDM5AD pool, and DDB1 siRNA conditions. Data shown are the average of two biological replicate experiments and error bars represent the standard deviation.
Fig 3
Fig 3. Antiviral activity of GS-5801 exhibits delayed kinetics.
PHH from three donors (BCD, VUZ, and 8181) were infected with HBV for three days prior to initiation of GS-5801 treatment. PHH were dosed with vehicle or 10 μM GS-5801 every three to four days for a total of 30–32 days. At the timepoints shown, levels of secreted (A) HBeAg and (B) HBsAg were measured by immunoassay. Data are plotted as the percentage inhibition of HBeAg or HBsAg in GS-5801 treated PHH relative to vehicle treated PHH.
Fig 4
Fig 4. A single dose of GS-5801 confers sustained HBV antiviral activity in PHH.
(A) PHH from three donors (BCD, 7272, and 8181) were infected with HBV for three days prior to initiation of GS-5801 treatment. PHH were treated once for two hours with vehicle or 10 μM GS-5801. Compound was removed by replacing the medium with fresh medium without drug or vehicle. At the timepoints shown, levels of secreted HBeAg and HBsAg were measured by immunoassay for 12 days. Data are shown as the percentage inhibition of HBeAg or HBsAg in GS-5801 treated PHH relative to vehicle treated PHH. (B) PHH from donor BCD were infected with HBV for three days prior to initiation of GS-5801 treatment. PHH were treated once for two hours with vehicle or 10 μM GS-5801. Compound was removed by replacing the medium with fresh medium without drug or vehicle. At the timepoints shown, levels of secreted HBeAg and HBsAg were measured by immunoassay for 24 days. Data are shown as the average percentage.
Fig 5
Fig 5. GS-5801 causes global increases in H3K4me3:H3 that precede antiviral activity.
PHH were infected with HBV for three days prior to initiation of GS-5801 treatment. (A) PHH were treated with vehicle or 10 μM GS-5801 every three to four days for a total of 14 days (continuous dosing). Data shown are from donor 8130 and are representative of data from continuous dosing experiments. (B) PHH were treated with vehicle or 10 μM GS-5801 once for two hours with vehicle or 10 μM GS-5801 prior to replacing medium with fresh medium without drug or vehicle (pulse dosing). Note that the half-life of active parent of GS-5801 in hepatocytes is 42–66 hrs leading to sustained exposure during the 3 day periods. Data shown are the average values from three PHH donors (BCD, 8181, 7272) and error bars represent the standard deviation. (A, B) At the timepoints shown, levels of secreted HBeAg were measured by immunoassay and are plotted as the percentage inhibition of HBeAg in GS-5801 treated PHH relative to vehicle treated PHH. In addition, levels of H3K4me3 relative to H3 (H3K4me3:H3) were measured by ELISA in vehicle and GS-5801 treated PHH and are plotted as the ratio of H3K4me3:H3 measured in GS-5801 treated PHH relative to vehicle treated PHH. (C) The relationship of H3K4me3:H3 ratio increases to HBeAg inhibition in PHH (donors BCD, 8181, 7272) treated with a single two hour pulse dose of 0.1, 1, 3, or 10 μM GS-5801 relative to vehicle-treated PHH are shown. The H3K4me3:H3 ratio of GS-5801 treated cells was normalized to vehicle treated cells at day three after a two hour pulse dose. The percentage inhibition of HBeAg was measured at the end of the experiment (day 12 or 14 post-initiation of dosing) and plotted as the inhibition of HBeAg in GS-5801 treated PHH relative to vehicle treated PHH. (D) Uninfected PHH cells treated with vehicle or 10 μM GS-5801 every 3 days. On Day 7 (24 hours after last GS-5801 dose) histones were purified and levels of H3K4 (unmodified), H3K4me1 (methylated), H3K4me2 (di-methylated), and H3K4me3 (trimethylated) TKQTAK peptides were measured by mass spectrometry. Data shown are the average ratios of unmodified, methyl, dimethyl, and trimethyl H3K4 peptide TKQTAR (log2 (GS-5801 treated/vehicle)) measured from three biological replicates. Error bars represent standard deviation.
Fig 6
Fig 6. GS-5801 influences host and viral gene transcription.
PHH from three donors (8130, 8181, and 4239) were infected with HBV for three days prior to initiation of GS-5801 treatment. PHH were treated continuously with vehicle, 0.03, 0.3, or 10 μM GS-5801 every three to four days for a total of 13 days. PHH were harvested at 1, 3, 10, and 13 days after initiation of GS-5801 dosing and mRNA was quantified by RNA-seq. (A) The number of sequencing reads mapping to the HBV genome were quantified in all samples (counts per million; cpm) and data are plotted as the percentage inhibition of HBV RNA (vRNA) in GS-5801 treated samples relative to vehicle treated samples at each timepoint. (B) The number of genes differentially up or downregulated (differential by 4-fold log2; FDR < 0.05) in GS-5801 treated PHH compared to vehicle treated PHH are shown for each timepoint. (C) Shown is a Venn diagram demonstrating the overlap of the identity of genes differentially upregulated (fold change ≥ 4-fold log2; FDR < 0.05) in PHH treated with 10 μM GS-5801 compared to vehicle treated PHH for Day 3 (n = 414 genes), Day 10 (n = 1131 genes), and Day13 (n = 1268 genes) after initiation of GS-5801 dosing. (D) Hallmark Gene Set. Data are displayed as the difference in average gene set score based on GSVA between each dose respective vehicle control, with upregulated gene sets in red and downregulated gene sets in blue. For comparison, downregulation of HBV mRNA for same dose and time regiment is shown at the top.
Fig 7
Fig 7. GS-5801 increases H3K4me3:H3 levels preferentially in liver tissue.
Sprague Dawley rats (A) and cynomolgus monkeys (B) were dosed once with 1 mg/kg or 2.5 mg/kg GS-5801 p.o., respectively. Amounts of pro-drug (GS-5801) and active parent (GS-080) were measured by LC-MS in liver tissue and plasma at the timepoints shown. (C) Cynomolgus monkeys were dosed p.o. once daily for seven days with 0.03, 0.1, 0.3, 1, 3, or 10 mg/kg of GS-5801. Twenty four hours after the last dose, amounts of H3K4me3 and H3 were measured by ELISA in liver, kidney, PBMCs, and lung. Data are displayed as the average H3K4me3:H3 ratio of GS-5801 treated monkeys relative to vehicle treated monkeys from n = 2–3 animals; error bars represent the standard deviation. (D) Sprague Dawley rats were dosed p.o. once daily for five days with 0.3, 1, 3, 10, or 30 mg/kg of GS-5801. Twentyfour hours after the last dose, amounts of H3K4me3 and H3 were measured by ELISA in liver, kidney, PBMCs, and lung. Data are displayed as the average H3K4me3:H3 ratio of GS-5801 treated rats relative to vehicle treated rats from n = 3 animals; error bars represent the standard deviation. (E–F) Wistar Han rats were dosed p.o. once daily for seven days with 10, 30, or 100 mg/kg of GS-5801 and a subset of rats from each dose group continued into a seven day off-treatment phase. (E) Twentyfour hours after the last dose or recovery day, amounts of H3K4me3 and H3 were measured by ELISA in the liver. Data are displayed as the average H3K4me3:H3 ratio of GS-5801-treated rats relative to vehicle treated rats from n = 3 animals during the dosing or recovery phases; error bars represent the standard deviation. (F) Transcript levels in rat liver tissue were quantified by RNA-seq (cpm). The number of genes differentially up or downregulated (differential by 2-fold log2; FDR < 0.05) in GS-5801-dosed rats compared to vehicle-treated rats are shown during the dosing phase (24 hours after once daily dosing for seven days) and recovery phase (24 hours after seven days off drug; F).
Fig 8
Fig 8. GS-5801 does not reduce HBV DNA or HBsAg levels in a humanized mouse model of HBV infection.
uPA-SCID mice with humanized livers were infected with HBV GTC virus and dosed p.o. with 30 or 100 mg/kg of GS-5801once daily for seven days in a one week on one week off dosing regimen. Every seven days, levels of HBV DNA (A) and HBsAg (B) were measured. Data is plotted as the average of n = 6–8 mice/timepoint/dose group, error bars represent the standard deviation. Shaded grey areas indicate the dosing periods. (C) At study endpoint, Day 56, levels of H3K4me3 and H3 were measured in liver tissue via ELISA to assess GS-5801 pharmacodynamics. Data is shown as the average fold change in H3K4me3:H3 ratio in mice (n = 6–8 per dose group) treated with 30 mg/kg or 100 mg/kg of GS-5801 and normalized to vehicle-treated animals; error bars represent the standard deviation. (D) The antiviral activity of GS-5801 was assessed in vitro with the same hepatocytes and GTC virus used in the in vivo HBV efficacy model. Hepatocytes were plated and infected with HBV prior to GS-5801 compound treatment. At Day 21, antiviral activity was assessed by measuring extracellular levels of HBsAg and HBeAg. Data is plotted as the average of biological duplicate samples; error bars represent the standard deviation.

References

    1. Lozano R, Naghavi M, Foreman K, Lim S, Shibuya K, Aboyans V, et al.. Global and regional mortality from 235 causes of death for 20 age groups in 1990 and 2010: a systematic analysis for the Global Burden of Disease Study 2010. Lancet. 2012;380(9859):2095–128. Epub 2012/12/19. doi: 10.1016/S0140-6736(12)61728-0 . - DOI - PMC - PubMed
    1. Schweitzer A, Horn J, Mikolajczyk RT, Krause G, Ott JJ. Estimations of worldwide prevalence of chronic hepatitis B virus infection: a systematic review of data published between 1965 and 2013. Lancet. 2015;386:1546–55. Epub 2015/08/02. doi: 10.1016/S0140-6736(15)61412-X . - DOI - PubMed
    1. World Health Organization. Hepatitis B Fact Sheet2018. \. https://www.who.int/en/news-room/fact-sheets/detail/hepatitis-b.
    1. Kwon H, Lok AS. Hepatitis B therapy. Nat Rev Gastroenterol Hepatol. 2011;8(5):275–84. Epub 2011/03/23. doi: 10.1038/nrgastro.2011.33 . - DOI - PubMed
    1. Newbold JE, Xin H, Tencza M, Sherman G, Dean J, Bowden S, et al.. The covalently closed duplex form of the hepadnavirus genome exists in situ as a heterogeneous population of viral minichromosomes. J Virol. 1995;69(6):3350–7. doi: 10.1128/JVI.69.6.3350-3357.1995 . - DOI - PMC - PubMed

Substances