. 2023 May 9;7(9):1635-1649.
doi: 10.1182/bloodadvances.2022008863.

Shared graft-versus-leukemia minor histocompatibility antigens in DISCOVeRY-BMT

Affiliations

Shared graft-versus-leukemia minor histocompatibility antigens in DISCOVeRY-BMT

Kelly S Olsen et al. Blood Adv. .

Abstract

T-cell responses to minor histocompatibility antigens (mHAs) mediate graft-versus-leukemia (GVL) effects and graft-versus-host disease (GVHD) in allogeneic hematopoietic cell transplantation. Therapies that boost T-cell responses improve allogeneic hematopoietic cell transplant (alloHCT) efficacy but are limited by concurrent increases in the incidence and severity of GVHD. mHAs with expression restricted to hematopoietic tissue (GVL mHAs) are attractive targets for driving GVL without causing GVHD. Prior work to identify mHAs has focused on a small set of mHAs or population-level single-nucleotide polymorphism-association studies. We report the discovery of a large set of novel GVL mHAs based on predicted immunogenicity, tissue expression, and degree of sharing among donor-recipient pairs (DRPs) in the DISCOVeRY-BMT data set of 3231 alloHCT DRPs. The total number of predicted mHAs varied by HLA allele, and the total number and number of each class of mHA significantly differed by recipient genomic ancestry group. From the pool of predicted mHAs, we identified the smallest sets of GVL mHAs needed to cover 100% of DRPs with a given HLA allele. We used mass spectrometry to search for high-population frequency mHAs for 3 common HLA alleles. We validated 24 predicted novel GVL mHAs that are found cumulatively within 98.8%, 60.7%, and 78.9% of DRPs within DISCOVeRY-BMT that express HLA-A∗02:01, HLA-B∗35:01, and HLA-C∗07:02, respectively. We confirmed the immunogenicity of an example novel mHA via T-cell coculture with peptide-pulsed dendritic cells. This work demonstrates that the identification of shared mHAs is a feasible and promising technique for expanding mHA-targeting immunotherapeutics.


Conflict of interest statement

Conflict-of-interest disclosure: The authors declare no competing financial interests.

Figures

None
Graphical abstract
Figure 1.
Figure 1.
Predicted mHAs by disease type and genomic ancestry. (A) Shows the number of each category of predicted mHA per DRP by disease type. “GVL” denotes expression in leukemia cells, “GVH” denotes expression in GVH target organs, and “both” denotes expression in both. (B) Shows the number of each category of predicted mHA per DRP by genomic ancestry, including patients identifying as European American (EA), African American (AA), or Hispanic (HIS).
Figure 2.
Figure 2.
Number and proportion of predicted mHAs by HLA allele within the study population. mHAs classified as “GVL” broadly represent mHAs that are desirable to target for antileukemia effects with minimal GVHD. mHAs classified as “GVH” represent mHAs that are undesirable to target as they are predicted to correspond to GVHD and have no GVL effects. The “both” category represents peptides that are predicted to lead to both GVL and GVH effects. (A) Shows counts of each predicted class of mHA for HLA-A alleles represented in the patient data set. (B) Shows counts for HLA-B alleles represented in the patient data set. (C) Shows counts for HLA-C alleles represented in the patient data set. (D) Shows the proportion of predicted mHAs corresponding to each mHA class for HLA-A alleles. (E) Shows the proportion for HLA-B alleles. (F) Shows the proportion of HLA-C alleles.
Figure 3.
Figure 3.
Degree of genetic distance versus the number of predicted GVL mHAs by DRP in DISCOVeRY-BMT data set. (A) Shows the number of total SNPs that differ and are predicted to lead to an mHA versus the number of predicted GVL mHAs per patient. (B) Shows the distribution of pairwise distance values for every DRP in the DISCOVeRY-BMT data set. Pairwise genetic distance value is calculated as the mean of (1-.5(number of shared alleles at SNP locus)) for every genotyped SNP locus for a DRP. (C) Shows pairwise genetic distance versus the number of predicted total mHAs per DRP. (D) Shows pairwise genetic distance versus the number of predicted GVL mHAs per DRP.
Figure 4.
Figure 4.
Degree of sharing of predicted mHAs across the study population. (A) Shows the distribution of predicted mHAs by the number of patients in the DISCOVeRY-BMT cohorts that possess them. Most mHAs are shared by ≤10 patients. Inlaid are the same data with y transformed y-axis to highlight the tail of the distribution. Data are colored by quartile of number of patients for each mHA. (B) Shows the distribution of predicted HLA-A∗02:01 mHAs by population frequency in DRPs with HLA-A∗02:01. (C) Shows the distribution of predicted HLA-B∗35:01 mHAs by population frequency in DRPs with HLA-B∗35:01. (D) Shows the distribution of predicted HLA-C∗07:02 mHAs by population frequency in DRPs with HLA-C∗07:02. (E) Shows the percentage of DISCOVeRY-BMT cohort with each HLA allele covered by each predicted GVL mHA that binds that HLA allele, for all HLA alleles representing >0.5% of DISCOVeRY-BMT patients.
Figure 5.
Figure 5.
Patient population cumulative coverage by shared GVL mHAs. (A) Coverage of DISCOVeRY-BMT patients with HLA-A∗02:01 allele with predicted GVL mHAs. Noncumulative independent population frequencies of each of the top 15 peptides within the HLA-A∗02:01 population range from 19.4% to 28.3%, shown as bar heights. The colors of the bars show z-scores of expression for the genes that contain each peptide from The Cancer Genome Atlas AML sample expression data (TCGA_AML). Cumulative population coverage by the 15 predicted GVL mHAs needed to reach 100% corresponding coverage is shown as an overlaid line graph. Dotted lines indicate 7 peptides needed to reach 90% population coverage. (B) Shows coverage of DISCOVeRY-BMT patients with HLA-B∗35:01 allele with predicted GVL mHAs. Eleven predicted GVL mHAs correspond to 100% cumulative population coverage and 6 correspond to 90% coverage for this HLA allele. Noncumulative coverage by the top 11 peptides for this HLA allele range from 20.9% to 29.3%. (C) Shows coverage of DISCOVeRY-BMT patients with HLA-C∗07:02. Fourteen predicted GVL mHAs correspond to 100% cumulative population coverage and 7 correspond to 90% for this allele. Noncumulative coverage for these mHAs ranges from 19.3% to 31.1%.
Figure 6.
Figure 6.
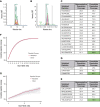
Mass spectrometry validation of predicted GVL mHAs for HLA-A∗02:01, B∗35:01, and C∗07:02. (A) Shows representative spectra for heavy-labeled peptide standard for HLA-C∗07:02–binding mHA LPAAYHHH. (B) Shows endogenous LPAAYHHH peptide identified from immunoprecipitated peptide sample from cell line MONOMAC1. (C) Shows all novel identified peptides from cell line U937A2 sample. “Noncumulative population coverage” shows the percentage of DRPs expressing HLA-A∗02:01 within the DISCOVeRY-BMT data set where the recipient expresses the mHA allele and the donor does not. “Cumulative population coverage” shows the output from the greedy algorithm calculating total population coverage by each peptide and the ones preceding it, with a total of 98.8% population coverage by the 10 peptides. (D) Shows all identified peptides from cell line NB4 sample, with a 60.7% cumulative coverage of DRPs expressing HLA-B∗35:01 within the data set by the 3 peptides. (E) Shows all identified peptides from cell line MONOMAC1, with a 78.9% cumulative coverage of HLA-C∗07:02–expressing DRPs within the data set. (F) Shows cumulative coverage by the 16 novel confirmed HLA-A∗02:01–binding mHAs and 1000 simulated sets of 16 peptides from the set of mHAs searched by mass spectrometry. Cumulative coverage by confirmed peptides is shown in blue, whereas each simulated run is shown as an individual gray line. (G) Shows cumulative coverage for the 3 confirmed HLA-B∗35:01–binding mHAs and 1000 simulated sets of 3 peptides. (H) Shows cumulative coverage for the 5 confirmed HLA-C∗07:02–binding mHAs and 1000 simulated sets of 5 peptides. (I) Shows flow cytometry staining from the mHA immunogenicity experiment. “UV only” shows negative control stained with tetramer exposed to UV light with no peptide. “Flu-M158-66” shows CD8 T cells cocultured with M158-66 pulsed DCs, stained with M158-66 tetramer. “UNC-HEXDC-V” shows CD8 T cells cocultured with novel mHA UNC-HEXDC-V stained with UNC-HEXDC-V tetramer.
Figure 6.
Figure 6.
Mass spectrometry validation of predicted GVL mHAs for HLA-A∗02:01, B∗35:01, and C∗07:02. (A) Shows representative spectra for heavy-labeled peptide standard for HLA-C∗07:02–binding mHA LPAAYHHH. (B) Shows endogenous LPAAYHHH peptide identified from immunoprecipitated peptide sample from cell line MONOMAC1. (C) Shows all novel identified peptides from cell line U937A2 sample. “Noncumulative population coverage” shows the percentage of DRPs expressing HLA-A∗02:01 within the DISCOVeRY-BMT data set where the recipient expresses the mHA allele and the donor does not. “Cumulative population coverage” shows the output from the greedy algorithm calculating total population coverage by each peptide and the ones preceding it, with a total of 98.8% population coverage by the 10 peptides. (D) Shows all identified peptides from cell line NB4 sample, with a 60.7% cumulative coverage of DRPs expressing HLA-B∗35:01 within the data set by the 3 peptides. (E) Shows all identified peptides from cell line MONOMAC1, with a 78.9% cumulative coverage of HLA-C∗07:02–expressing DRPs within the data set. (F) Shows cumulative coverage by the 16 novel confirmed HLA-A∗02:01–binding mHAs and 1000 simulated sets of 16 peptides from the set of mHAs searched by mass spectrometry. Cumulative coverage by confirmed peptides is shown in blue, whereas each simulated run is shown as an individual gray line. (G) Shows cumulative coverage for the 3 confirmed HLA-B∗35:01–binding mHAs and 1000 simulated sets of 3 peptides. (H) Shows cumulative coverage for the 5 confirmed HLA-C∗07:02–binding mHAs and 1000 simulated sets of 5 peptides. (I) Shows flow cytometry staining from the mHA immunogenicity experiment. “UV only” shows negative control stained with tetramer exposed to UV light with no peptide. “Flu-M158-66” shows CD8 T cells cocultured with M158-66 pulsed DCs, stained with M158-66 tetramer. “UNC-HEXDC-V” shows CD8 T cells cocultured with novel mHA UNC-HEXDC-V stained with UNC-HEXDC-V tetramer.

Similar articles

Cited by

References

    1. Lansford JL, Dharmasiri U, Chai S, et al. Computational modeling and confirmation of leukemia-associated minor histocompatibility antigens. Blood Adv. 2018;2(16):2052–2062. - PMC - PubMed
    1. Griffioen M, van Bergen CAM, Falkenburg JHF. Autosomal minor histocompatibility antigens: how genetic variants create diversity in immune targets. Front Immunol. 2016;7:100. - PMC - PubMed
    1. Mullally A, Ritz J. Beyond HLA: the significance of genomic variation for allogeneic hematopoietic stem cell transplantation. Blood. 2006;109(4):1355–1362. - PubMed
    1. Bleakley M, Riddell SR. Exploiting T cells specific for human minor histocompatibility antigens for therapy of leukemia. Immunol Cell Biol. 2011;89(3):396–407. - PMC - PubMed
    1. Horowitz MM, Gale RP, Sondel PM, et al. Graft-versus-leukemia reactions after bone marrow transplantation. Blood. 1990;75(3):555–562. - PubMed

Publication types

Substances