. 2022 Dec;612(7940):564-572.
doi: 10.1038/s41586-022-05504-4. Epub 2022 Dec 7.

Structural variants drive context-dependent oncogene activation in cancer

Affiliations

Structural variants drive context-dependent oncogene activation in cancer

Zhichao Xu et al. Nature. 2022 Dec.

Abstract

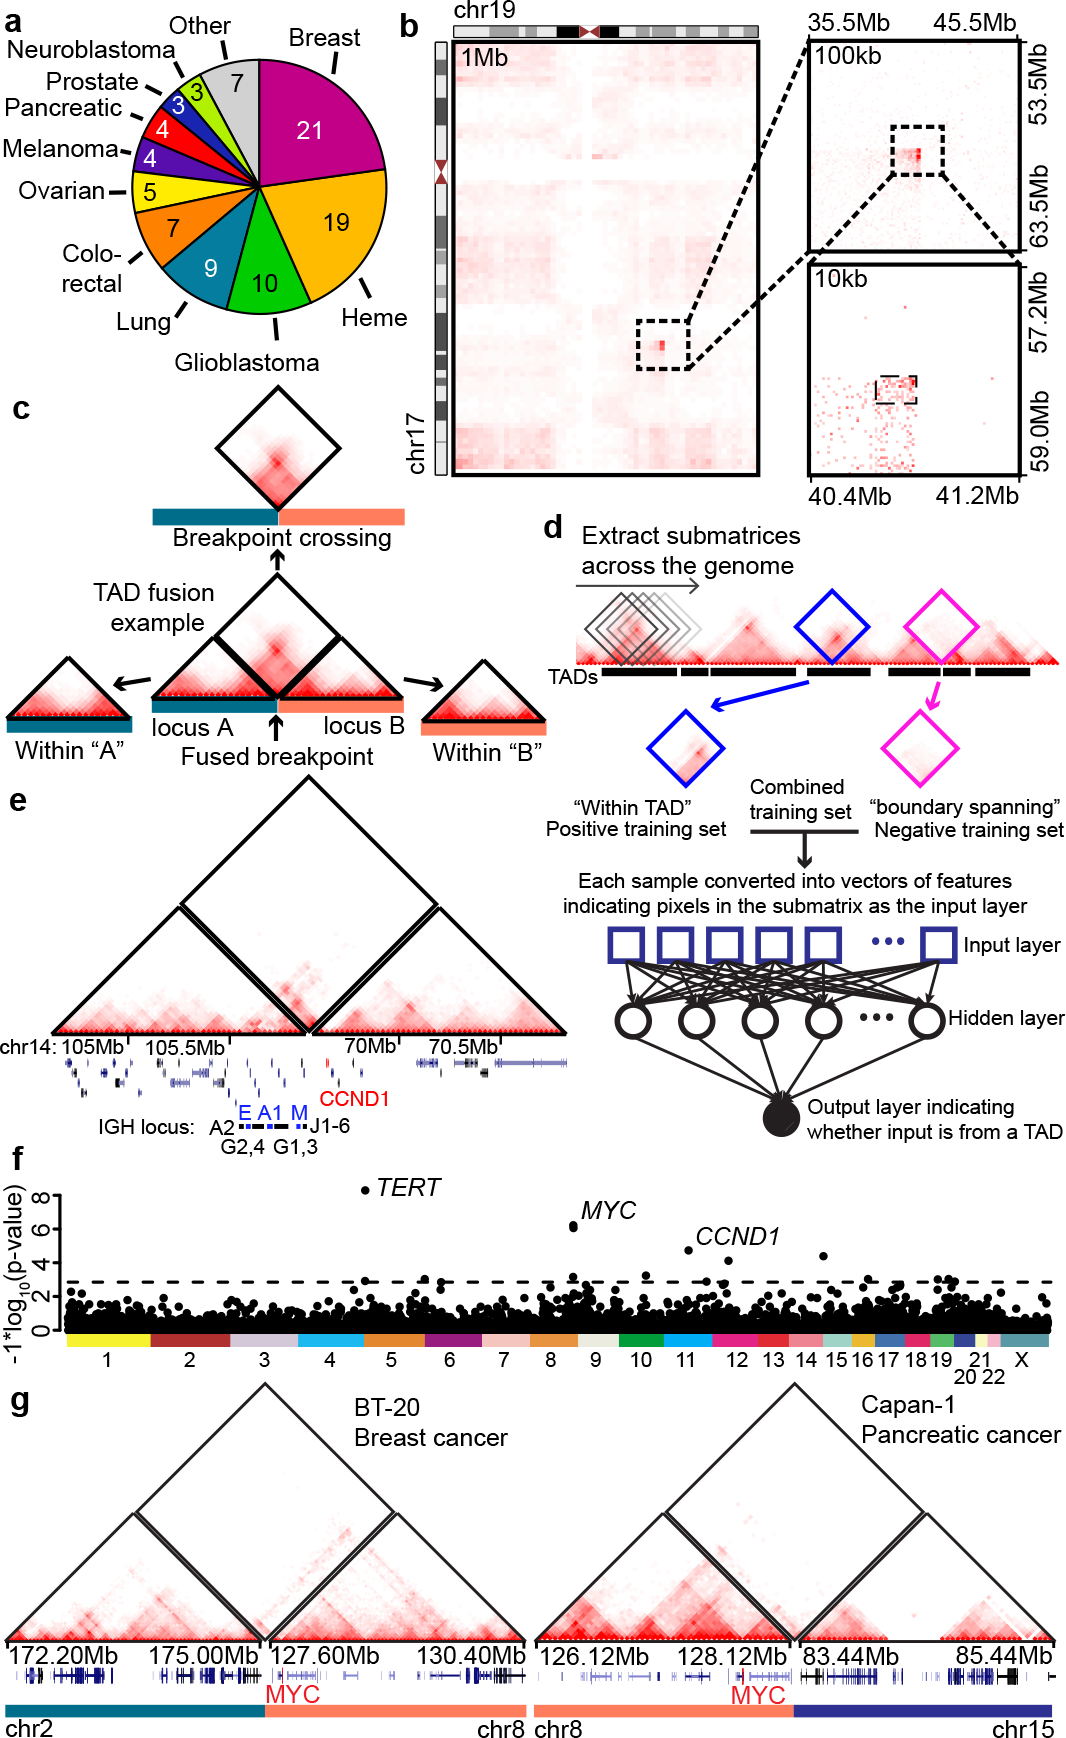
Higher-order chromatin structure is important for the regulation of genes by distal regulatory sequences1,2. Structural variants (SVs) that alter three-dimensional (3D) genome organization can lead to enhancer-promoter rewiring and human disease, particularly in the context of cancer3. However, only a small minority of SVs are associated with altered gene expression4,5, and it remains unclear why certain SVs lead to changes in distal gene expression and others do not. To address these questions, we used a combination of genomic profiling and genome engineering to identify sites of recurrent changes in 3D genome structure in cancer and determine the effects of specific rearrangements on oncogene activation. By analysing Hi-C data from 92 cancer cell lines and patient samples, we identified loci affected by recurrent alterations to 3D genome structure, including oncogenes such as MYC, TERT and CCND1. By using CRISPR-Cas9 genome engineering to generate de novo SVs, we show that oncogene activity can be predicted by using 'activity-by-contact' models that consider partner region chromatin contacts and enhancer activity. However, activity-by-contact models are only predictive of specific subsets of genes in the genome, suggesting that different classes of genes engage in distinct modes of regulation by distal regulatory elements. These results indicate that SVs that alter 3D genome organization are widespread in cancer genomes and begin to illustrate predictive rules for the consequences of SVs on oncogene activation.


Conflict of interest statement

Declaration of Interests

The authors declare no competing financial interests

Figures

Extended Data Figure 1.
Extended Data Figure 1.. Identification of rearrangements based on Hi-C data.
a, Pie chart showing all 4,543 rearrangements identified and which cell line or patient tumor sample they are derived from. The order in the pie chart starts with A172 cells and proceeds counter-clockwise. b, Resolution of structural variants calls from Hi-C. Calls are first identified at low resolution and then progressively refined. The resolution reported is the highest resolution with which a given structural variant is identified. c, Chromatin interaction maps from mixed lineage leukemia cell lines with known MLL/KMT2A rearrangements. The maps show the presence of translocations on chromosome 4 in MV4;11 cells (left), chromosome 6 in ML2 cells (middle), and chromosome 9 in MOLM13 cells (right). d, Heat maps showing known disease defining translocations from five Mantle Cell lymphoma cell lines (Rec-1, Mino, Maver, Jeko, Granta). e, Heat maps showing known disease defining translocations in two Chronic Lymphocytic Leukemia cell lines (K562 and KBM7).
Extended Data Figure 2.
Extended Data Figure 2.. Features associated with TAD fusion events.
a, Pie chart showing the fraction of intra-chromosomal vs. inter-chromosomal structural variant predictions. b, The number of observed intra-chromosomal (blue) or inter-chromosomal (red) rearrangements identified in each cell line. c, -log10 (p-values) for the observed frequency of intra-chromosomal rearrangements for each chromosome in each cell line under the null hypothesis that rearrangements are randomly distributed across chromosomes. The dashed line shows the threshold for significance accounting for multiple testing using a Bonferroni correction (p=2.5×10⁻⁵). d, Example of high-frequency local rearrangements on chromosome 9 in U343 cells. Below the matrix is an arc plot of predicted rearrangements. e, Example of high-frequency local rearrangements along chromosome 15 in SNU-C1 cells (shown in the upper right-hand half of the matrix) in comparison with data from chromosome 15 in LoVo cells (lower left hand) where no rearrangements are observed. Below the matrix is an arc plot of predicted rearrangements. f, Results of cross validation of the neural network. The violin plots show the distribution of the accuracy and false discovery rate (FDR) across all 82 samples. g, Bar plots showing the percentage of domains containing oncogenes (based on the Cosmic Cancer Gene census) in domains identified as being part of fusion TADs (blue) versus those not identified in fusion TADs (grey). P-value is calculated by Fisher’s exact test. h, Bar plots showing the percentage of domains that contain enhancers for domains that contain TAD fusion events (blue) or do not (gray). The domain/enhancer analysis was performed for each domain in each cell type. P-value is calculated by Fisher’s exact test. i, Violin plots showing the distribution of the frequency of enhancers in domains that show TAD fusion events (blue) versus those that do not (gray). P-value is calculated from the two-sided Wilcoxon Rank Sum test. j, Bar plots showing the percentage of domains that contain super enhancers for domains that contain TAD fusion events (blue) or do not (gray). The domain/super-enhancer analysis was performed for each domain in each cell type. P-value is calculated by Fisher’s exact test. k, Violin plots showing the number of END-seq reads per kb for TADs that contain super enhancers (blue) versus those that do not (gray).
Extended Data Figure 3.
Extended Data Figure 3.. TAD fusion events at the MYC locus.
a, The number of called domains in each of five cell lines (hESC, HCC38, MV411, NCI-H1437, DLD-1) and the number of domains after merging unique boundaries (Merged). b, Quantile-quantile plot for evaluating the false discovery rate for recurrent TAD fusion identification. The observed p-values (Y-axis) are estimated using a Poisson model accounting for the overall frequency of rearrangements and the size of the domain. Randomized p-values are generated from these expected values (x-axis). This randomization analysis was repeated 1000 times to estimate the FDR at different p-value cut-offs. c, Hi-C data over the MYC locus in five cell types used for generating the merged TAD boundary set. The locations of TAD calls are shown in black bars below each heat map. This includes the TAD calls for each cell type as well as the across-cell merged calls (“Union set”). d, Estimated copy number of the MYC gene for samples with a TAD fusion event at the MYC locus versus those that do not. The copy number is estimated from the total number of Hi-C reads over the 100kb bin surrounding the MYC gene divided by the median read count per 100kb bin in each cell line. e, Circos plot showing the translocation partner region of each predicted TAD fusion event at the MYC locus. f, Examples of identified TAD fusion events at the MYC locus in two cell lines.
Extended Data Figure 4.
Extended Data Figure 4.. Inter TAD rearrangements at the MYC locus in human patient tumor samples.
a, Bar plot showing the frequency of patient samples containing inter-TAD rearrangements at the MYC locus by tumor type. b, Fraction of PCAWG samples with SVs at the MYC locus based on copy number. Samples are stratified into low copy (<=2), mid-copy (>2 and <=6), and high-copy (>6). c, Violin plots showing MYC expression for PCAWG samples stratified by copy number and the presence or absence of an SV at the MYC locus. P-values are calculated using Kruskal-Wallis test. d, RNA-seq expression of the MYC gene from patient samples with matched structural variant calls for samples with no high-level copy number alterations at the MYC gene (copy <= 6). Samples are separated into those that contain an inter-TAD rearrangement at the MYC locus (blue) and those that do not (black). P-value is from two-sided Wilcoxon Rank Sum test. e, RNA-seq expression of the MYC gene from patient samples with matched structural variant calls that are copy neutral at the MYC gene (copy <= 2). Samples are separated into those that contain an inter-TAD rearrangement at the MYC locus (blue) and those that do not (black). P-value is from two-sided Wilcoxon Rank Sum test. f, Circos plot of all inter-TAD rearrangements at the MYC locus. The Circos plot is zoomed in on cytoband 8q24.21 to show the MYC locus at a higher resolution. The position of TAD calls (black) and genes (green) are marked below the track.
Extended Data Figure 5.
Extended Data Figure 5.. Engineered rearrangements in SK-N-DZ cells.
a, Hi-C heat maps between chromosomes 7 and 8 in SK-N-SH cells (left) and SK-N-DZ cells (right). SK-N-SH cells have an endogenous t(7;8) translocation that creates a TAD fusion event at the locus, while SK-N-DZ cells have no rearrangements at the MYC locus in wild-type cells. b, Schematic for engineering rearrangement strategy. Guide RNAs targeting a locus ~300kb downstream from the MYC gene and Guide RNAs targeting the partner region are cloned into a vector expressing Cas9. Guides are expressed either as single guides on plasmid with different fluorescent proteins or as dual guides on a plasmid with a single fluorescent protein. Cells are sorted and plated as single cells into 96 well plates. These can then be screened by PCR over the potential breakpoint to identify engineered clones. c, Sanger sequencing of PCR products from different engineered clones. The sequences that align to chromosome 7 are highlighted in green, while the sequences that align to chromosome 8 are highlighted in purple. d, Similar to Figure 4b, validation of the engineered t(7;8) translocation by chromosome painting. e, MYC expression in cell lines containing endogenous or engineered rearrangements at the MYC locus including the non-rearranged SK-N-DZ parent cell line (purple), engineered clones classified as “Non-activating” (light blue), engineered clones classified as “MYC-activating” (dark red), Neuroblastoma cell lines with endogenous MYC rearrangements (green), and non-Neuroblastoma cell lines with MYC rearrangements (black). f, Scatter plot showing MYC expression (y-axis) and estimated MYC copy number (x-axis). g, Scatter plot showing MYC expression (y-axis) and estimated MYCN copy number (x-axis). h, Scatter plot showing MYC expression (y-axis) and MYCN expression (x-axis). i, FACS plots of mClover2 fluorescence in SK-N-DZ cells with a T2A-mClover2 reporter knocked into the 3’ end of the MYC gene (pink) and in a line derived from this MYC reporter with an engineered translocation between chromosome 1 and 8 (green). j, Heat map of chromosome 1 translocation to chromosome 8 with box showing H3K27ac ChIP-seq data over the partner region. The small inset box on the ChIP-seq track shows the enhancer targeted for deletion. k, FACS showing mClover2 fluorescence levels in the original chromosome 1 and chromosome 8 MYC reporter translocation (red) and in the same line with the targeted enhancer deletion (blue). The gate shows the region classified as “mClover2 low”. An example of the gating strategy for is also shown, including gating for single-cells and mCherry positive cells (FSC – forward scatter, SSC – side scatter, A – area, W – width). l, Percentage of “mClover2 low” cells in the control (red) and deletion (blue) cells. P-value is using Student’s two-sided T-test. m, MYC RPKM of clones with enhancer deletion on wild type allele and MYC-translocated allele. P-value is using two-sided T-test with equal variance.
Extended Data Figure 6.
Extended Data Figure 6.. Models for activation in engineered rearrangements.
a, Example plot showing method for calculating ABC score for MYC with rearranged partner sites. Interaction frequency between the MYC promoter and H3K27ac peaks in the partner region (“contact”) is multiplied by the strength of the H3K27ac signal (“activity”) at each peak across the partner region to obtain a final score for each peak. This signal is then summed across all peaks over the partner region. Of note, this example plot only shows the calculations for the six strongest H3K27ac peaks in the partner region, whereas the actual score is calculated using all H3K27ac peaks. b, Receiver Operating Characteristic (ROC) curve for the TAD delimited ABC model. Shown above the plot is the area under the curve (AUC). c, ROC curve for an ABC model where contacts are measured from genome wide average interaction frequencies. d, Plots showing ABC scores for genes neighboring MYC. Above the plot is the Pearson correlation coefficient for each gene between the genes’ ABC score and expression. e, Heat map of the TAD surrounding MYC as well as the location and relative position of the genes shown in panel D. f, Scatter plot showing ABC scores and summed enhancer activity within 3 Mb for every gene in 30 cancer cell lines. g, Scatter plot showing ABC scores and summed interaction within 3 Mb for every gene in 30 cancer cell lines. h, The number of enhancers per gene linked by the marginal ABC score >= 0.1 for ABC-correlated and non-correlated genes. Gray lines show the paired values for each cell line comparing ABC-correlated and non-correlated genes. P-value is from paired Wilcoxon test. i, Percentage of ABC responsive (blue) and protein-coding genes classified as transcription factors. Protein coding genes are from the Gencode reference annotation. P-value is from Fisher’s Exact test. j, Percentage of ABC responsive (blue) and protein-coding genes classified as oncogenes according to the Cosmic cancer gene census. P-value is from Fisher’s Exact test. k, Normalized interaction frequency as a function of distance for Hi-C interactions at 10kb resolution in SK-N-DZ cells. Interaction frequency decays exponentially as a function of distance. l, Enhancer activity based on H3K27ac ChIP-seq as quantified by the ROSE super enhancer calling activity for all enhancers in SK-N-DZ cells. Enhancers are displayed ranked according to strength. Super-enhancers show exponentially stronger enhancer activity compared with typical enhancers. m, Enhancer activity required to achieve the equivalent activity-by-contact score for the median enhancer at 20kb in SK-N-DZ cells as a function of genomic distance. Shown as a dashed line is the minimal enhancer strength categorized as a “super enhancer” in SK-N-DZ cells by the ROSE algorithm. Due to the exponential decay in interaction frequency. After ~300kb, the only enhancers capable of producing an ABC score equivalent to the median enhancer at 20kb are super enhancers.
Figure 1.
Figure 1.. TAD fusion events from Hi-C data in cancer samples.
a, Tumor types represented in 92 cancer cell lines and patient tumor samples Hi-C datasets. b, Translocation between chromosomes 17 and 19 from a breast cancer patient tumor sample (C3–14_06). Translocations are first identified from chromatin interactions at low resolutions (1Mb, left heat map) and progressively refined at higher resolutions (right heat maps). c, Strategy of identifying TAD fusion events in rearranged genomes. An example TAD fusion event is between two otherwise distal loci (“locus A” and “locus B”). The chromatin interactions can be broken down into those that occur within the breakpoint proximal regions (triangle heat maps, “within A” or “within B”) and those that cross the breakpoint (diamond heat map). d, Neural network-based classifier for identifying TAD fusion events. “Diamond” matrices from non-rearranged regions within TADs or between TADs are used to train the neural network model. The model then classifies a diamond matrix from a structural variant as derived from a TAD or not. e, Hi-C data from an IGH-CCND1 fusion in the Granta cell line predicted to form a TAD fusion event. The left-hand triangle heat map shows interactions within chromosome 14, the right-hand triangle heat map shows interactions within chromosome 11, and the diamond heat map shows interactions crossing the breakpoint between chromosomes 11 and 14. IGH and CCND1 loci are marked at the bottom. f, P-value for the number of TAD fusion events for each TAD in the genome. The p-value is computed with a null model that considers the overall frequency of TAD fusion events and the size of each domain. The dashed line represents the threshold for an FDR of <20%. g, Examples of identified TAD fusion events at the MYC locus in two cell lines.
Figure 2.
Figure 2.. Inter-domain rearrangements in patient tumor samples.
a, The frequency of inter-TAD rearrangements among 2,510 patient samples for each of 5,384 domains across the genome (5,384/5,450 domains successfully lifted over to hg19 genome). Domains are sorted by size. The four sub-domains near the MYC gene are labelled in orange. The sub-domains immediately upstream (centromeric) or downstream (telomeric) of MYC are labelled “MYC-cen” and “MYC-tel”, respectively. Select domains are also labelled by gene names within each domain. Genes at known fragile sites are labelled with “*”, and genes at known high-frequency gene fusion events are labelled with “†”. Domains that show frequent TAD fusion events based on Hi-C data are shown in pink with the exception of the MYC-cen and MYC-tel domains. b, Expression level of the MYC gene based on RNA-seq in matched patient samples for tumors that do not contain inter-TAD rearrangements at the MYC TAD (“non-rearranged”) or that do contain inter-TAD rearrangements at the MYC locus (“MYC-rearranged”). Results are shown for all patients with matching structural variant and RNA-seq data (“Pan cancer”). P-value is from two-sided Wilcoxon rank sum test. c, Similar to B, but showing expression for specific tumor subsets (MALY-DE – Malignant Lymphoma; BRCA-US – breast cancer; UCEC-US – Endometrial cancer; OV-AU – Ovarian cancer; abbreviations based on Pan-cancer analysis of whole genomes naming conventions). P-value is from two-sided Wilcoxon rank sum test. d, Kaplan-Meier survival curves for patients in a Melanoma cohort (SKCM-US) separated into those with inter-TAD rearrangements at the MYC locus (purple, N=4) and those without (grey, N=34). P-value is from two-sided Cox Proportional Hazard model likelihood ratio test. e, Hi-C data over the TAD containing the MYC gene in H1 hESCs, GM12878 cells, and Mesenchymal stem cells (MSC). Shown below the tracks are ChIP-seq data for H3K27ac in each lineage.
Figure 3.
Figure 3.. Engineered rearrangements and MYC gene activation.
a, Circos plot of engineered rearrangements. Rearrangements from the “test” set are red and the “validation” set are green. b, Chromosome painting confirming the presence of a large-scale rearrangement targeting chromosome 6. Chromosome 8 is in red and chromosome 6 is green. DNA is blue by DAPI staining. The parent SK-N-DZ cells do not show rearrangements between chromosome 8 and chromosome 6 (left), but translocated chromosomes are observed in the rearranged clones (right). Similar results were observed in a minimum of 20 nuclei for each clone. c, Enhancer activity across TADs in SK-N-DZ cells. Enhancers were identified as distal H3K27ac sites based on ChIP-seq data and summed across domains. Domains in the “test” set are in red, while domains in the “validation” set are in blue. d, Hi-C data from two engineered clones showing de novo TAD fusion events to chromosome 7 (left) and chromosome 12 (right). e, Expression of the MYC gene as measured by RNA-seq in wild-type and engineered SK-N-DZ cells. Clones with MYC not activated are colored grey while those with activated MYC are colored red and blue in test and validation set, respectively. f, Hi-C data showing an engineered TAD fusion event at the MYC locus between chromosome 8 and chromosome 1 (top) and between chromosome 8 and chromosome 12 (bottom). g, MYC RNA-seq expression in engineered clones shown in panel F. h, H3K27ac ChIP-seq signal over the partner region of the engineered rearrangements shown in panel F and G. i, Receiver operating characteristic (ROC) curves for four models of MYC activation. The area-under-curve (AUC) is also shown for each model. Integrated Enhancer Activity is calculated by summing all enhancers within 3Mb of MYC over the partner region of the engineered translocation.
Figure 4.
Figure 4.. Quantitative models of MYC expression in the context of engineered rearrangements.
a, Hi-C data of an engineered rearrangement between chromosome 8 and 10 where a strong TAD boundary is located immediately downstream from the breakpoint with a strong super-enhancer distal to the TAD boundary. Below the track is the H3K27ac ChIP-seq signal. An asterisk marks the location of the strong super-enhancer. b, Scatter plot of ranked enhancer strength as measured by H3K27ac ChIP-seq. The super-enhancer downstream from the TAD boundary shown in panel A is highlighted in red. c, MYC expression in engineered clones. The light blue “boundary” clone is the event shown in panel A, while the other clones are instances where MYC shows significant upregulation compared to the parent wild-type SK-N-DZ cell line. d, ROC curve for the Activity-By-Contact (ABC) model. e, Scatter plot of the ABC score compared to MYC expression as measured by RNA-seq (reads per kilobase per million reads sequenced – RPKM). f, Predicted (left) and observed (right) contact maps resulting from an engineered translocation between chromosome 6 and 8. g, ROC curve for an ABC model where contacts are replaced by “predicted” contact frequency from the Orca deep learning model. h, Bar plots showing the Area-Under-Curve (AUC) for the test set of engineered rearrangements (top) for different predictive models of MYC activation as well as the classification accuracy of each model on the “validation” set of engineered rearrangements. The score for the “validation” set was chosen as the cut-off from the test set with the highest classification accuracy.
Figure 5.
Figure 5.. Genome wide ABC models across cell lines.
a, RNA-seq for all genes within the TAD at the MYC locus with evidence of expression in at least one clone. Expression is shown for wild-type clones (orange) and engineered clones (blue) (p-value from two-sided Wilcoxon Rank Sum test). b, Pearson correlations between RPKMs and ABC scores for all genes across 30 cancer cell lines compared with randomly shuffled controls. (p-value from two-sided Kruskal-Wallis test). c, RPKM and ABC scores for the gene ISL1. d, Hi-C contact frequency in SK-N-DZ (top right) and MDA-MB-468 (bottom left) near ISL1. H3K27ac ChIP-seq tracks of three cell lines with different expression levels of ISL1 are shown below. e, Gene ontology analysis of 962 genes with significant correlations (FDR 1%) between RPKMs and ABC score. FDR is calculated empirically by randomly shuffling the ABC scores 1000 times. f, Percent of ABC-correlated or background genes upregulated more than 4-fold relative to the mean expression when in the same TAD as a structural variant from the PCAWG dataset (p-value from Fisher’s exact test). g, Gene density within 250 kb of the 962 correlated and non-correlated genes (p-value from two-sided Kruskal-Wallis test). h, Standard deviation of PC1 in the group of 962 correlated genes and the group of the rest of genes (p-value from two-sided Kruskal-Wallis test). i, Empirical cumulative density function curves of the number of compartment switches for correlated and background genes. Genes are assigned a compartment type (A or B) based on the sign of their compartment score (A=positive, B=negative). The number of compartment switches is calculated as the number of cell lines that show an A/B compartment type that is different from the majority compartment type for that gene.

References

    1. Dekker J & Mirny L The 3D Genome as Moderator of Chromosomal Communication. Cell 164, 1110–1121, doi:10.1016/j.cell.2016.02.007 (2016). - DOI - PMC - PubMed
    1. Yu M & Ren B The Three-Dimensional Organization of Mammalian Genomes. Annu Rev Cell Dev Biol 33, 265–289, doi:10.1146/annurev-cellbio-100616-060531 (2017). - DOI - PMC - PubMed
    1. Spielmann M, Lupianez DG & Mundlos S Structural variation in the 3D genome. Nat Rev Genet 19, 453–467, doi:10.1038/s41576-018-0007-0 (2018). - DOI - PubMed
    1. Ghavi-Helm Y et al. Highly rearranged chromosomes reveal uncoupling between genome topology and gene expression. Nat Genet 51, 1272–1282, doi:10.1038/s41588-019-0462-3 (2019). - DOI - PMC - PubMed
    1. Akdemir KC et al. Disruption of chromatin folding domains by somatic genomic rearrangements in human cancer. Nat Genet 52, 294–305, doi:10.1038/s41588-019-0564-y (2020). - DOI - PMC - PubMed

Methods References

    1. Ran FA et al. Genome engineering using the CRISPR-Cas9 system. Nat Protoc 8, 2281–2308, doi:10.1038/nprot.2013.143 (2013). - DOI - PMC - PubMed
    1. DePristo MA et al. A framework for variation discovery and genotyping using next-generation DNA sequencing data. Nat Genet 43, 491–498, doi:10.1038/ng.806 (2011). - DOI - PMC - PubMed
    1. Selvaraj S, J, R. D., Bansal, V. & Ren, B. Whole-genome haplotype reconstruction using proximity-ligation and shotgun sequencing. Nat Biotechnol 31, 1111–1118, doi:10.1038/nbt.2728 (2013). - DOI - PMC - PubMed
    1. Edge P, Bafna V & Bansal V HapCUT2: robust and accurate haplotype assembly for diverse sequencing technologies. Genome Res 27, 801–812, doi:10.1101/gr.213462.116 (2017). - DOI - PMC - PubMed
    1. Dobin A et al. STAR: ultrafast universal RNA-seq aligner. Bioinformatics 29, 15–21, doi:10.1093/bioinformatics/bts635 (2013). - DOI - PMC - PubMed

Publication types