. 2023 Jan;613(7942):160-168.
doi: 10.1038/s41586-022-05507-1. Epub 2022 Dec 7.

CLSTN3β enforces adipocyte multilocularity to facilitate lipid utilization

Affiliations

CLSTN3β enforces adipocyte multilocularity to facilitate lipid utilization

Kevin Qian et al. Nature. 2023 Jan.

Abstract

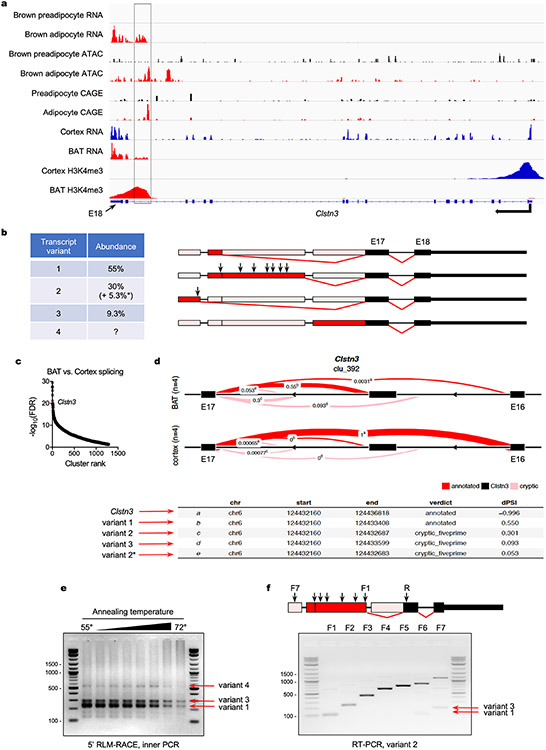
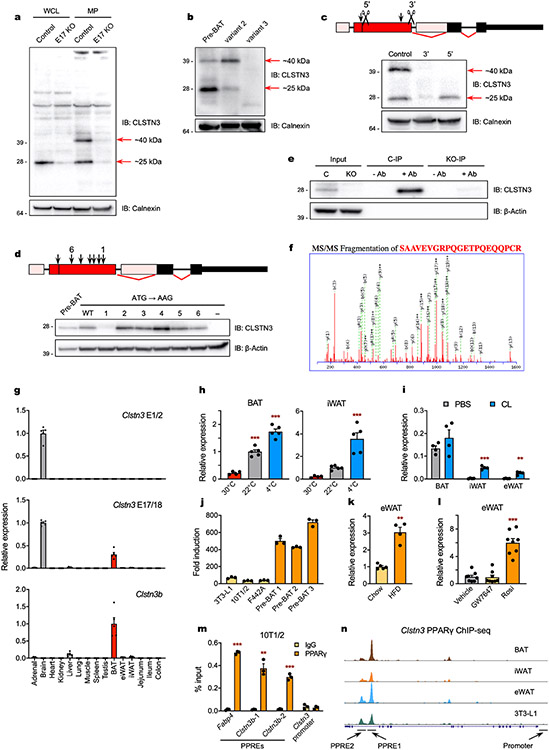
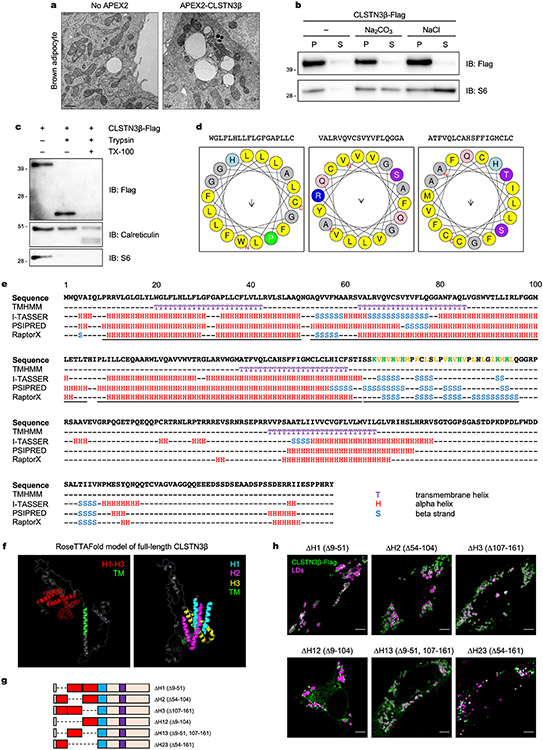
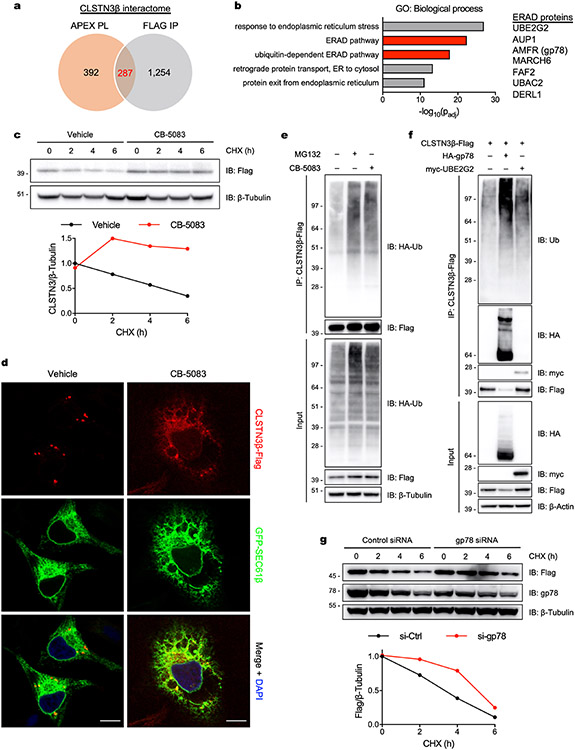
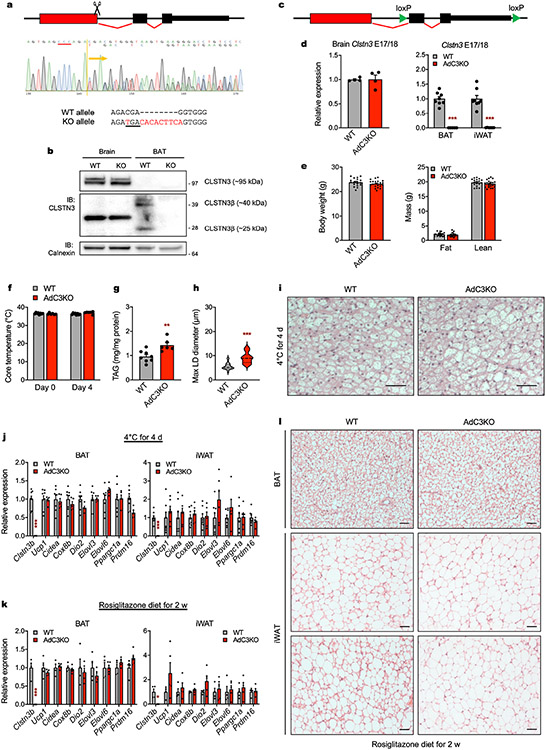
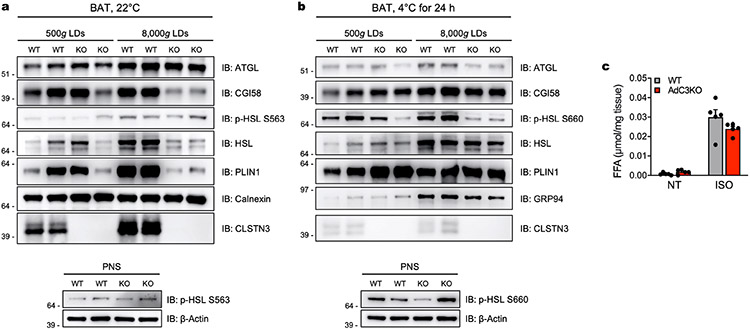
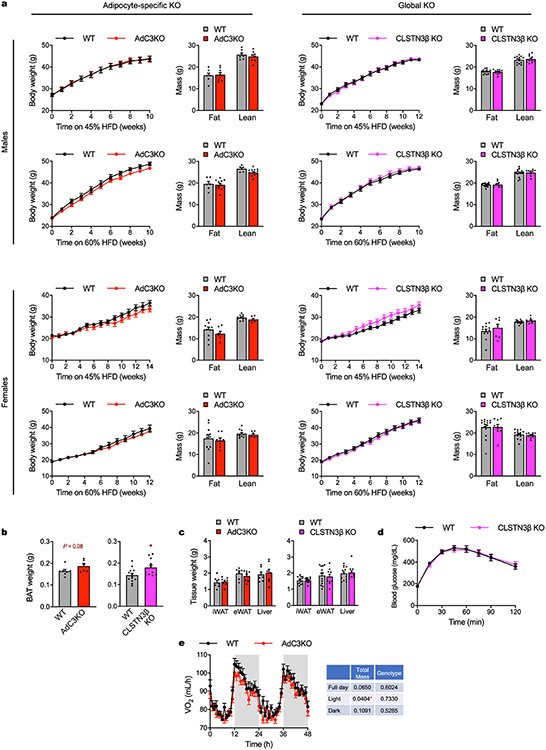
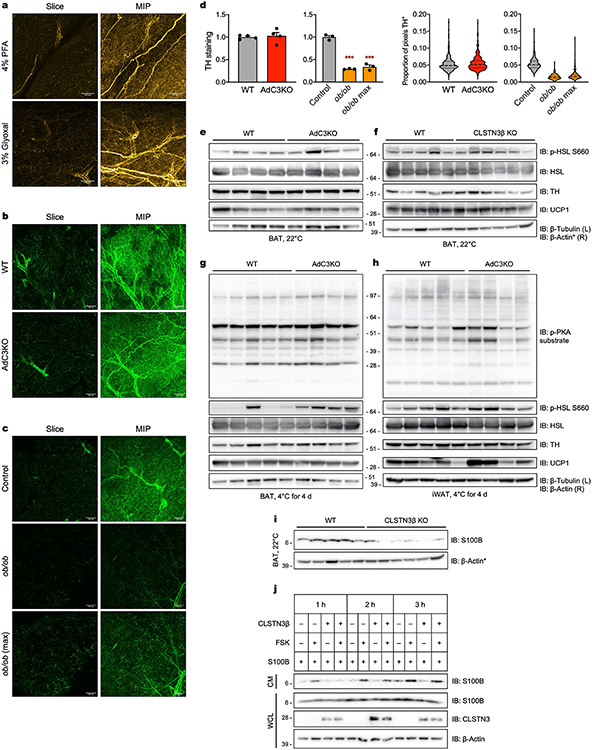
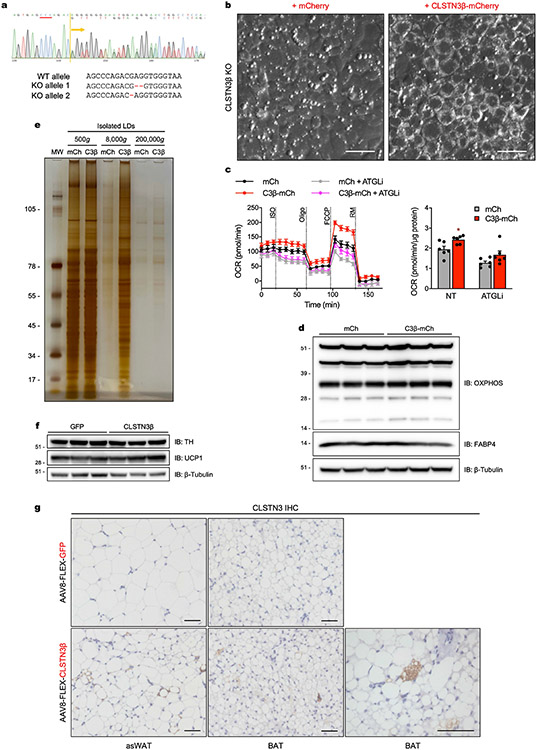
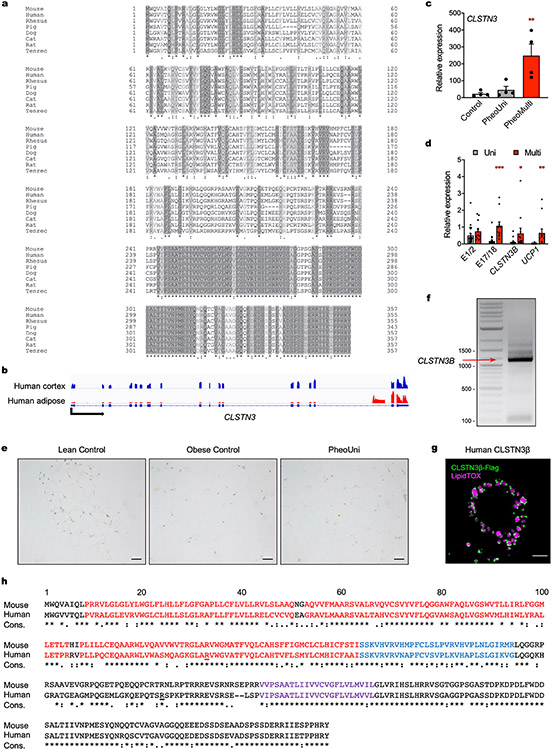
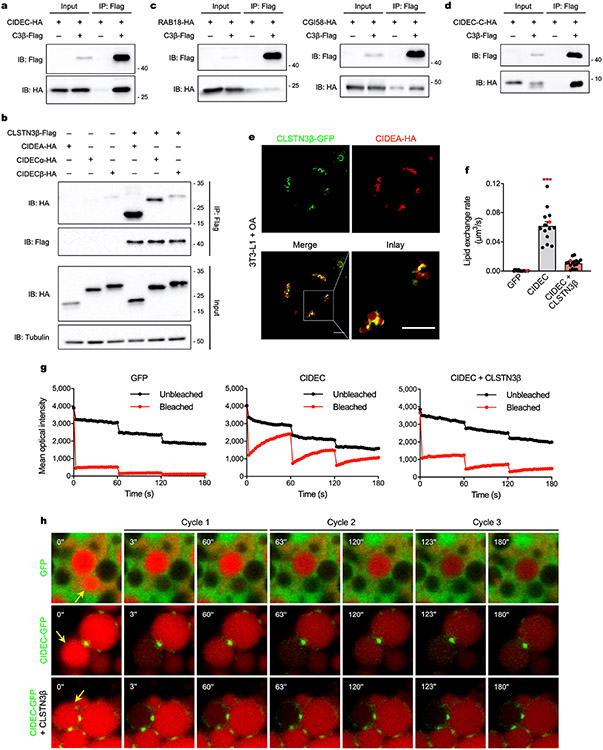
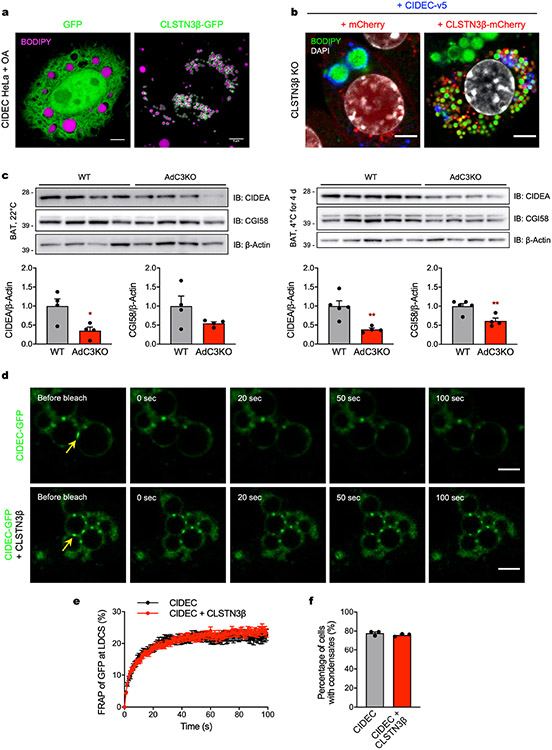
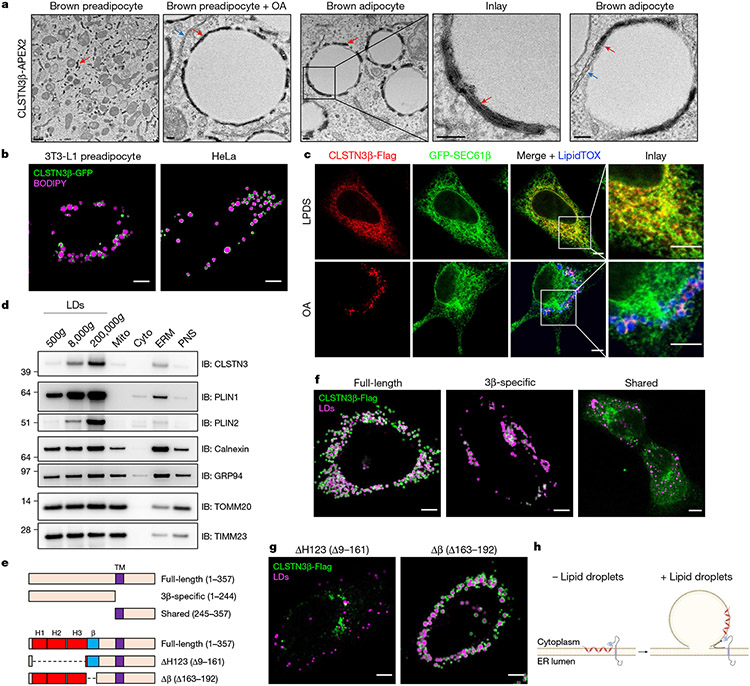
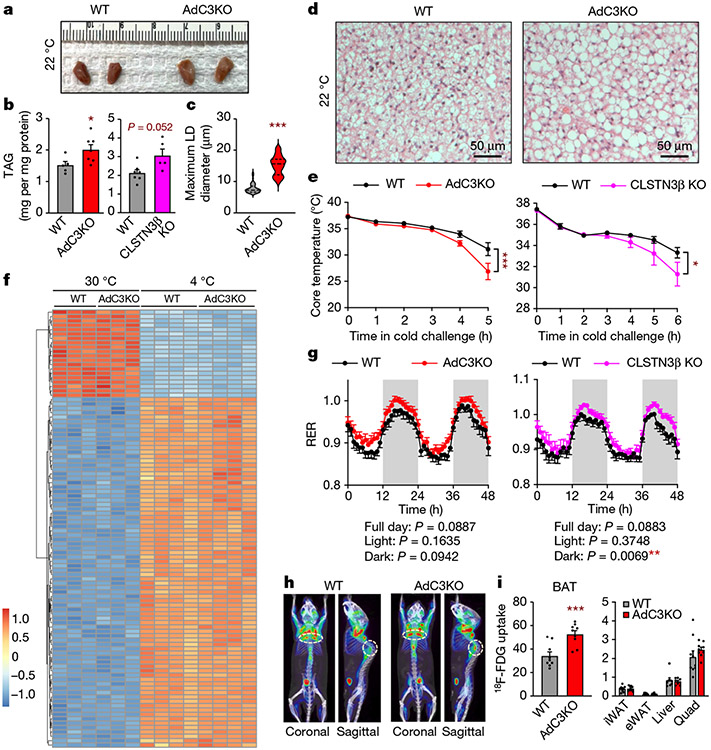
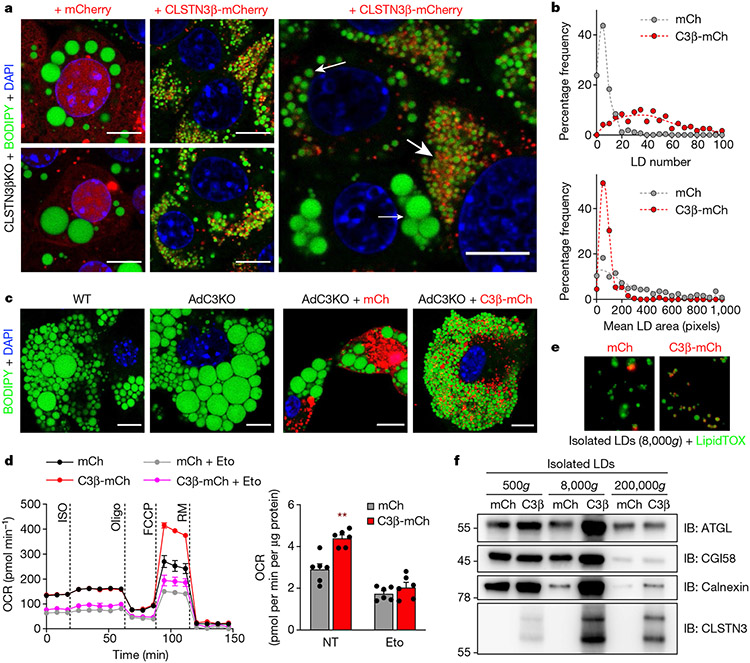
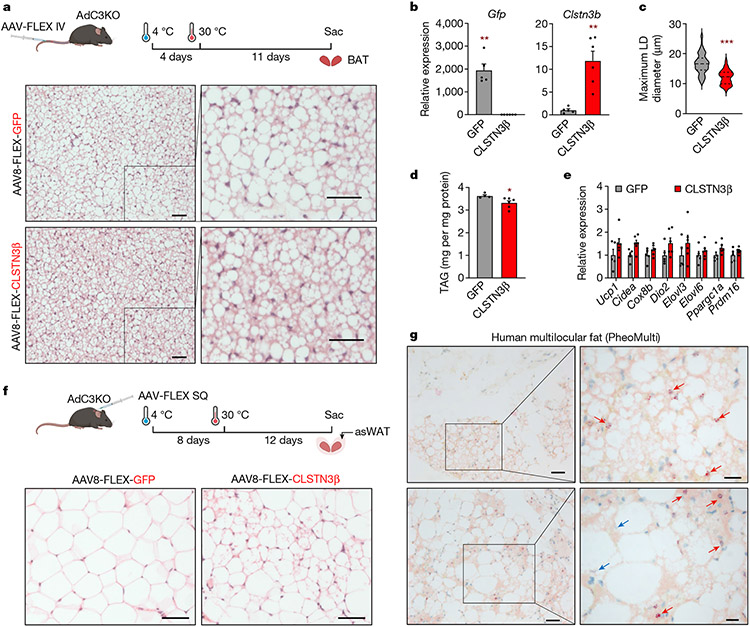
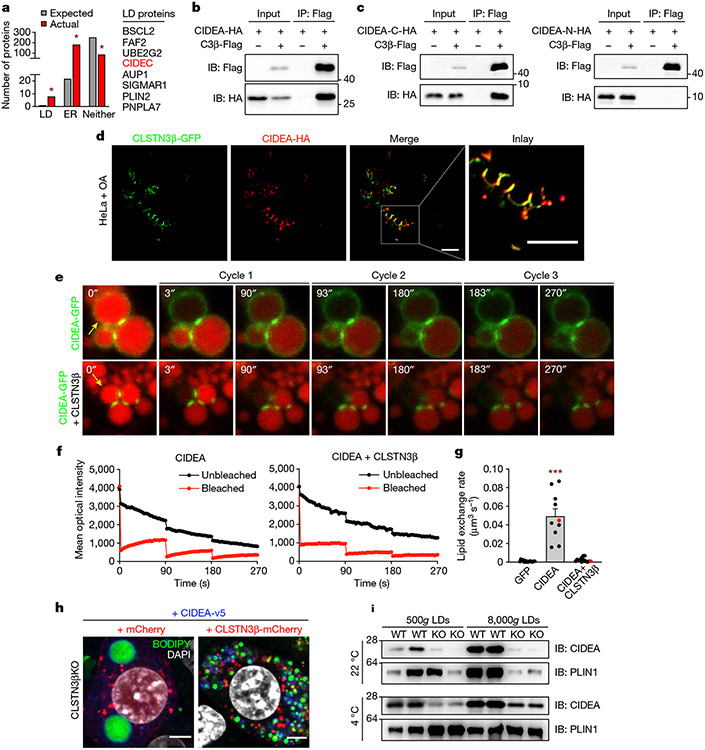
Multilocular adipocytes are a hallmark of thermogenic adipose tissue1,2, but the factors that enforce this cellular phenotype are largely unknown. Here, we show that an adipocyte-selective product of the Clstn3 locus (CLSTN3β) present in only placental mammals facilitates the efficient use of stored triglyceride by limiting lipid droplet (LD) expansion. CLSTN3β is an integral endoplasmic reticulum (ER) membrane protein that localizes to ER-LD contact sites through a conserved hairpin-like domain. Mice lacking CLSTN3β have abnormal LD morphology and altered substrate use in brown adipose tissue, and are more susceptible to cold-induced hypothermia despite having no defect in adrenergic signalling. Conversely, forced expression of CLSTN3β is sufficient to enforce a multilocular LD phenotype in cultured cells and adipose tissue. CLSTN3β associates with cell death-inducing DFFA-like effector proteins and impairs their ability to transfer lipid between LDs, thereby restricting LD fusion and expansion. Functionally, increased LD surface area in CLSTN3β-expressing adipocytes promotes engagement of the lipolytic machinery and facilitates fatty acid oxidation. In human fat, CLSTN3B is a selective marker of multilocular adipocytes. These findings define a molecular mechanism that regulates LD form and function to facilitate lipid utilization in thermogenic adipocytes.


Figures

Extended Data Fig. 1 ∣
Extended Data Fig. 1 ∣. Identification of Clstn3b transcript species.
a, RNA-, ATAC-, CAGE-, and H3K4me3 ChIP-seq reads at the Clstn3 locus in mouse preadipocytes (day 0 of differentiation), adipocytes (day 5 of differentiation), cortex, and BAT. b, Summary of mouse Clstn3b transcript variants. Arrows mark positions of possible start codons (ATGs that are in-frame with Clstn3 exons 17/18). c, LeafCutter analysis of differential splice site utilization in mouse BAT and cerebral cortex. Intron clusters are ranked by statistical significance. Clstn3 (rank 8) is highlighted in red. d, LeafCutter output for the Clstn3 intron cluster. e, 5’RLM-RACE products from mouse BAT using gene-specific primers targeting Clstn3 exon 17. f, RT-PCR products from mouse BAT using primers targeting Clstn3b transcript variant 2. Black arrows mark positions of primers (F1-F7 = forward 1 through forward 7, R = reverse). *This splice site is actually two splice sites that are 4 base pairs apart. One (30%) is in-frame with Clstn3 exons 17/18 and produces a protein-coding transcript. The other (5.3%) is out-of-frame with Clstn3 exons 17/18 and produces a non-coding transcript.
Extended Data Fig. 2 ∣
Extended Data Fig. 2 ∣. Identification of CLSTN3β protein species and transcriptional regulation of Clstn3b.
a, Whole cell lysates (WCL) and membrane preparations (MP) of control and Clstn3 exon 17 KO Pre-BAT cells (pools of CRISPR-modified immortalized brown preadipocytes differentiated for 5 days). Western blot analysis with a previously unvalidated commercial antibody targeting the C-terminus of CLSTN3 (shared with CLSTN3β) identifies two specific bands in brown adipocytes. b, Membrane preparations of Pre-BAT cells (day 5 of differentiation) and HeLa cells transfected with Clstn3b transcript variant 2 or 3 (only variants with protein-coding potential). Western blot analysis with the CLSTN3 antibody shows that Clstn3b transcript variant 2 produces two bands of the same size as those expressed endogenously in brown adipocytes. c, Membrane preparations of three different Pre-BAT CRISPR pools: control, 3′ (gRNA targeting 3′ end of variant 2, downstream of all possible start codons), and 5′ (gRNA targeting 5′ end of variant 2, downstream of start codon generating longest ORF). Scissors mark positions of gRNAs and black arrows mark possible start codons immediately upstream of gRNAs. Western blot analysis with the CLSTN3 antibody shows that the ~25 kDa band is not a cleavage product of the ~40 kDa band and can be translated from variant 2 independently. d, Whole cell lysates of Pre-BAT cells (day 5 of differentiation) and HeLa cells transfected with Clstn3b transcript variant 2 containing ATG to AAG mutations at each possible start codon (positions marked by arrows). Western blot analysis with the CLSTN3 antibody shows that the first possible start codon (generating shortest ORF) initiates translation of a ~25 kDa protein product. e, Immunoprecipitation (IP) of the endogenous ~25 kDa protein from control (C) and 3′ gRNA (KO) Pre-BAT CRISPR pools (day 5 of differentiation) using the CLSTN3 antibody. f, Fragmentation spectrum of a CLSTN3β-specific peptide identified by IP-MS/MS. g, qPCR analysis of Clstn3 exons 1/2, Clstn3 exons 17/18, and Clstn3b expression in a panel of 15 mouse tissues (n = 5). h, (Left) Clstn3b expression in BAT of mice housed at 30 °C for 2 weeks, 22 °C, or 4 °C for 24 h (n = 4, 5, 5). (Right) Clstn3b expression in iWAT of mice housed at 30 °C for 2 weeks, 22 °C, or 4 °C for 48 h (n = 4, 5, 5). i, Clstn3b expression in BAT, iWAT, and eWAT of mice injected with PBS or 1 mg/kg/day CL-316,243 (CL) for 4 days (n = 4). j, Fold induction of Clstn3 exons 17/18 expression from day 0 to day 5 of differentiation in white and brown preadipocyte cell lines (n = 3). 3T3-L1, (C3H/)10T1/2, and (3T3-)F442A refer to three commonly-used white preadipocyte cell lines. Pre-BAT 1, 2, and 3 refer to three distinct single cell clones isolated from a pool of immortalized primary mouse brown preadipocytes. k, Clstn3b expression in eWAT of mice fed normal chow or a 60% high-fat diet (HFD) for 4 days (n = 5, 4). l, Clstn3b expression in eWAT of mice gavaged with vehicle, GW7647 (PPARα agonist, 10 mg/kg), or rosiglitazone (PPARγ agonist, 10 mg/kg) 3 times in 2 days (n = 8). m, ChIP-qPCR analysis of PPARγ binding to Fabp4, Clstn3b, and Clstn3 promoter elements in 10T1/2 cells (n = 3). n, PPARγ ChIP-seq reads at the Clstn3 locus in primary mouse BAT, iWAT, and eWAT adipocytes and 3T3-L1 cells. Genomic regions targeted in ChIP-qPCR experiment (m) are annotated. Bar plots show mean ± SEM. Each point represents a biological replicate. Two-sided **P < 0.01, ***P < 0.001 by ordinary one-way ANOVA with Dunnett’s multiple comparisons test (h, l), multiple t-tests with Holm-Sidak correction (i, m), or Welch’s t-test (k).
Extended Data Fig. 3 ∣
Extended Data Fig. 3 ∣. Structural features of CLSTN3β.
a, Electron microscopy of immortalized brown adipocytes (day 4 of differentiation) stably expressing (left) no APEX2 or (right) an N-terminal APEX2-CLSTN3β fusion. APEX2-CLSTN3β is poorly expressed and thus its localization is not visualized. b, Biochemical extraction of CLSTN3β-Flag (integral membrane protein) and S6 (peripheral membrane protein) from membranes of HEK293T cells treated with OA (250 μM, overnight). P = pellet, S = supernatant. c, Protease protection assay on membranes from HEK293T cells transfected with CLSTN3β-Flag (C-terminal tag) and treated with OA (250 μM, overnight). Calreticulin = inside ER, S6 = outside ER. d, Helical wheel plots of representative α-helices from CLSTN3β, generated using HeliQuest. e, Summary of CLSTN3β secondary structure predictions. Putative hydrophobic hairpins and β-strand domain are underlined. Positively charged and hydrophobic residues in the β-strand domain are colored green and yellow, respectively. f, RoseTTAFold model of full-length CLSTN3β. (Left) Model positioned to highlight hairpin domain (red) and TM domain (green). (Right) Model positioned to highlight hairpin 1 (cyan), hairpin 2 (magenta), hairpin 3 (yellow), and TM domain (green). g, Schematic of CLSTN3β hairpin mutants. h, Confocal microscopy of OA-treated (1 mM, overnight) HeLa cells transfected with ΔH1, ΔH2, ΔH3, ΔH12, ΔH13, or ΔH23 CLSTN3β-Flag constructs and stained with BODIPY 488 or LipidTOX 647. Scale bar = 5 μm.
Extended Data Fig. 4 ∣
Extended Data Fig. 4 ∣. ER-localized CLSTN3β is degraded by ERAD.
a, Venn diagram showing the number of proteins identified as potential CLSTN3β binding partners by APEX proximity labeling (PL) and Flag immunoprecipitation (IP). b, (Left) Gene ontology (GO) analysis of the high-confidence CLSTN3β interactome (287 proteins). (Right) Partial list of ERAD proteins in the high-confidence CLSTN3β interactome. c, Immortalized brown adipocytes (day 6 of differentiation) were treated with cycloheximide (CHX, 100 μg/mL) for the indicated times and pretreated with either vehicle (DMSO) or CB-5083 (5 μM) for 30 min. d, Confocal microscopy of HeLa cells transfected with CLSTN3β-Flag and GFP-SEC61β and treated with either vehicle (DMSO) or CB-5083 (2.5 μM) for 8 h. Scale bar = 10 μm. e, CLSTN3β-Flag immunoprecipitation from HEK293T cells co-transfected with HA-ubiquitin and treated with either MG132 (25 μM) or CB-5083 (2.5 μM) for 4 h. f, CLSTN3β-Flag immunoprecipitation from HEK293T cells co-transfected with either HA-gp78 or myc-UBE2G2 and treated with CB-5083 (2.5 μM) for 4 h. g, HEK293T cells were co-transfected with CLSTN3β-Flag and either control or gp78 siRNA and treated with CHX (100 μg/mL) for the indicated times.
Extended Data Fig. 5 ∣
Extended Data Fig. 5 ∣. Analysis of thermogenesis in CLSTN3β-deficient mice.
a, (Top) Schematic of CRISPR strategy used to generate CLSTN3β KO mice. Scissors mark position of gRNA. (Middle) CRISP-ID analysis of Sanger sequencing trace from CLSTN3β KO founder. PAM sequence is underlined in red. (Bottom) Nucleotide sequences of WT and CLSTN3β KO alleles. Bases altered in KO allele are highlighted in red and premature stop codon is underlined. b, Western blot analysis of membrane preparations of brain and BAT from WT and CLSTN3β KO mice housed at 22 °C. c, Schematic of Cre-Lox strategy used to generate AdC3KO mice. d, qPCR analysis of Clstn3 exons 17/18 expression in (left) brain from WT and AdC3KO mice housed at 22 °C (n = 4, 4) and (right) BAT and iWAT from WT and AdC3KO mice housed at 4 °C for 4 days (n = 8, 6). e, Body weights and compositions of 10-12 week-old male WT and AdC3KO mice on a normal chow diet (n = 18, 22). f, Core body temperatures, g, BAT TAG content, and h, diameters of largest LDs (n = 40, 40) in i, H&E sections of BAT from 10-11 week-old male WT and AdC3KO mice housed at 4 °C for 4 days (n = 8, 6). Scale bar = 50 μm. j, qPCR analysis of BAT and iWAT from 10-11 week-old male WT and AdC3KO mice housed at 4 °C for 4 days (n = 8, 6). k, qPCR analysis and l, H&E sections of BAT and iWAT from 12-14 week-old male WT and AdC3KO mice fed a 10% kcal fat diet containing 50 mg/kg rosiglitazone for 2 weeks (n = 4, 5). Scale bar = 50 μm. Bar plots show mean ± SEM. Each point represents a biological replicate. Violin plots show median (dashed) and quartiles (dotted). Two-sided *P < 0.05, **P < 0.01, ***P < 0.001 by multiple t-tests with Holm-Sidak correction (d,j-k) or Welch’s t-test (g-h).
Extended Data Fig. 6 ∣
Extended Data Fig. 6 ∣. Analysis of lipolysis in CLSTN3β-deficient mice.
(a-b), Western blot analysis of BAT LDs and post-nuclear supernatants (PNS) isolated from female WT and AdC3KO mice housed at 22 °C or 4 °C for 24 h (n = 2 mice per lane). Equal amounts of TAG from each condition were loaded onto the gels. From the same experiment as Fig. 5I. c, Ex vivo lipolysis assay performed on iWAT from 11-12 week-old female WT and AdC3KO mice (n = 5, 5). NT = no treatment, ISO = isoproterenol (2 μM). Bar plots show mean ± SEM. Each point represents a biological replicate.
Extended Data Fig. 7 ∣
Extended Data Fig. 7 ∣. Characterization of CLSTN3β-deficient mice on a HFD.
a, Body weights and compositions of male and female WT/AdC3KO and WT/CLSTN3β KO mice on 45% and 60% HFD. Male WT/AdC3KO 45% HFD (n = 7, 8), male WT/AdC3KO 60% HFD (n = 6, 13), female WT/AdC3KO 45% HFD (n = 11, 7), female WT/AdC3KO 60% HFD (n = 11, 8), male WT/CLSTN3β KO 45% HFD (n = 13, 11), male WT/CLSTN3β KO 60% HFD (n = 15, 9), female WT/CLSTN3β KO 45% HFD (n = 13, 8), female WT/CLSTN3β KO 60% HFD (n = 15, 10). b, BAT weights from (left) male WT and AdC3KO mice on a 45% HFD for 10 weeks (n = 7, 7) or (right) male WT and CLSTN3β KO mice on a 45% HFD for 12 weeks (n = 13, 11). c, iWAT, eWAT, and liver weights from (left) male WT and AdC3KO mice on a 45% HFD for 10 weeks (n = 7, 8) or (right) male WT and CLSTN3β KO mice on a 45% HFD for 12 weeks (n = 13, 11). d, Intraperitoneal glucose tolerance test performed on male WT and CLSTN3β KO mice on a 45% HFD for 12 weeks (n = 6, 6). e, Oxygen consumption (VO2) in 10-12 week-old male WT and AdC3KO mice housed at 22 °C and fed a normal chow diet (n = 18, 22). Bar/line plots show mean ± SEM. Each point represents a biological replicate. Two-sided *P < 0.05 by Welch’s t-test (b) or ANOVA (e).
Extended Data Fig. 8 ∣
Extended Data Fig. 8 ∣. Analysis of adipose innervation and adrenergic signaling in CLSTN3β-deficient mice.
(a—c) Representative slices and maximum intensity projections (MIPs) of whole BAT lobe tyrosine hydroxylase (TH) immunostaining. Scale bar = 100 μm. a, 4% paraformaldehyde (PFA) vs. 3% glyoxal fixation. b, 11-12 week-old male WT and AdC3KO mice housed at 22 °C. c, 5–6 week-old male control and ob/ob mice housed at 22 °C. ob/ob samples were imaged at the same laser power as control samples as well as at maximum laser power. Control vs. ob/ob comparison was performed as a positive control for differences in BAT TH immunostaining. d, Quantification of TH staining in WT vs. AdC3KO (n = 4, 4) and control vs. ob/ob (n = 3, 3) mice. (Left) One value reported per mouse, (right) one value reported per sub-volume (60 subvolumes per mouse). Western blot analysis of e, BAT from 11 week-old male WT and AdC3KO mice housed at 22 °C, f, BAT from 17-18 week-old male WT and CLSTN3β KO mice housed at 22 °C, g, BAT from 10-11 week-old male WT and AdC3KO mice housed at 4 °C for 4 days, h, iWAT from 10-11 week-old male WT and AdC3KO mice housed at 4 °C for 4 days, and i, BAT from 17-18 week-old male WT and CLSTN3β KO mice housed at 22 °C. j, Western blot analysis of conditioned media (CM) and whole cell lysates (WCL) from HEK293T cells transfected/treated with the indicated constructs/compounds. FSK = forskolin (5 μM). *These β-Actin blots are the same. Extended Data Fig. 8F, I are from the same experiment but were split up for presentation purposes. Bar plots show mean ± SEM. Each point represents a biological replicate. Violin plots show median (dashed) and quartiles (dotted). Two-sided ***P < 0.001 by ordinary one-way ANOVA with Dunnett’s multiple comparisons test (d).
Extended Data Fig. 9 ∣
Extended Data Fig. 9 ∣. Characterization of cells and mice re-expressing CLSTN3β.
a, (Top) CRISP-ID analysis of Sanger sequencing trace from immortalized CLSTN3β KO brown preadipocyte clone. PAM sequence is underlined in red. CRISPR strategy is identical to that depicted in Extended Data Fig. 5A. (Bottom) Nucleotide sequences of WT and CLSTN3β KO alleles. Bases deleted in KO alleles are highlighted in red. b, Light microscopy of immortalized CLSTN3β KO brown adipocytes stably expressing (left) mCherry or (right) CLSTN3β-mCherry (day 5 of differentiation). Scale bar = 50 μm. c, (Left) Seahorse respirometry analysis of oxygen consumption rates (OCR) in immortalized CLSTN3β KO brown adipocytes stably expressing mCherry (mCh) or CLSTN3β-mCherry (C3β-mCh) (day 6 of differentiation) and treated with isoproterenol (ISO, 10 μM), oligomycin (oligo, 4 μM), FCCP (2 μM), and rotenone/myxothiazol (RM, 7.5 μM). Cells were pre-treated with atglistatin (ATGLi, 40 μM) for 30-45 min where indicated. (Right) FCCP-induced OCR normalized to protein content (n = 6). d, Western blot analysis of immortalized CLSTN3β KO brown adipocytes stably expressing mCh or C3β-mCh (day 6 of differentiation). e, Silver stain analysis of large (500 g), medium (8,000 g), and small (200,000 g) LDs isolated from immortalized CLSTN3β KO brown adipocytes stably expressing mCh or C3β-mCh (day 8 of differentiation). Equal amounts of TAG from each condition were loaded onto the gel. f, Same experiment as Fig. 4A-E. Western blot analysis of BAT. g, Same experiment as Fig. 4F. CLSTN3 immunohistochemistry (IHC) of asWAT and BAT. Scale bar = 50 μm. Bar/line plots show mean ± SEM. Each point represents a biological replicate. Two-sided *P < 0.05 by multiple t-tests with Holm-Sidak correction (c).
Extended Data Fig. 10 ∣
Extended Data Fig. 10 ∣. Conservation of CLSTN3B in humans.
a, Amino acid alignment of CLSTN3β from representative placental mammals. b, RNA-seq reads at the CLSTN3 locus in human cortex and adipose tissue. c, Microarray analysis of CLSTN3 expression in periadrenal adipose tissue from control patients, pheochromocytoma patients with unilocular fat (PheoUni), and pheochromocytoma patients with multilocular fat (PheoMulti) (n = 4). d, qPCR analysis of CLSTN3 exons 1/2, CLSTN3 exons 17/18, CLSTN3B, and UCP1 expression in human unilocular and multilocular adipose tissue (n = 26, 12). Unilocular group includes both control and PheoUni patients. e, RNAscope analysis of CLSTN3B expression in unilocular periadrenal adipose tissue from lean control, obese control, and pheochromocytoma (PheoUni) patients. Scale bar = 50 μm. f, Cloning of human CLSTN3B. g, Confocal microscopy of OA-treated (1 mM, overnight) HeLa cells transfected with human CLSTN3β-Flag and stained with LipidTOX 647. Scale bar = 5 μm. h, Amino acid alignment of mouse and human CLSTN3β (reference sequences). Putative hydrophobic hairpins, β-strand domain, and TM domain are colored red, blue, and purple, respectively. Underlined residues are altered in the patient from which human CLSTN3β was cloned for this study. Bar plots show mean ± SEM. Each point represents a biological replicate. Two-sided *P < 0.05, **P < 0.01, ***P < 0.001 by ordinary one-way ANOVA with Dunnett’s multiple comparisons test (c) or multiple t-tests with Holm-Sidak correction (d).
Extended Data Fig. 11 ∣
Extended Data Fig. 11 ∣. CLSTN3β associates with CIDE proteins and blocks LD fusion.
(a—d) Western blot analysis of CLSTN3β-Flag co-immunoprecipitation assays in transfected HEK293FT cells. a, CIDEC-HA, b, CIDEA-HA, CIDECα-HA, and CIDECβ-HA, c, RAB18-HA and CGI58-HA, d, HA-tagged CIDEC C-terminal region (CIDEC-C-HA). e, Co-localization of CLSTN3β-GFP and CIDEA-HA in transfected 3T3-L1 preadipocytes treated with OA. Scale bar = 5 μm. (f—h) Fluorescence recovery after photobleaching (FRAP)-based lipid exchange rate assay in transfected 3T3-L1 preadipocytes incubated with 200 μM OA and 1 μg/mL BODIPY 558/568 C12 fatty acid for 16 h. f, Calculated lipid exchange rates (n = 15, 14, 17 cells). Cells used for representative traces are highlighted in red. g, Representative mean optical intensity traces for one pair of LDs from each group. h, Representative images of FRAP-based lipid exchange rate assay. Yellow arrows point to bleached LDs. Bar plots show mean ± SEM. Each point represents a biological replicate. Two-sided ***P < 0.001 by ordinary one-way ANOVA with Tukey’s multiple comparisons test (f).
Extended Data Fig. 12 ∣
Extended Data Fig. 12 ∣. CLSTN3β associates with CIDE proteins and blocks LD fusion.
a, Confocal microscopy of HeLa cells stably expressing CIDEC and transiently expressing either GFP or CLSTN3β-GFP. Cells were treated with OA and LDs were stained with BODIPY 665. Scale bar = 5 μm. b, Confocal microscopy of immortalized CLSTN3β KO brown adipocytes stably expressing mCherry or CLSTN3β-mCherry and CIDEC-v5 (day 5 of differentiation). Cells were stained with BODIPY 488, DAPI, and anti-v5, and mCherry signal was amplified with anti-mCherry Alexa Fluor 594. Scale bar = 5 μm. c, (Top) Western blot analysis of BAT from male WT and AdC3KO mice housed at (left) 22 °C or (right) 4 °C for 4 days. (Bottom) Quantification of above Western blots. d, Representative images of FRAP-based phase separation assay. Yellow arrows point to bleached signal at LD–LD contact sites (LDCS). Scale bar = 2 μm. e, Quantification of FRAP-based phase separation assay (n = 22 cells). f, Percentage of cells with CIDEC condensates in the absence or presence of CLSTN3β (n = 3). Bar/line plots show mean ± SEM. Each point represents a biological replicate. Two-sided *P < 0.05, **P < 0.01 by Welch’s t-test (c).
Fig. 1 ∣
Fig. 1 ∣. CLSTN3β is an ER-resident protein that localizes to ER–LD contact sites.
a, Electron microscopy of immortalized brown preadipocytes stably expressing a CLSTN3β–APEX2 C-terminal fusion. Red and blue arrows point to ER tubules that are positive and negative for APEX2 product, respectively. From left to right are the untreated, treated with OA (1 mM, 2 h) and differentiated for 4 days. Scale bar, 0.5 μm (left panel); 100 nm (right four panels). b, Confocal microscopy of OA-treated 3T3-L1 preadipocytes and HeLa cells transfected with CLSTN3β-GFP and stained with BODIPY 665. Scale bar, 5 μm. c, Confocal microscopy of HeLa cells transfected with CLSTN3β-Flag and GFP-SEC61β and stained with LipidTOX 647. Cells were treated with lipoprotein-deficient serum (LPDS, 1%, overnight) (top) or OA (1 mM, overnight) (bottom). Scale bar, 5 μm. d, Western blot analysis of subcellular fractions from immortalized brown preadipocytes differentiated for 8 days. Similar amounts of protein from each fraction were loaded onto the gels (as estimated by silver stain). mito, mitochondria; cyto, cytoplasm; ERM, ER-enriched membranes; PNS, postnuclear supernatant. e, Schematic of full-length CLSTN3β and CLSTN3β mutants. TM, transmembrane domain; H1/H2/H3, hydrophobic hairpin 1/2/3; β, β-strand domain. f, Confocal microscopy of OA-treated (1 mM, overnight) HeLa cells transfected with full-length, 3β-specific or shared CLSTN3β-Flag constructs and stained with BODIPY 488 or LipidTOX 647. Scale bar, 5 μm. g, Confocal microscopy of OA-treated (1 mM, overnight) HeLa cells transfected with ΔH123 or Δβ CLSTN3β-Flag constructs and stained with BODIPY 488 or LipidTOX 647. Scale bar, 5 μm. h, Proposed CLSTN3β domain structure and mechanism of localization to ER–LD contact sites. Schematic created using BioRender (https://biorender.com)
Fig. 2 ∣
Fig. 2 ∣. Loss of CLSTN3β expression perturbs LD morphology and lipid utilization in BAT.
a, Gross appearance of BAT from 12-week-old male WT and AdC3KO mice housed at 22 °C. b, BAT triglyceride (TAG) content in 11–12-week-old male WT and AdC3KO mice (n = 5, 7) (left) and 17–18-week-old male WT and CLSTN3β KO mice (n = 7, 5) (right) housed at 22 °C. c,d, Diameters of largest LDs (n = 60, 60) (c) in H&E sections (d) of BAT from 11–12-week-old male WT and AdC3KO mice housed at 22 °C. Scale bar, 50 μm. e, Core body temperatures of 13–14-week-old male WT and AdC3KO mice (n = 12, 12) (left) and 12–13-week-old male WT and CLSTN3β KO mice (n = 10, 11) (right) during acute cold challenge. f, Heatmap of 100 most significantly changed genes in BAT during acute cold challenge. RNA sequencing was performed on BAT from 10-week-old male WT and AdC3KO mice (n = 3, 3, 4, 4). g, Respiratory exchange ratios (RER) of 10–12-week-old male WT and AdC3KO mice (n = 18, 22) (left) and 11–12-week-old male WT and CLSTN3β KO mice (n = 13, 11) (right) housed at 22 °C. h, Coronal and sagittal views of representative WT and AdC3KO mice undergoing 18F-fluorodeoxyglucose (18F-FDG) PET–CT after 4 h of cold exposure. BAT depots are circled. i, 18F-FDG uptake (106 pCi per g of tissue) in BAT (left) and iWAT, epididymal WAT (eWAT), liver and quad (right) from 12–16-week-old male WT and AdC3KO mice housed at 4 °C for 4 h (n = 9, 9). Bar and line plots show mean ± s.e.m. Each point represents a biological replicate. Violin plots show median (dashed) and quartiles (dotted). Two-sided *P < 0.05, **P < 0.01, ***P < 0.001 by Welch’s t-test (b,c,i), two-way repeated measures analysis of variance (ANOVA) with Sidak’s multiple comparisons test (e) or ANOVA (g).
Fig. 3 ∣
Fig. 3 ∣. Forced expression of CLSTN3β promotes multilocularity and lipid utilization in adipocytes.
a, Left, confocal microscopy of immortalized CLSTN3β KO brown adipocytes stably expressing mCherry (left) or CLSTN3β-mCherry (right) (day 5 of differentiation). Cells were stained with BODIPY 488 and DAPI, and mCherry signal was amplified with anti-mCherry Alexa Fluor 594. Right, cells with high CLSTN3β expression had the smallest LDs (large arrow), those with medium CLSTN3β expression had larger LDs (medium arrow) and those with low CLSTN3β expression had the largest LDs (small arrow). Scale bar, 10 μm. b, Frequency distribution of LD number (top) and mean LD size per cell in a (bottom). 272 and 244 cells were analysed for mCherry (mCh) and CLSTN3β-mCherry (C3β-mCh), respectively. c, Confocal microscopy of WT and AdC3KO primary brown adipocytes (day 6 of differentiation) (left) and AdC3KO primary brown adipocytes transduced with mCh or C3β-mCh lentivirus (day 4 of differentiation) (right). Cells were stained with BODIPY 488 and DAPI. Scale bar, 10 μm. d, Left, Seahorse respirometry analysis of oxygen consumption rate (OCR) in immortalized CLSTN3β KO brown adipocytes stably expressing mCh or C3β-mCh (day 6 of differentiation) and treated with isoproterenol (ISO, 10 μM), oligomycin (oligo, 4 μM), FCCP (2 μM) and rotenone/myxothiazol (RM, 7.5 μM). Cells were pretreated with etomoxir (Eto, 10 μM) for 30–45 min where indicated. Right, FCCP-induced OCR normalized to protein content (n = 6). e,f, Fluorescence microscopy (e) and western blot analysis (f) of large (500g), medium (8,000g) and/or small (200,000g) LDs isolated from immortalized CLSTN3β KO brown adipocytes stably expressing mCh or C3β-mCh (day 8 of differentiation). Equal amounts of TAG from each condition were loaded onto the gels. Bar/line plots show mean ± s.e.m. Each point represents a biological replicate. Two-sided **P < 0.01 by multiple t-tests with Holm–Sidak correction (d).
Fig. 4 ∣
Fig. 4 ∣. CLSTN3β expression is associated with multilocular adipose tissue in mice and humans.
ae, 10–14-week-old female AdC3KO mice were administered AAV8-FLEX-GFP or AAV8-FLEX-CLSTN3β-Flag (n = 5, 6) through the tail vein to express GFP or CLSTN3β-Flag specifically in adipocytes. Mice were housed at 4 °C for 4 days to minimize initial LD size, then housed at 30 °C for 11 days to promote LD expansion. a, Top, schematic of experiment. Bottom, H&E sections of BAT. Scale bar, 50 μm. b, Expression of AAV-encoded genes in BAT. c, Diameters of largest LDs in BAT (n = 100, 120). d, BAT TAG content. e, BAT thermogenic gene expression. f, 13–15-week-old male AdC3KO mice were administered AAV8-FLEX-GFP or AAV8-FLEX-CLSTN3β-Flag subcutaneously to express GFP or CLSTN3β-Flag specifically in adipocytes. Mice were housed at 4 °C for 8 days to induce beiging, then housed at 30 °C for 12 days to promote LD expansion. Top, schematic of experiment. Bottom, H&E sections of anterior subcutaneous WAT (asWAT). Scale bar, 50 μm. g, RNAscope analysis of CLSTN3B expression in multilocular periadrenal adipose tissue from patients with pheochromocytoma. Red arrows point to nuclei with positive staining in multilocular adipocytes. Blue arrows point to nuclei with negative staining in unilocular adipocytes. Scale bars, left 50 μm and right 20 μm. Bar plots show mean ± s.e.m. Each point represents a biological replicate. Violin plots show median (dashed) and quartiles (dotted). Two-sided *P < 0.05, **P < 0.01, ***P < 0.001 by Welch’s t-test (bd). Schematics in a and f created using BioRender (https://biorender.com).
Fig. 5 ∣
Fig. 5 ∣. CLSTN3β associates with CIDE proteins and blocks LD fusion.
a, Actual, number of proteins in the high-confidence CLSTN3β interactome with annotated LD, ER and neither localization in UniProt. Expected, number of proteins in a random sample of equal size from the UniProt mouse proteome with annotated LD, ER and neither localization. b, CLSTN3β-Flag and CIDEA-HA co-immunoprecipitation assay in transfected HEK293FT cells. c, CLSTN3β-Flag and HA-tagged CIDEA C-terminal region (CIDEA-C-HA) (left) or HA-tagged CIDEA N-terminal region (CIDEA-N-HA) (right) co-immunoprecipitation assay in transfected HEK293FT cells. d, Colocalization of CLSTN3β-GFP and CIDEA-HA in transfected HeLa cells treated with OA. Scale bar, 5 μm. eg, FRAP-based lipid exchange rate assay in transfected 3T3-L1 preadipocytes incubated with 200 μM OA and 1 μg ml−1 BODIPY 558/568 C12 fatty acid for 16 h. e, Representative images of FRAP-based lipid exchange rate assay. Yellow arrows point to bleached LDs. f, Representative mean optical intensity traces for one pair of LDs from each group. g, Calculated lipid exchange rates (n = 15, 10, 14 cells). Cells used for representative traces are highlighted in red. h, Confocal microscopy of immortalized CLSTN3β KO brown adipocytes stably expressing mCherry or CLSTN3β-mCherry and CIDEA-v5 (day 5 of differentiation). Cells were stained with BODIPY 488, DAPI and anti-v5, and mCherry signal was amplified with anti-mCherry Alexa Fluor 594. Scale bar, 5 μm. i, BAT LDs isolated from female WT and AdC3KO mice housed at 22 or 4 °C for 24 h (n = 2 mice per lane). Equal amounts of TAG from each condition were loaded onto the gels. From the same experiment as Extended Data Fig. 6a,b. Bar plots show mean ± s.e.m. Each point represents a biological replicate. Two-sided *P < 0.001 by Fisher’s exact test (a), ***P < 0.001 by ordinary one-way ANOVA with Tukey’s multiple comparisons test (g).

Comment in

  • Keeping brown fat brown.
    Baek AE. Baek AE. Sci Signal. 2022 Dec 20;15(765):eadg3025. doi: 10.1126/scisignal.adg3025. Epub 2022 Dec 20. Sci Signal. 2022. PMID: 36538591

References

    1. Wang W & Seale P Control of brown and beige fat development. Nat. Rev. Mol. Cell Biol 17, 691–702 (2016). - PMC - PubMed
    1. Cohen P & Kajimura S The cellular and functional complexity of thermogenic fat. Nat. Rev. Mol. Cell Biol 22, 393–409 (2021). - PMC - PubMed
    1. Trayhurn P Brown adipose tissue—a therapeutic target in obesity? Front. Physiol 9, 1672 (2018). - PMC - PubMed
    1. Cannon B & Nedergaard J Brown adipose tissue: function and physiological significance. Physiol. Rev 84, 277–359 (2004). - PubMed
    1. Rasmussen AT The so-called hibernating gland. J. Morphol 38, 147–205 (1923).

Publication types

MeSH terms