. 2022 Dec;612(7940):546-554.
doi: 10.1038/s41586-022-05499-y. Epub 2022 Dec 7.

A plant-derived natural photosynthetic system for improving cell anabolism

Affiliations

A plant-derived natural photosynthetic system for improving cell anabolism

Pengfei Chen et al. Nature. 2022 Dec.

Abstract

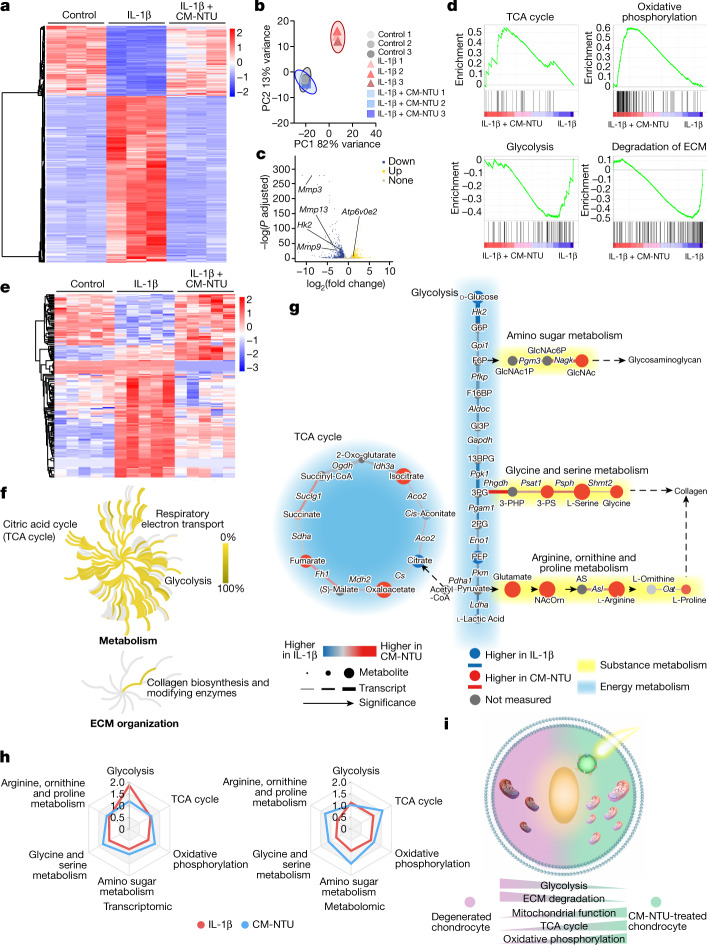
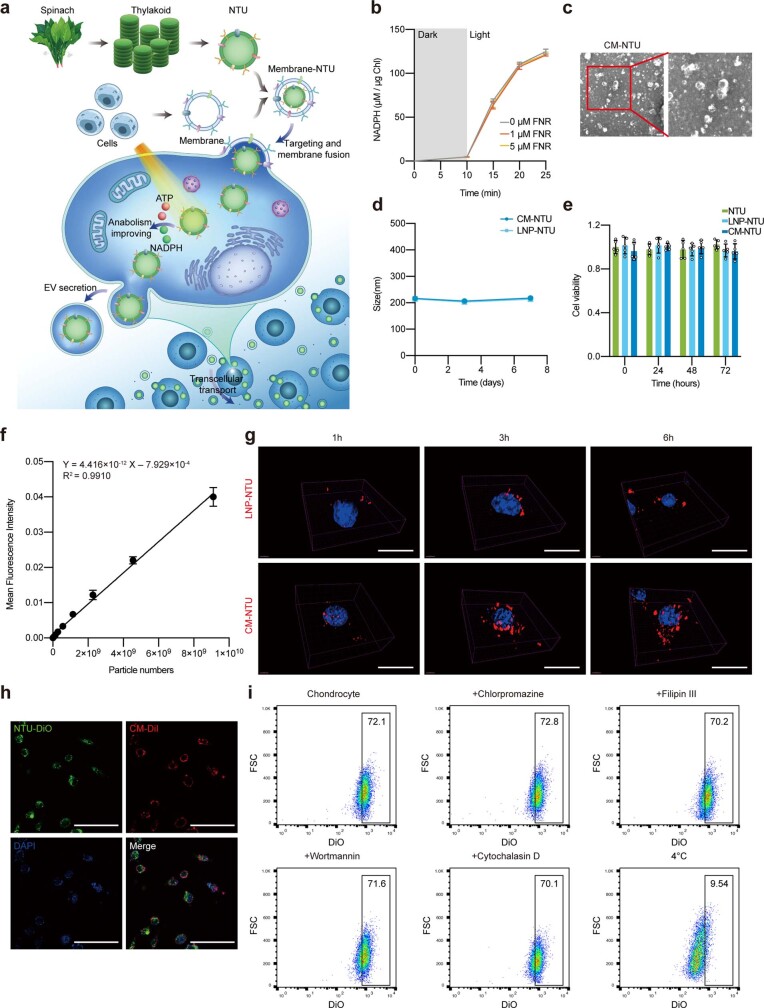
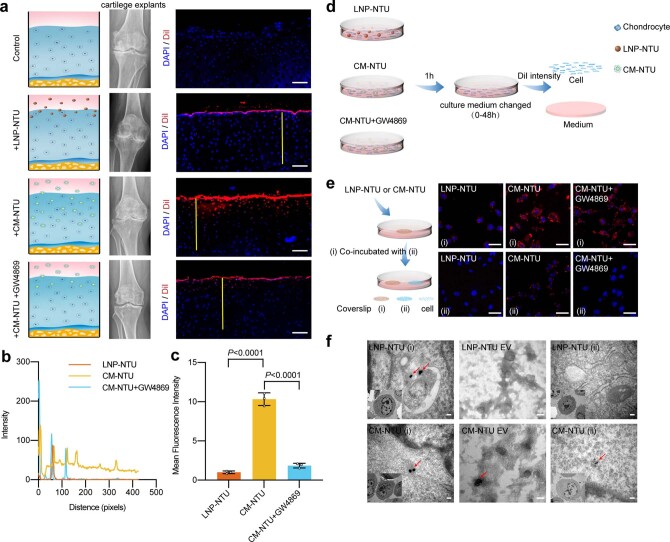
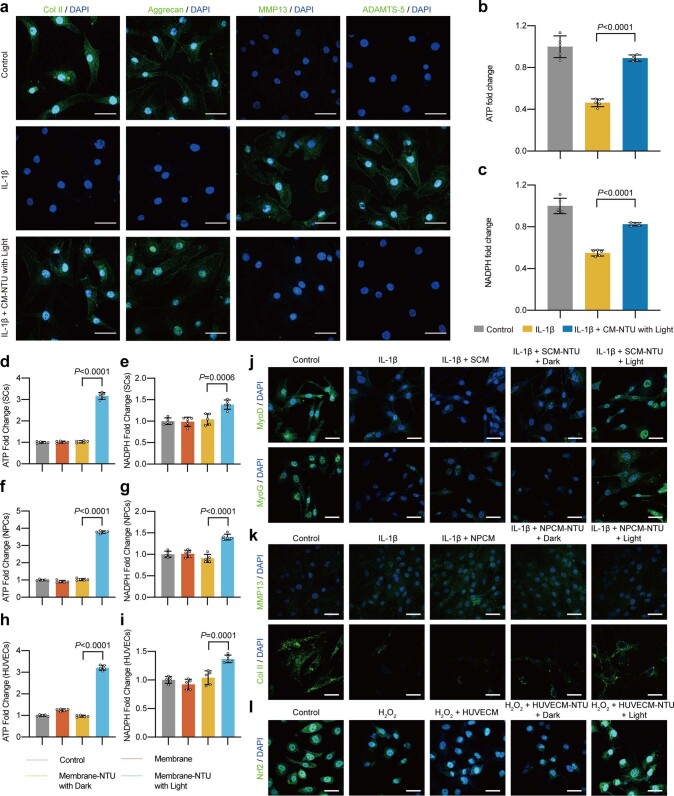
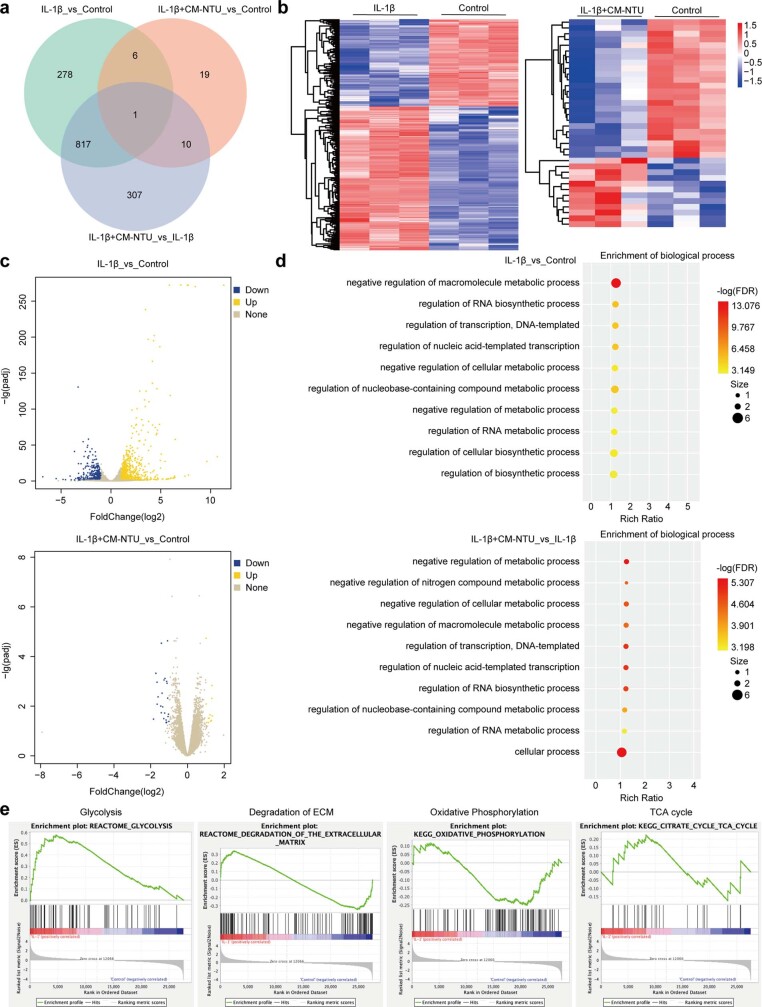
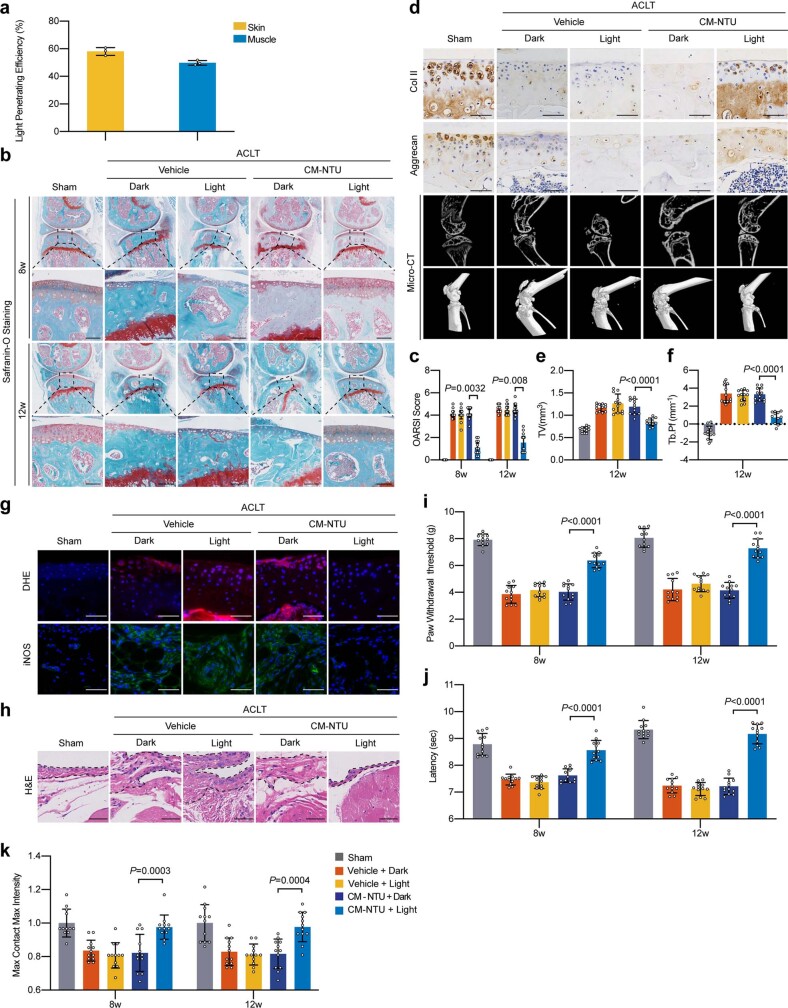
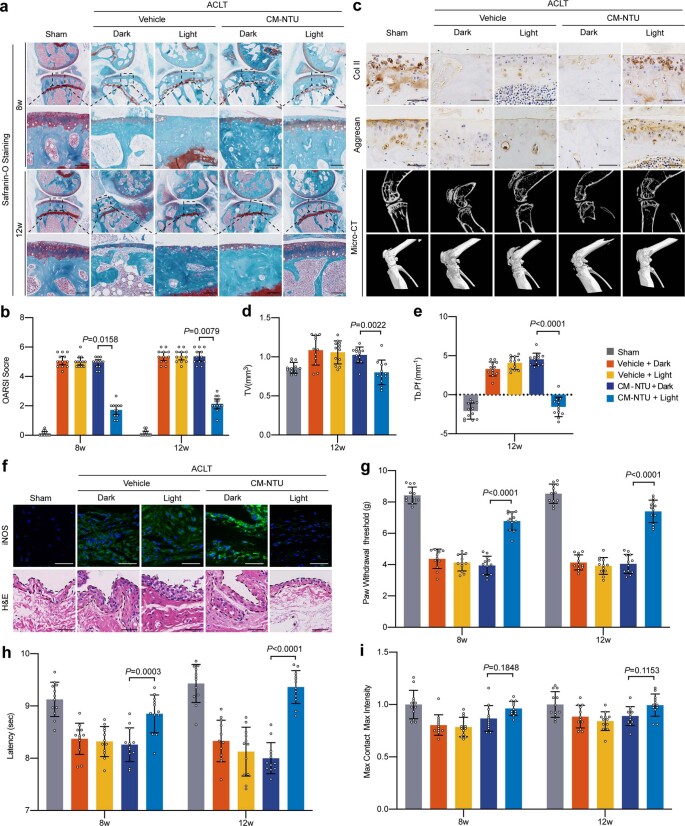
Insufficient intracellular anabolism is a crucial factor involved in many pathological processes in the body1,2. The anabolism of intracellular substances requires the consumption of sufficient intracellular energy and the production of reducing equivalents. ATP acts as an 'energy currency' for biological processes in cells3,4, and the reduced form of NADPH is a key electron donor that provides reducing power for anabolism5. Under pathological conditions, it is difficult to correct impaired anabolism and to increase insufficient levels of ATP and NADPH to optimum concentrations1,4,6-8. Here we develop an independent and controllable nanosized plant-derived photosynthetic system based on nanothylakoid units (NTUs). To enable cross-species applications, we use a specific mature cell membrane (the chondrocyte membrane (CM)) for camouflage encapsulation. As proof of concept, we demonstrate that these CM-NTUs enter chondrocytes through membrane fusion, avoid lysosome degradation and achieve rapid penetration. Moreover, the CM-NTUs increase intracellular ATP and NADPH levels in situ following exposure to light and improve anabolism in degenerated chondrocytes. They can also systemically correct energy imbalance and restore cellular metabolism to improve cartilage homeostasis and protect against pathological progression of osteoarthritis. Our therapeutic strategy for degenerative diseases is based on a natural photosynthetic system that can controllably enhance cell anabolism by independently providing key energy and metabolic carriers. This study also provides an enhanced understanding of the preparation and application of bioorganisms and composite biomaterials for the treatment of disease.


Conflict of interest statement

P.C., X. Lin and C.G. are inventors on patents and patent applications that include NTUs (application numbers CN202211004654.2, CN202211004743.7 and CN202211004719.3; organization applicant, Zhejiang University). The other authors declare no competing interests.

Figures

Fig. 1
Fig. 1. Preparation and characterization of CM-NTUs.
a, Diameters of thylakoid (TK) organelles and NTUs. b, Cryo-TEM images of thylakoid organelles and NTUs. c, Schematic illustration of photosynthesis light reaction-associated proteins and the photosynthetic electron transport chain in NTUs. FD, ferredoxin; PC, plastocyanin; PSI, photosystem I; PSII, photosystem II; PQ, plastoquinone. d, Proteomics analysis of NTUs. The identified proteins were classified according to their cellular components and biological processes and analysed using protein analysis through evolutionary relationships (PANTHER) overrepresentation test with Fisher’s exact test for significance. e, ATP and NADPH production capacity of NTUs in vitro (n = 3, mean ± s.d.). f, Immunodetection of D1 and D2 abundance in NTUs under light illumination for 0–32 h (80 µmol photons m−2 s−1) or darkness for 0–7 days (at room temperature). Uncropped gel is in Supplementary Fig. 1a. Similar results were obtained from three biologically independent samples. g,h, ATP production of NTUs was measured under light illumination (g) for 0–32 h (80 µmol photons m−2 s−1) or in the dark (h) for 0–7 days (at room temperature) (n = 3, mean ± s.d.). i, Proteomics analysis of CM. The identified proteins were classified according to their cellular components. j, Content and categories of proteins in the CM involved in vesicle targeting and membrane fusion. k, Western blot analysis of Na+/K+-ATPase and β-tubulin in CM and cytoplasm. Na+/K+-ATPase was significantly enriched, and β-tubulin was present at low levels on the CM. Uncropped gel is in Supplementary Fig. 1b. l, Diameters of NTUs, CM, LNP-NTUs and CM-NTUs. m, Zeta potential of NTUs, CM, LNP-NTUs and CM-NTUs (n = 3, mean ± s.d.). n, Cryo-TEM images of LNPs, LNP-NTUs, CM and CM-NTUs. n represents the number of biologically independent samples. P values are indicated on the graph and were determined using two-tailed t-test (e). Scale bars, 50 nm (n) or 100 nm (b). Source data
Fig. 2
Fig. 2. Cell membrane fusion and intracellular release process of CM-NTUs.
a, Uptake of NTUs, LNP-NTUs and CM-NTUs (NTUs labelled with DiI) by RAW 264.7 macrophages (RAW) or chondrocytes. Nuclei, blue; NTUs, red. b, The fluorescence intensity of NTU, LNP-NTU and CM-NTU uptake by RAW 264.7 macrophages or chondrocytes (n = 3, mean ± s.d.). c, Fluorescent images indicating the interaction between DiO-labelled CM and DiI-labelled CM. Nuclei, blue; DiO-labelled CM, green; Dil-labelled CM, red. d, DiO-positive chondrocytes measured by flow cytometry after treatment with CM-NTUs (DiO-labelled NTUs). Chondrocytes were cooled to 4 °C or separately pretreated with endocytosis-related inhibitors at 37 °C. e, Ratio of DiO-positive chondrocytes (left) and mean fluorescence intensity (MFI) (right) of DiO (n = 3, mean ± s.d.). f, Flow cytometry analysis of five types of cultured cells after incubation with CM-NTUs (DiO-labelled NTUs). g, Ratio of DiO-positive cells (left) and MFI (right) of DiO in five cell types (n = 3, mean ± s.d.). h,i, Ratio of chondrocytes taking up five different coated NTUs and the corresponding MFI values in staining scheme 1 (h) and scheme 2 (i) (n = 5, mean ± s.d.). FM-NTU, NTUs coated with fibroblast membrane; MM-NTU, NTUs coated with macrophage membrane. j, Fluorescent visualization (left) of NTU localization in chondrocytes 6 h after incubation with LNP-NTUs or CM-NTUs (NTUs, red; nuclei, blue; lysosome, green) and intensity profiles (right) across the cell along the selected line (yellow line). k, Pearson’s correlation coefficients of the NTUs and lysosomes (n = 3, mean ± s.d.). l,m, Quantitative detection of DiI fluorescence intensity in chondrocytes (l) and culture medium (m) (n = 3, mean ± s.d.). n represents the number of biologically independent samples. P values are shown in graphs and were determined using one-way analysis of variance (ANOVA) (b,e,gi,l,m) or two-tailed t-test (k). Scale bars, 3 μm (c,j), 20 μm (a). Source data
Fig. 3
Fig. 3. CM-NTUs improve cell anabolism.
a, ATP levels of chondrocytes treated with CM-NTUs and red light irradiation (80 µmol photons m−2 s−1) for different time intervals (n = 5, mean ± s.d.). b, ATP levels of chondrocytes treated with CM-NTUs and red light irradiation for 30 min under different light intensities (n = 5, mean ± s.d.). c, NADPH levels of chondrocytes treated with CM-NTUs with different encapsulated ferredoxin (FDX) concentrations (n = 5, mean ± s.d.). d, Immunofluorescence staining (top) and quantification (bottom) of Col II, aggrecan, MMP13 and ADAMTS-5 levels in chondrocytes (n = 5, mean ± s.d.). Mouse chondrocytes were stimulated with IL-1β for 24 h followed by CM or CM-NTU treatment for 6 h with or without red light irradiation (80 µmol photons m−2 s−1, 30 min). e, PCR with reverse transcription detection of Col2a1, Acan, Sox9, Mmp3, Mmp13 and Adamts5 expression in chondrocytes incubated with IL-1β, IL-1β and CM, or IL-1β and CM-NTUs in the dark or with IL-1β and CM-NTUs in the light (n = 5, mean ± s.d.). f, MitoSOX-Red and JC-1 staining (left) and quantification (right) of chondrocytes incubated with IL-1β, IL-1β and CM, or IL-1β and CM-NTUs in the dark or with IL-1β and CM-NTUs in the light (MitoSOX-Red, red; JC-1, red and green; n = 5, mean ± s.d.). g, Western blots of the mitochondrial biogenesis markers SIRT1, PGC1α, TFAM, NRF1 and NRF2. Chondrocytes were incubated with IL-1β or with IL-1β and CM-NTUs in the light. Uncropped gel is in Supplementary Fig. 1d. n represents the number of biologically independent samples. P values are indicated in graphs and were determined using one-way ANOVA (af). Scale bars, 10 μm (d,f). Source data
Fig. 4
Fig. 4. CM-NTUs promote cellular metabolic reprogramming.
a, Heatmap showing differentially expressed genes in chondrocytes. Chondrocytes were stimulated with IL-1β followed by CM-NTU treatment for 6 h with red light irradiation (80 µmol photons m−2 s−1, 30 min). Three biological replicates are shown. b, PCA of genes in chondrocytes after treatment with IL-1β or with IL-1β and CM-NTUs in the light. Three replicates are shown. c, Volcano plots were generated representing genes related to oxidative phosphorylation, glycolysis and ECM degradation between the IL-1β plus CM-NTU group and the IL-1β group. Compared with the IL-1β group, the IL-1β plus CM-NTU group showed upregulated expression of 351 genes and downregulated expression of 784 genes (P-adjusted value by Wald test in DESeq2). d, Gene set enrichment analysis was performed to compare the gene sets involved in the TCA cycle, oxidative phosphorylation, glycolysis and ECM degradation between the IL-1β plus CM-NTU group and the IL-1β group. e, Heatmap representation and cluster analysis of metabolites in chondrocytes treated with IL-1β or with IL-1β and CM-NTUs in the light. Five biological replicates are shown. f, The influence of CM-NTU treatment on pathways related to metabolism and ECM organization. Topological graphs of these pathways are shown. Metabolomics data were analysed using the Reactome database. g, Concordant metabolomics integrated with transcriptomics analysis of the IL-1β plus CM-NTU with light group versus the IL-1β group. Connecting lines represent transcriptional expression of enzymes, circular nodes represent metabolite abundance and increased width indicates greater significance. h, Radar plot illustrating the pathway enrichment score of glycolysis, the TCA cycle, oxidative phosphorylation, amino sugar metabolism, glycine and serine metabolism, and arginine, ornithine and proline metabolism in the IL-1β group and the IL-1β plus CM-NTU groups. i, Schematic diagram of CM-NTU-driven metabolic reprogramming in degenerated chondrocytes.
Fig. 5
Fig. 5. In vivo effect of CM-NTU treatment on osteoarthritis in mice.
The in vivo effect of CM-NTU treatment on osteoarthritis was investigated in 12-week-old male mice. a, Schematic illustration of establishment of the mouse model of osteoarthritis and the experimental design to evaluate the protective effects of CM-NTUs. DHE, dihydroethidium. b, Safranin-O staining of joint sections at 8 and 12 weeks. c, Medial tibial plateau joint score based on the OARSI scoring system (n = 12, mean ± 95% confidence interval (CI)). d, Immunohistochemical staining (Col II and aggrecan) of joint sections at 12 weeks (top two rows), sagittal views of micro-CT images of the knee joints (third row) and three-dimensional images of the knee joints at 12 weeks (bottom row). e,f, Twelve weeks after the operation, quantitative analysis of total tissue volume (TV) (e) and trabecular pattern factor (Tb.Pf) (f) in subchondral bone (n = 12, mean ± s.d.) in mice. g,h, ATP (g) and NADPH (h) levels in CM-NTU-treated joints at 12 weeks (n = 10, mean ± s.d.). i, ROS fluorescence and immunofluorescence of iNOS in CM-NTU-treated joints at 12 weeks. j, H&E staining of synovial membranes in CM-NTU-treated joints at 12 weeks. k,l, Electronic von Frey (k) and hotplate (l) pain assays in mice at 8 and 12 weeks after the ACLT operation (n = 12, mean ± s.d.). m, Schematic of gait analysis. RF, right front; RH, right hind; LF, left front; LH, left hind. n, Gait assessment scores for maximum contact maximum intensity (right hind limb) in mice 8 and 12 weeks after operation (n = 12, mean ± s.d.). n represents the number of mice per group. P values are shown in graphs and were determined using nonparametric Kruskal–Wallis test (c) or one-way ANOVA (eh,k,l,n). Scale bar, 50 μm (d,i,j) or 100 μm (b). Source data
Extended Data Fig. 1
Extended Data Fig. 1. Characterization of CM-NTUs.
(a) Schematic diagram of membrane-coated nanothylakoid units (CM-NTUs). (b) NADPH production ability of NTUs in vitro with different concentrations of external ferredoxin:NADP+ reductase (FNR) (n = 3, mean ± SD). (c) Morphology of CM-NTUs imaged by transmission electron microscopy (TEM) (scale bar, 200 nm). (d) Stability of CM-NTUs and LNP-NTUs over time in phosphate buffered saline (PBS) for 1 week (stored at 4 °C in the dark). (e) Cytotoxicity of NTUs, LNP-NTUs, or CM-NTUs towards chondrocytes (n = 5, mean ± SD). (f) Standard curve of DiI fluorescence intensity with respect to NTU particle numbers. Each data point represents the mean of three independent biological replicates. (g) The distribution of LNP-NTUs and CM-NTUs (NTUs labelled with DiI) in chondrocytes at 1, 3, and 6 h observed by structural illumination microscopy (SIM) (scale bar, 10 μm; nuclei, blue; NTUs, red). (h) Fluorescent images of CM-NTU (CM labelled with DiI and NTUs labelled with DiO) uptake by chondrocytes for 1 hour (scale bar, 30 μm; nuclei, blue; NTUs, green; CM, red). (i) DiO-positive chondrocytes assessed by flow cytometry after treatment with CM-NTUs (DiO-labelled NTUs) for 6 h. n represents the number of biologically independent samples. Source data
Extended Data Fig. 2
Extended Data Fig. 2. The quantitative selectivity with which cells take up NTUs.
(a) Gating strategies of five different cell types. Hoechst 33342+ DiI- DiD+ cells were defined as nucleus pulposus cells (NPCs). Hoechst 33342+ DiI+ DiD- cells were defined as chondrocytes. Hoechst 33342+ DiI- DiD- cells were defined as fibroblasts. Hoechst 33342- DiI+ DiD- cells were defined as muscle satellite cells (SCs). Hoechst 33342- DiI- DiD+ cells were defined as macrophages. The following results indicate the proportions of the five types of cells that took up CM-NTUs: 69.9% (chondrocytes), 0.9% (NPCs), 2.2% (fibroblasts), 8.8% (SCs), and 9.4% (macrophages). Based on the level of mean fluorescence intensity (MFI) and using 5.8 × 104 NTUs per chondrocyte as the standard, we estimated that the numbers of NTUs taken up by NPCs, fibroblasts, SCs, and macrophages were ~6.4 × 103, 8.6 × 103, 1.8 × 104, and 1.6 × 104 per cell, respectively. (b) Gating strategies of chondrocytes. Scheme #1 (left panel): Hoechst 33342+ DiO+ cells were defined as chondrocytes taking up CM-NTUs. Hoechst 33342+ DiI+ cells were defined as chondrocytes taking up NPC membrane-NTUs (NPCM-NTUs). Hoechst 33342+ DiD+ cells were defined as chondrocytes taking up macrophage membrane-NTUs (MM-NTUs). Scheme #2 (right panel): Hoechst 33342+ DiO+ cells were defined as chondrocytes taking up CM-NTUs. Hoechst 33342+ DiI+ cells were defined as chondrocytes taking up SC membrane-NTUs (SCM-NTUs). Hoechst 33342+ DiD+ cells were defined as chondrocytes taking up fibroblast membrane-NTUs (FM-NTUs). The results showed that chondrocytes took up the highest percentage of CM-NTUs, at 67.6% and 58.7% in the two experiments, respectively. The proportions of chondrocytes that took up the NPCM-NTUs, MM-NTUs, SCM-NTUs, and FM-NTUs were 3.2%, 1.0%, 9.9%, and 8.6%, respectively. Based on the MFI, we estimated the number of NPCM-NTUs, MM-NTUs, SCM-NTUs, and FM-NTUs taken up per chondrocyte was ~4.8 × 103, 2.9 × 103, 3.2 × 104, and 1.7 × 104, respectively.
Extended Data Fig. 3
Extended Data Fig. 3. Superior tissue penetration of the CM-NTUs.
(a) Degenerated tissues and organs often exhibit fibrosis and densification of the ECM. To deliver an intra-articular injected nanomedicine to the cytosol of chondrocytes in knee joints, researchers must overcome the biological barrier for deep penetration into the avascular and dense degenerated cartilage. Cartilage explants from OA patients were examined to assess the depth of CM-NTU or LNP-NTU (NTUs labelled with DiI) penetration after 24 h. For the inhibitor group, cartilage explants were pretreated with an extracellular vesicle (EV) secretion inhibitor for 24 h before CM-NTU incubation (scale bar, 100 μm; nuclei, blue; NTUs, red). (b) DiI fluorescence intensity profiles across the section along the selected line (indicated by a yellow line in the inset image of a). (c) Mean fluorescence intensity of cartilage sections (n = 3, mean ± SD). (d) Schematic diagram of the detection of DiI fluorescence intensity in chondrocytes and culture medium. (e) Intracellular transfer of CM-NTUs or LNP-NTUs (NTUs labelled with DiI) visualized by confocal microscopy (scale bar, 20 μm; NTUs, red; nuclei, blue). Chondrocytes on coverslips (i) were cultured in medium that contained CM-NTUs or LNP-NTUs for 6 h. A coverslip (i) was rinsed and imaged. Then, fresh culture medium was added along with a coverslip with fresh cells on the coverslip (ii) for 24 h. For the inhibitor group, chondrocytes were pretreated with an EV secretion inhibitor for 24 h. The DiI signal from the CM-NTUs was high in the cells on coverslips (ii), indicating that some of the NTUs taken up in the cells on coverslips (i) were transported into the medium and subsequently internalized by the cells on coverslips (ii). In contrast, the NTUs from the LNP-NTU-treated cells exhibited limited transportation to the cells on coverslips (ii). Moreover, pretreatment with GW4869 blocked the transcellular transmission effect of the CM-NTUs. (f) Intracellular transfer of CM-NTUs or LNP-NTUs (gold nanoparticles encapsulated into NTUs) visualized by transmission electron microscopy (TEM) (scale bar, 200 nm). The processing of chondrocytes on the coverslip is the same as that described in e. The EVs secreted by the chondrocytes on the coverslip (i) were collected separately for TEM observation. The cells stimulated by the CM-NTUs could secrete EVs containing gold nanoparticles, and gold nanoparticles could be observed in the cells on coverslips (ii). In contrast, no gold nanoparticles were observed in EVs secreted by the LNP-NTU-stimulated cells or the cells on coverslips (ii). n represents the number of human specimens. P values are indicated in the graph and were determined using one-way ANOVA (c). Source data
Extended Data Fig. 4
Extended Data Fig. 4. CM-NTUs regulate the metabolic homeostasis of chondrocytes.
(a, b) ATP (a) and NADPH (b) levels in mouse chondrocytes incubated with CM, CM-NTUs in the dark, CM-NTUs in the light, or CM-NTUs (stored at 4 °C for 1 week) in the light (n = 5 for ATP detection, n = 3 for NADPH detection, mean ± SD). The CM-NTUs with light exposure increased the intracellular ATP and NADPH levels of chondrocytes by 2.6- and 1.7-fold, respectively. Storage for 1 week did not affect the ability of the CM-NTUs to enhance intracellular ATP and NADPH production. (c,d) Changes in the levels of ATP (c) and NADPH (d) over time in illuminated and unilluminated cells incubated with CM-NTUs (n = 3, mean ± SD). In unilluminated cells, CM-NTUs do not alter cellular ATP levels in contrast to that noted in the cell-free system (where a small amount of ATP can be produced in the absence of light due to the membrane-bound adenylate kinase of thylakoids). This finding might be attributed to the multiple adenylate kinase isoenzymes (adenylate kinase 1–9) in mammalian cells, and because the intracellular reaction had already reached equilibrium before the addition of CM-NTUs. (e) Immunodetection of D1 and D2 abundance in chondrocytes treated with NTUs under light illumination for 0-32 h (at 37 °C, 80 µmol photons m−2 s−1) or in the dark for 0–7 days (at 37 °C). Both the D1 and D2 proteins in chondrocytes were completely degraded in 8–16 h under light illumination. Under dark conditions, both protein levels decreased gradually from 0 to 3 days and were almost undetectable at 5 days. For gel source data, see Supplementary Fig. 1c. Similar results were obtained from three biologically independent samples. (f,g) Stability of intracellular NTUs in light or dark conditions: Changes in the ability of NTUs to increase intracellular ATP under light illumination (f) for 0–32 h (at 37 °C, 80 µmol photons m−2 s−1) or in the dark (g) for 0-7 days (at 37 °C) (n = 3, mean ± SD). In the relatively stable period, NTUs taken up by chondrocytes were stable for at least 2 h under continuous light illumination (with an ATP increase rate of 17.7 ± 1.4 pmol min−1 per 105 cells at 2 h, ~93% compared to 0 h). In contrast, NTUs in chondrocytes kept in the dark for 24 h were stable. Upon restimulation with light, the ATP increase rate reached 17.5 ± 1.6 pmol min−1 per 105 cells (~97% compared to 0 days). After 2 h of light or 24 h of dark, the ability of NTUs to increase ATP entered the rapid decline period. After continuous light stimulation for 16 h or storage in the dark for 5 days, the NTUs almost completely lost their photosynthetic capacity to increase the ATP concentration in the cells. (h) Effect of CM-NTUs on the ROS levels of chondrocytes after light illumination with different intensities (8.9–320 µmol photons m−2 s−1) (n = 3, mean ± SD). The ratio of DCF-positive cells decreased from 5.9% (in normal chondrocytes) to 3.6% (in normal chondrocytes containing NTUs) under a light intensity of 80 µmol photons m−2 s−1. Even under a light intensity of 320 µmol photons m−2 s−1, the ratio of DCF-positive cells (6.3%) was not significantly increased compared with the baseline value. (i) Effect of CM-NTUs on the ROS levels of chondrocytes incubated with IL-1β. Chondrocytes containing NTUs were illuminated with different intensities (8.9–320 µmol photons m−2 s−1) (n = 3 for control, n = 4 for other samples, mean ± SD). In degenerative chondrocytes induced by IL-1β treatment, the ratio of DCF-positive cells increased to 48.9%. After the degenerative chondrocytes containing NTUs were treated with light illumination (80 µmol photons m−2 s−1), the ratio of DCF-positive cells decreased to 25.6%. Under a higher light intensity (320 µmol photons m−2 s−1), the ratio of DCF-positive cells (28.4%) remained significantly lower than that of IL-1β-treated cells. (j, k) Fluorescence image (j) and quantitative analysis (k) of the ATP/ADP ratio of cells after different treatments (scale bar, 10 μm; n = 10, mean ± SD). Chondrocytes were incubated with IL-1β or IL-1β + CM-NTUs in the light. The decrease in the cytoplasmic ATP/ADP ratio caused by IL-1β stimulation might be due to the enhanced glycolytic metabolism in inflammatory cells, and the site where ATP was regenerated shifted from mitochondria to the cytoplasm,. n represents the number of biologically independent samples. P values are indicated in graphs and were determined using one-way ANOVA (a, b, h, i, k). Source data
Extended Data Fig. 5
Extended Data Fig. 5. Various membrane-coated NTUs regulate intracellular metabolic homeostasis.
(a) Immunofluorescence staining of Col II, aggrecan, MMP13, and ADAMTS-5 in human chondrocytes (scale bar, 10 μm). Human chondrocytes were stimulated with IL-1β for 24 h followed by CM-NTU treatment for 6 h with red light irradiation (80 µmol photons m−2 s−1, 30 min). (b, c) ATP (b) and NADPH (c) levels in human chondrocytes incubated with IL-1β or IL-1β + CM-NTUs with light (n = 5, mean ± SD). CM-NTUs with light can increase intracellular ATP and NADPH levels close to control levels. (d–i) ATP (d, f, h) and NADPH (e, g, i) levels in muscle satellite cells (SCs), nucleus pulposus cells (NPCs), and HUVECs. SCs, NPCs, and HUVECs were incubated with the corresponding membrane-coated NTUs with or without light irradiation (n = 5, mean ± SD). ATP and NADPH concentrations after light exposure were increased 3.17–3.78 and 1.37–1.40 fold those of unirradiated ATP and NADPH, respectively. (j, k) Immunofluorescence staining of myogenic markers (MyoD and MyoG) in SCs (j) and ECM markers (Col II and MMP13) in NPCs (k) (scale bar, 10 μm). SCs or NPCs were stimulated with IL-1β for 24 h followed by corresponding membrane-coated NTU treatment for 6 h with red light irradiation. (l) Immunofluorescence staining of an antioxidant marker (Nrf2) in HUVECs (scale bar, 10 μm). HUVECs were stimulated with H2O2 for 24 h followed by HUVEC membrane-coated NTU treatment for 6 h with red light irradiation. n represents the number of biologically independent samples. P values are indicated in graphs and were determined using one-way ANOVA (b–i). Source data
Extended Data Fig. 6
Extended Data Fig. 6. Transcriptomics study of CM-NTU-treated chondrocytes.
(a) A total of 27,597 genes were identified, and 1,438 differentially expressed genes among the three groups were identified (absolute log2-fold changes ≥ 1 and P values < 0.05). Venn diagram for the differentially expressed genes detected in chondrocytes after treatment with IL-1β or IL-1β + CM-NTUs in the light. (b) Heatmap showing that there were fewer differentially expressed genes between the IL-1β + CM-NTU and control groups than between the IL-1β and control groups. (c) Volcano plots were generated representing differentially expressed genes between different groups (P adjusted value by Wald test in DESeq2). (d) GO enrichment analysis of differentially expressed genes between different groups. (e) GSEA was applied to compare the gene sets involved in glycolysis, ECM degradation, oxidative phosphorylation, and the TCA cycle between the IL-1β and control groups.
Extended Data Fig. 7
Extended Data Fig. 7. Metabolomics study of CM-NTU-treated chondrocytes.
(a) Principal component analysis of metabolites in chondrocytes after treatment with IL-1β or IL-1β + CM-NTUs with light. (b) Kyoto Encyclopedia of Genes and Genomes (KEGG) enrichment analysis of the pathways involved in the biological effect induced by IL-1β or IL-1β + CM-NTU treatment. P values were calculated using the hypergeometric tests. (c) The Reactome data model was used to establish the equivalence of differentially abundant metabolite-related reactions across multiple networks. The reaction map shows the reactions annotated in the Reactome. The reaction clusters of top-level processes are presented.
Extended Data Fig. 8
Extended Data Fig. 8. In vivo effect of CM-NTU treatment on osteoarthritis (OA) in 12-week-old female mice.
(a) Efficiency of red light penetrating the skin and muscle (n = 3, mean ± SD). It should be noted that in the future, when applying CM-NTUs to larger human joints, the efficiency with which light penetrates human skin can be calculated first, and then the light intensity can be increased accordingly to ensure that sufficient photons reach the joint cavity. (b) Safranin O staining of joint sections at 8 and 12 weeks (scale bar, 100 μm). (c) Medial tibial plateau joint score based on the OARSI scoring system (n = 12, mean ± 95% CI). (d) Immunohistochemical staining (Col II and aggrecan) of joint sections at 12 weeks (scale bar, 50 μm), sagittal views of μCT of the knee joints, and three-dimensional images of the knee joints at 12 weeks. (e, f) For mice at 12 weeks after operation, quantitative analysis of TV (e) and Tb.Pf (f) in subchondral bone (n = 12, mean ± SD). (g) ROS fluorescence and immunofluorescence of iNOS in CM-NTU-administered joints at 12 weeks (scale bar, 50 μm). (h) H&E staining of synovial membranes in CM-NTU-treated joints at 12 weeks (scale bar, 50 μm). (i, j) Electronic von Frey (i) and hot-plate (j) pain assays in mice at 8 and 12 weeks after the operation (n = 12, mean ± SD). (k) Gait assessment scores for maximum contact maximum intensity (right hind limb) in mice at 8 and 12 weeks after operation (n = 12, mean ± SD). n represents the number of mice per group. P values are indicated in graphs and were determined using the nonparametric Kruskal–Wallis test (c) or one-way ANOVA (e, f, i–k). Source data
Extended Data Fig. 9
Extended Data Fig. 9. In vivo effect of CM-NTU treatment on osteoarthritis (OA) in 12-month-old male mice.
(a) Safranin O staining of joint sections at 8 and 12 weeks (scale bar, 100 μm). (b) Medial tibial plateau joint score based on the OARSI scoring system (n = 12, mean ± 95% CI). (c) Immunohistochemical staining (Col II and aggrecan) of joint sections at 12 weeks (scale bar, 50 μm), sagittal views of μCT of the knee joints, and three-dimensional images of the knee joints at 12 weeks. (d, e) For mice at 12 weeks after operation, quantitative analysis of TV (d) and Tb.Pf (e) in subchondral bone (n = 12, mean ± SD). (f) Immunofluorescence of iNOS and H&E staining of synovial membranes in CM-NTU-administered joints at 12 weeks (scale bar, 50 μm). (g, h) Electronic von Frey (g) and hot-plate (h) pain assays in mice at 8 and 12 weeks after the operation (n = 12, mean ± SD). (i) Gait assessment scores for maximum contact maximum intensity (right hind limb) in mice at 8 and 12 weeks after operation (n = 12, mean ± SD). n represents the number of mice per group. P values are indicated in graphs and were determined using the nonparametric Kruskal–Wallis test (b) or one-way ANOVA (d, e, g–i). Source data
Extended Data Fig. 10
Extended Data Fig. 10. In vivo safety of CM-NTUs in 12-week-old male mice.
H&E staining of histological sections from major organs, including the heart, liver, spleen, lungs, and kidneys (scale bar, 200 μm; n = 12 mice per group). From H&E staining, we observed that the overall structure, integrity, and immune infiltrate levels in heart, liver, spleen, lung, and kidney tissues in the CM-NTU-administered mice were nearly identical to the those from the sham controls. Data are representative of two independent experiments.

Comment in

References

    1. Gaber T, Strehl C, Buttgereit F. Metabolic regulation of inflammation. Nat. Rev. Rheumatol. 2017;13:267–279. - PubMed
    1. Sahin E, Depinho RA. Linking functional decline of telomeres, mitochondria and stem cells during ageing. Nature. 2010;464:520–528. - PMC - PubMed
    1. van Gastel N, Carmeliet G. Metabolic regulation of skeletal cell fate and function in physiology and disease. Nat. Metab. 2021;3:11–20. - PubMed
    1. O'Neill LA, Kishton RJ, Rathmell J. A guide to immunometabolism for immunologists. Nat. Rev. Immunol. 2016;16:553–565. - PMC - PubMed
    1. Olenchock BA, Rathmell JC, Vander Heiden MG. Biochemical underpinnings of immune cell metabolic phenotypes. Immunity. 2017;46:703–713. - PMC - PubMed

Publication types