Clinical Trial
. 2023 Feb 16;29(4):754-763.
doi: 10.1158/1078-0432.CCR-22-1983.

Exposure-Response Analyses of Tremelimumab Monotherapy or in Combination with Durvalumab in Patients with Unresectable Hepatocellular Carcinoma

Affiliations
Clinical Trial

Exposure-Response Analyses of Tremelimumab Monotherapy or in Combination with Durvalumab in Patients with Unresectable Hepatocellular Carcinoma

Xuyang Song et al. Clin Cancer Res. .

Abstract

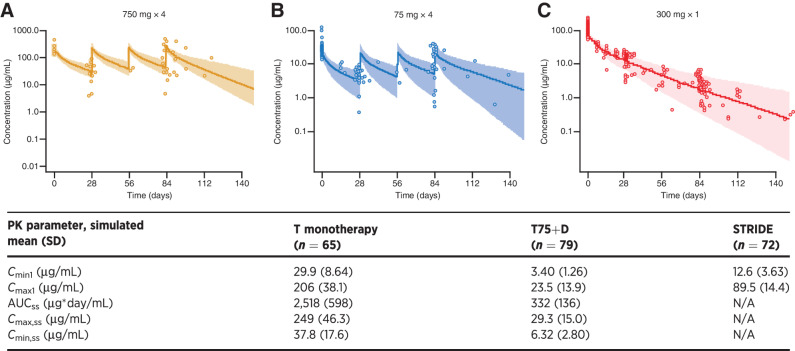
Purpose: A novel single-dose regimen of 300 mg tremelimumab in combination with durvalumab [Single Tremelimumab Regular Interval Durvalumab (STRIDE)] has demonstrated a favorable benefit-risk profile in the phase I/II Study 22 (NCT02519348) and phase III HIMALAYA study (NCT03298451). This study evaluated the pharmacokinetics, exposure-response, and exposure-pharmacodynamics relationships of tremelimumab in patients with unresectable hepatocellular carcinoma (uHCC).

Patients and methods: A previous tremelimumab population pharmacokinetic model was validated using data from parts 2 and 3 of Study 22. Exposure-response analyses explored relationships of tremelimumab exposure with efficacy and safety. Pharmacokinetics and pharmacodynamics relationships were evaluated using linear and nonlinear regression models.

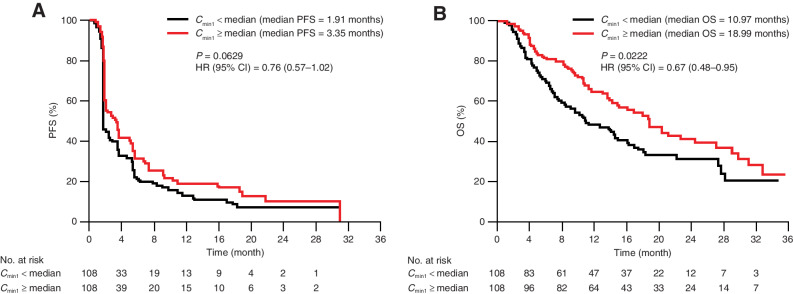
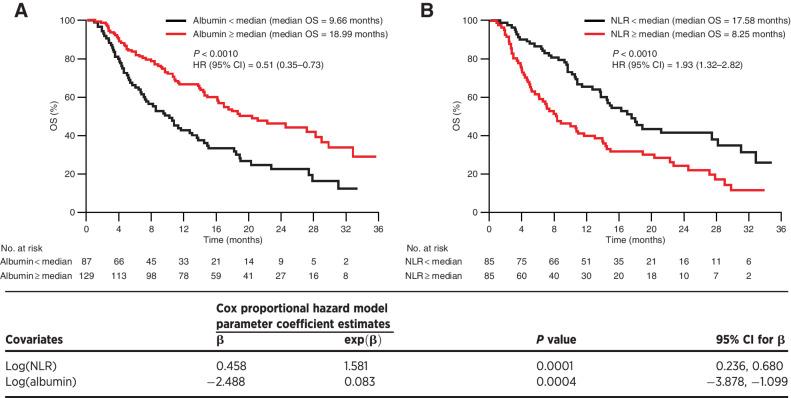
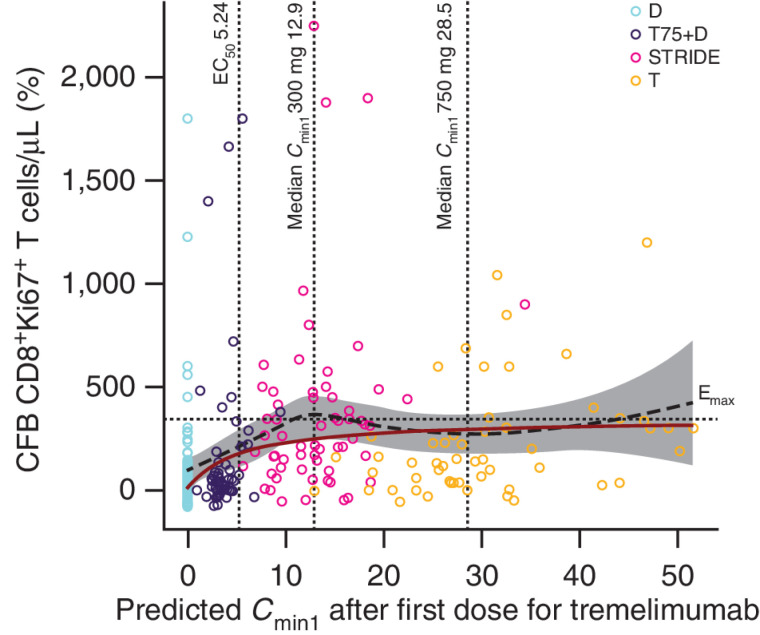
Results: The observed pharmacokinetics of tremelimumab in uHCC were consistent with predictions; no significant covariates were identified. Tremelimumab exposure was not significantly associated with adverse events, objective response rate, or progression-free survival. Overall survival (OS) was longer for patients with tremelimumab exposure, minimum serum drug concentration (Cmin1) ≥ median versus Cmin1 < median (18.99 months vs. 10.97 months), but this exposure-survival analysis might be confounded with baseline characteristics of albumin level and neutrophil to lymphocyte ratio, which had a significant impact on OS (P = 0.0004 and 0.0001, respectively). The predicted Cmin1 of tremelimumab in STRIDE regimen (12.9 μg/mL) was greater than the estimated concentration of tremelimumab eliciting half-maximal increases (EC50 = 5.24 μg/mL) in CD8+Ki67+ T-cell counts.

Conclusions: Our findings support novel insights into tremelimumab pharmacokinetics and exposure-response relationships in HCC and support the clinical utility of the STRIDE regimen in patients with uHCC.


Figures

Figure 1. Observed versus predicted tremelimumab exposure of (A) tremelimumab 750 mg at steady state after 4 doses, (B) tremelimumab 75 mg at steady state after four doses, and (C) tremelimumab 300 mg after first dose (PK analysis population).
Figure 1.
Observed versus predicted tremelimumab exposure of (A) tremelimumab 750 mg at steady state after 4 doses, (B) tremelimumab 75 mg at steady state after four doses, and (C) tremelimumab 300 mg after first dose (PK analysis population). N = 216. Symbols are the observed tremelimumab concentrations. Line and shaded area are the model-predicted median and 95% CI. AUCss, area under the concentration vs. time curve from day 84 to day 112 following actual tremelimumab dose in Study 22 and calculated using the linear up/log down variant of the trapezoidal rule; CI, confidence interval; Cmax1, maximum tremelimumab concentration after first dose; Cmax,ss, maximum tremelimumab concentration from day 84 to 112; Cmin1, minimum tremelimumab concentration at day 28; Cmin,ss, minimum tremelimumab concentration at day 112; N, number of patients included in the analysis; N/A, not applicable; STRIDE (single dose of tremelimumab 300 mg with durvalumab 1,500 mg, followed by durvalumab 1,500 mg once every 4 weeks); T, tremelimumab monotherapy (tremelimumab 750 mg every 4 weeks for a total of 7 doses then once every 12 weeks); T75+D, tremelimumab 75 mg plus durvalumab 1,500 mg once every 4 weeks for a total of 4 doses, followed by durvalumab monotherapy once every 4 weeks.
Figure 2. Tremelimumab exposure-safety analysis for Cmin1 and (A) Grade 3/4 treatment-related AEs, (B) Grade 3/4 treatment-related AESI, and (C) AEs leading to treatment discontinuation (exposure–response analysis population); N = 216. Open blue circles are the observed events. Filled black circles are the observed probability of events and the error bars are the standard errors (calculated as sqrt [P × (1 − P)/n], where P is probability of response and n is the number of patients in each quantile bin) for quantiles [at 100 × (1/4)th percentiles, vertical dotted lines] of exposures (plotted at the median value within each quantile). The red solid line is the model-predicted probability, and the shaded area is the 95% prediction interval. Cmin1, minimum tremelimumab concentration at day 28; N, number of patients included in the analysis.
Figure 2.
Tremelimumab exposure-safety analysis for Cmin1 and (A) Grade 3/4 treatment-related AEs, (B) Grade 3/4 treatment-related AESI, and (C) AEs leading to treatment discontinuation (exposure–response analysis population); N = 216. Open blue circles are the observed events. Filled black circles are the observed probability of events and the error bars are the standard errors (calculated as sqrt [P × (1 − P)/n], where P is probability of response and n is the number of patients in each quantile bin) for quantiles [at 100 × (1/4)th percentiles, vertical dotted lines] of exposures (plotted at the median value within each quantile). The red solid line is the model-predicted probability, and the shaded area is the 95% prediction interval. AE, adverse event; AESI, adverse event of special interest; Cmin1, minimum tremelimumab concentration at day 28; N, number of patients included in the analysis.
Figure 3. Tremelimumab exposure-ORR analysis at Cmin1 (exposure–response analysis population); N = 208. Open blue circles reflect the observed events. Filled black circles are the observed probability of ORR and the error bars are the standard errors (calculated as sqrt [P*(1 − P)/n], where P is probability of response and n is the number of patients in each quantile bin) for quantiles [at 100 × (1/5)th percentiles, vertical dotted lines] of exposures (plotted at the median value within each quantile). The red lines are smooth curves (loess) to show the relationship between two variables. Cmin1, minimum tremelimumab concentration at day 28; N, number of patients included in the analysis.
Figure 3.
Tremelimumab exposure-ORR analysis at Cmin1 (exposure–response analysis population); N = 208. Open blue circles reflect the observed events. Filled black circles are the observed probability of ORR and the error bars are the standard errors (calculated as sqrt [P*(1 − P)/n], where P is probability of response and n is the number of patients in each quantile bin) for quantiles [at 100 × (1/5)th percentiles, vertical dotted lines] of exposures (plotted at the median value within each quantile). The red lines are smooth curves (loess) to show the relationship between two variables. Cmin1, minimum tremelimumab concentration at day 28; N, number of patients included in the analysis. ORR, objective response rate.
Figure 4. Tremelimumab exposure-efficacy analysis stratified by Cmin1 for (A) PFS and (B) OS (exposure-response analysis population); N = 216. Median Cmin1 was 12 μg/mL. N, number of patients included in the analysis.
Figure 4.
Tremelimumab exposure-efficacy analysis stratified by Cmin1 for (A) PFS and (B) OS (exposure-response analysis population); N = 216. Median Cmin1 was 12 μg/mL. CI, confidence interval; Cmin1, minimum tremelimumab concentration at day 28; HR, hazard ratio; N, number of patients included in the analysis; OS, overall survival; PFS, progression-free survival.
Figure 5. OS stratified by baseline covariates (A) albumin and (B) NLR (exposure–response analysis population).
Figure 5.
OS stratified by baseline covariates (A) albumin and (B) NLR (exposure–response analysis population). Median baseline albumin level = 37.0 g/L, N = 216. Median baseline NLR = 3.22, N = 170. Low NLR and low albumin are the reference in the Cox proportional hazard models. CI, confidence interval; HR, hazard ratio; N, number of patients included in the analysis; NLR, neutrophil to lymphocyte ratio; OS, overall survival.
Figure 6. CFB on day 15 of proliferating CD8+Ki67+ T cells versus predicted tremelimumab exposure (PD analysis population); N = 165. The black dashed line and gray-shaded area represent a loess smooth curve and 95% CI for the observed data. The dark red line is the model-predicted response (%CFB) at median CD8+Ki67+ T-cell count. The horizontal dotted line indicates the estimated Emax. The vertical lines indicate the predicted EC50 and the median Cmin1 after first dose (day 28) for 300 and 750 mg tremelimumab. T-cell response to durvalumab is included in the graph as a baseline measurement. Durvalumab monotherapy was included in this analysis as a control. D, durvalumab monotherapy (durvalumab 1,500 mg once every 4 weeks); Emax, maximal effect of tremelimumab on CD8+Ki67+ T-cell counts; EC50, concentration of tremelimumab eliciting half-maximal increases in CD8+Ki67+ T-cell counts; N, number of patients included in the analysis; STRIDE, Single Tremelimumab Regular Interval Durvalumab (single dose of tremelimumab 300 mg with durvalumab 1,500 mg, followed by durvalumab 1,500 mg once every 4 weeks); T, tremelimumab monotherapy (tremelimumab 750 mg once every 4 weeks for a total of seven doses then Q12W); T75+D, tremelimumab 75 mg plus durvalumab 1,500 mg once every 4 weeks for a total of four doses, followed by durvalumab monotherapy once every 4 weeks; T300+D.
Figure 6.
CFB on day 15 of proliferating CD8+Ki67+ T cells versus predicted tremelimumab exposure (PD analysis population); N = 165. The black dashed line and gray-shaded area represent a loess smooth curve and 95% CI for the observed data. The dark red line is the model-predicted response (%CFB) at median CD8+Ki67+ T-cell count. The horizontal dotted line indicates the estimated Emax. The vertical lines indicate the predicted EC50 and the median Cmin1 after first dose (day 28) for 300 and 750 mg tremelimumab. T-cell response to durvalumab is included in the graph as a baseline measurement. Durvalumab monotherapy was included in this analysis as a control. CFB, change from baseline; Cmin1, minimum tremelimumab concentration at day 28; D, durvalumab monotherapy (durvalumab 1,500 mg once every 4 weeks); Emax, maximal effect of tremelimumab on CD8+Ki67+ T-cell counts; EC50, concentration of tremelimumab eliciting half-maximal increases in CD8+Ki67+ T-cell counts; N, number of patients included in the analysis; PD, pharmacodynamics; STRIDE, Single Tremelimumab Regular Interval Durvalumab (single dose of tremelimumab 300 mg with durvalumab 1,500 mg, followed by durvalumab 1,500 mg once every 4 weeks); T, tremelimumab monotherapy (tremelimumab 750 mg once every 4 weeks for a total of seven doses then once every 12 weeks); T75+D, tremelimumab 75 mg plus durvalumab 1,500 mg once every 4 weeks for a total of four doses, followed by durvalumab monotherapy once every 4 weeks; T300+D.

References

    1. Sung H, Ferlay J, Siegel RL, Laversanne M, Soerjomataram I, Jemal A, et al. Global cancer statistics 2020: GLOBOCAN estimates of incidence and mortality worldwide for 36 cancers in 185 countries. CA Cancer J Clin 2021;71:209–49. - PubMed
    1. Global Cancer Observatory. GLOBOCAN liver factsheet. 2020. Available from:https://gco.iarc.fr/today/data/factsheets/cancers/11-Liver-fact-sheet.pdf. Accessed February 15, 2022.
    1. Bray F, Ferlay J, Soerjomataram I, Siegel RL, Torre LA, Jemal A, et al. Global cancer statistics 2018: GLOBOCAN estimates of incidence and mortality worldwide for 36 cancers in 185 countries. CA Cancer J Clin 2018;68:394–424. - PubMed
    1. National Institutes of Health. Cancer stat facts: liver and intrahepatic bile duct cancer. 2021. Available from: https://seer.cancer.gov/statfacts/html/livibd.html. Accessed July 6, 2021.
    1. European Association for the Study of Liver. EASL clinical practice guidelines: management of hepatocellular carcinoma. J Hepatol 2018;69:182–236. - PubMed

Publication types

MeSH terms