. 2022 Dec 7;13(1):7552.
doi: 10.1038/s41467-022-35299-x.

GABAergic neurons in the rostromedial tegmental nucleus are essential for rapid eye movement sleep suppression

Affiliations

GABAergic neurons in the rostromedial tegmental nucleus are essential for rapid eye movement sleep suppression

Ya-Nan Zhao et al. Nat Commun. .

Abstract

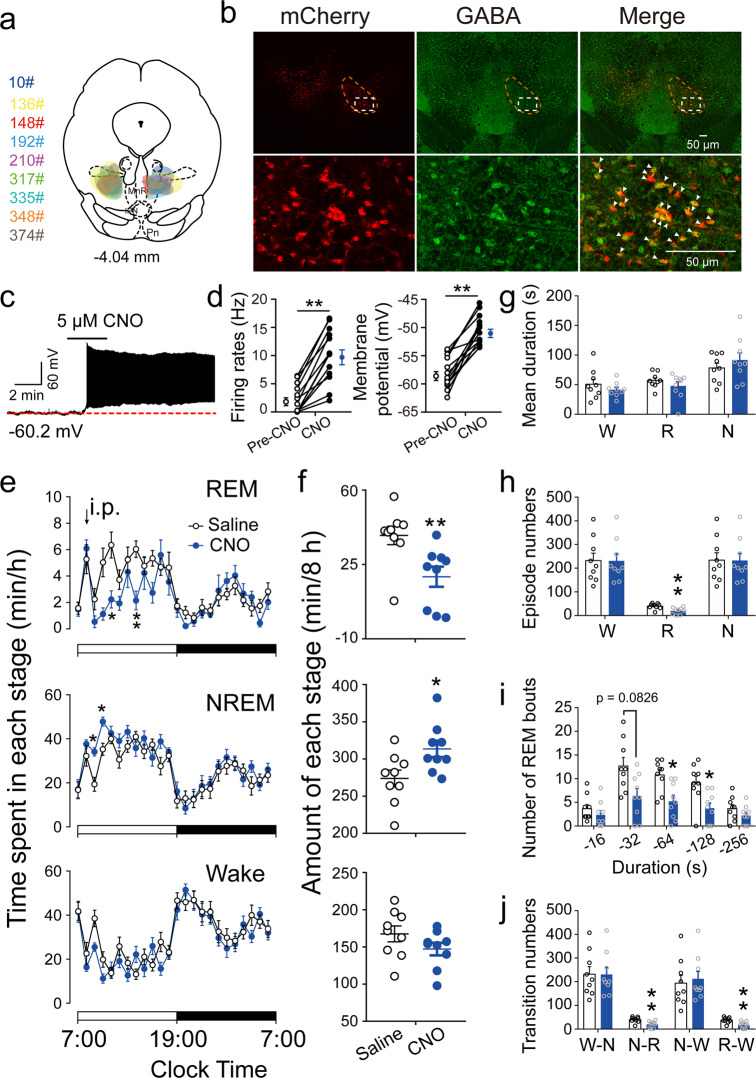
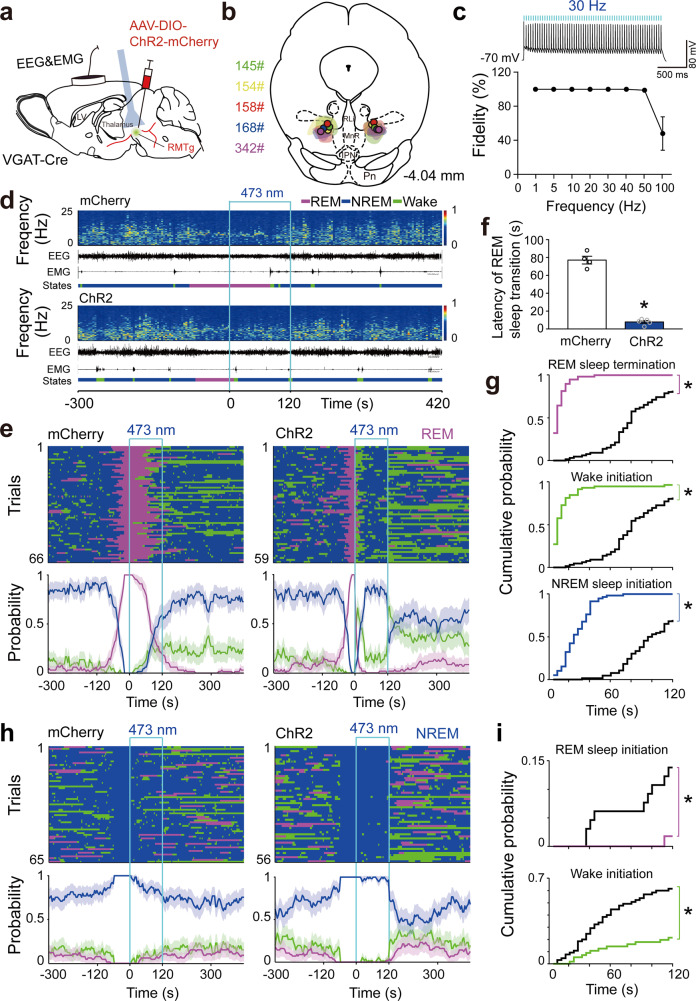
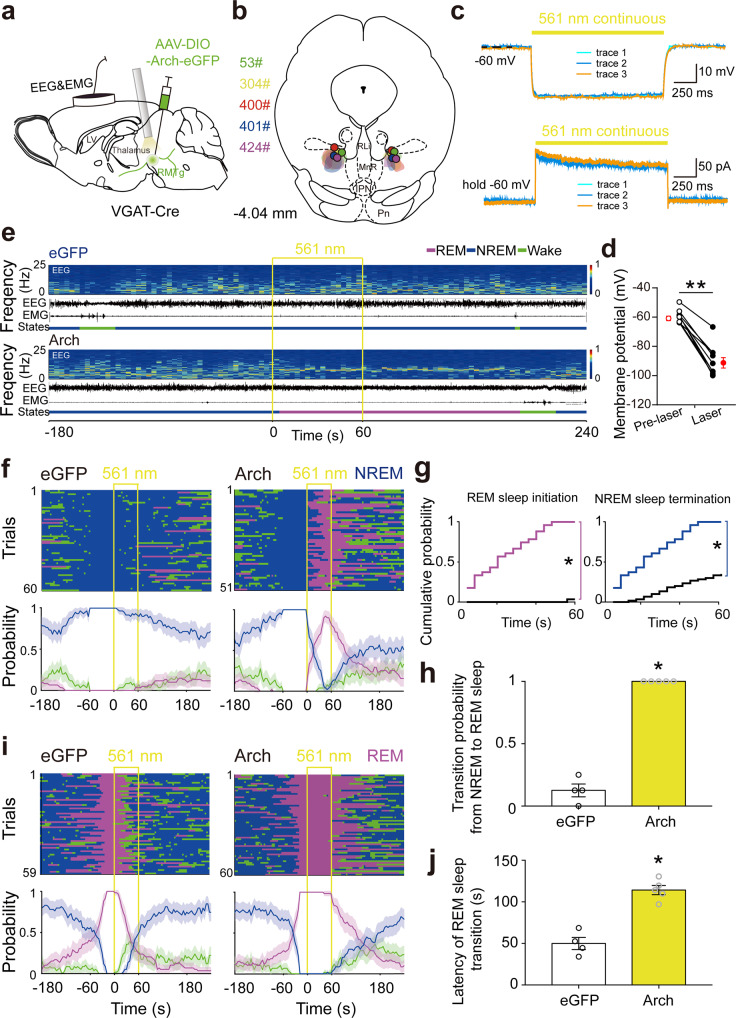
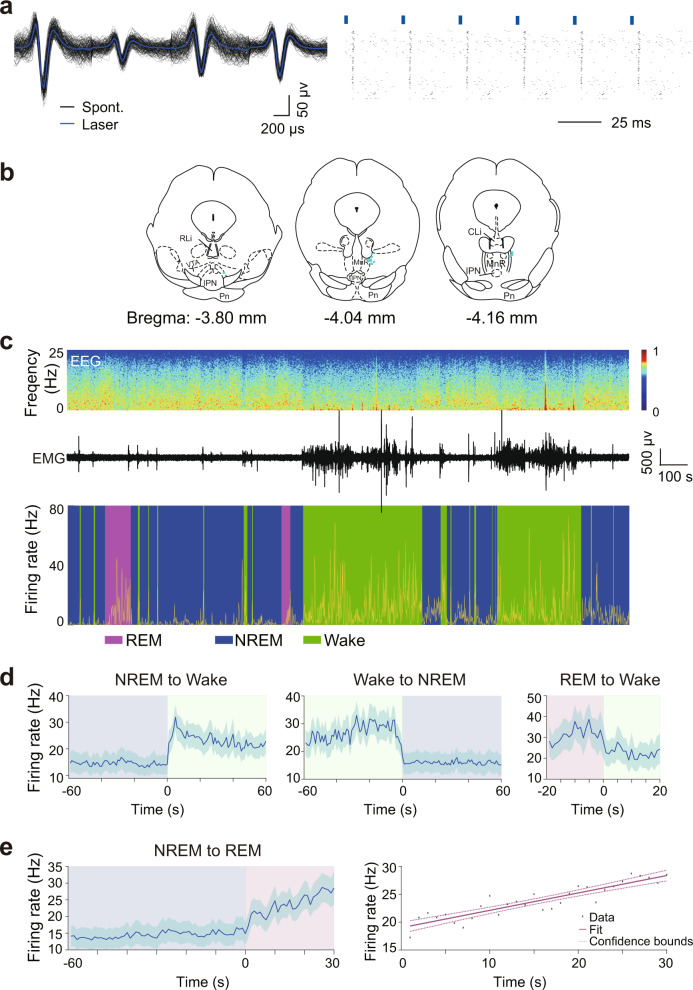
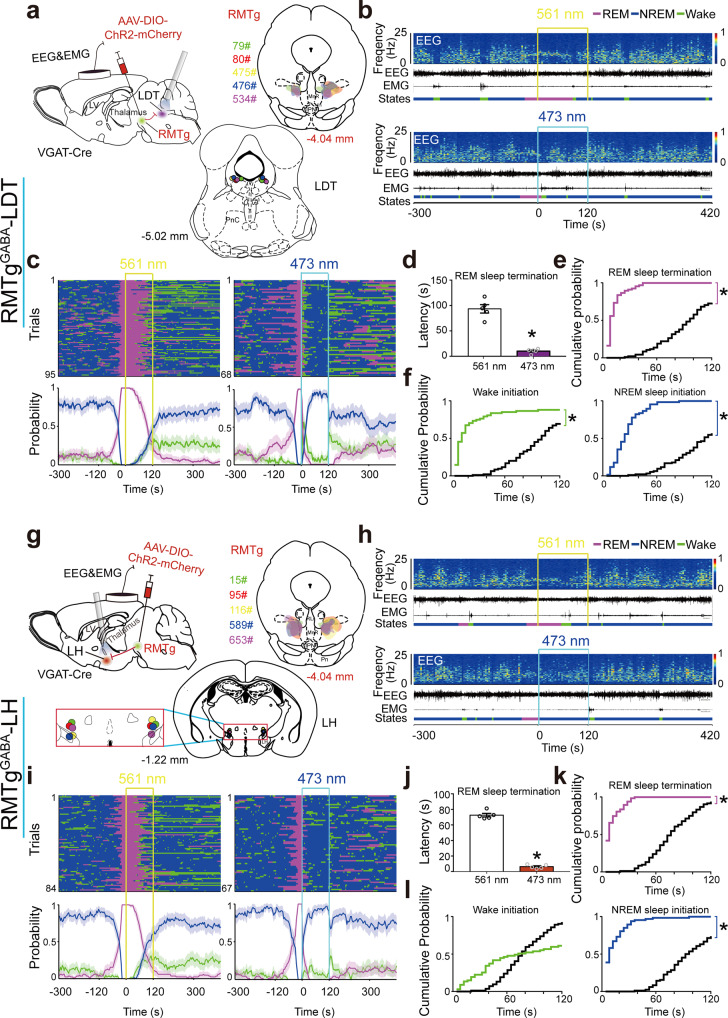
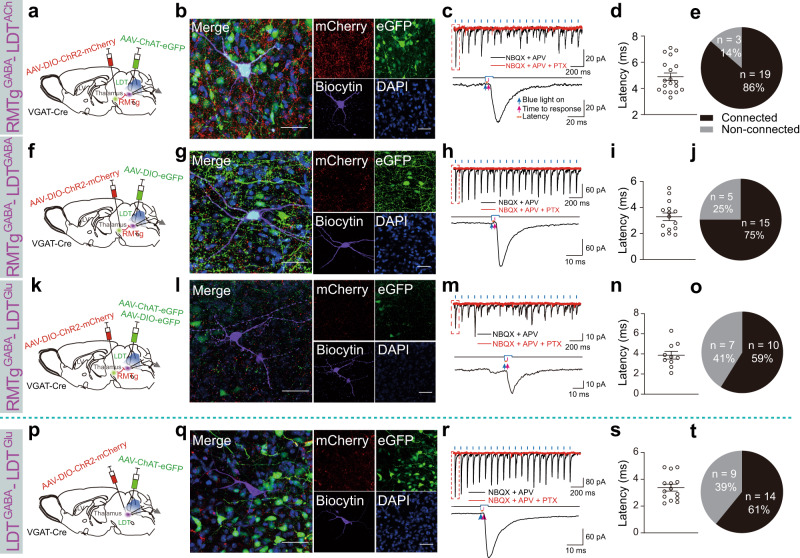
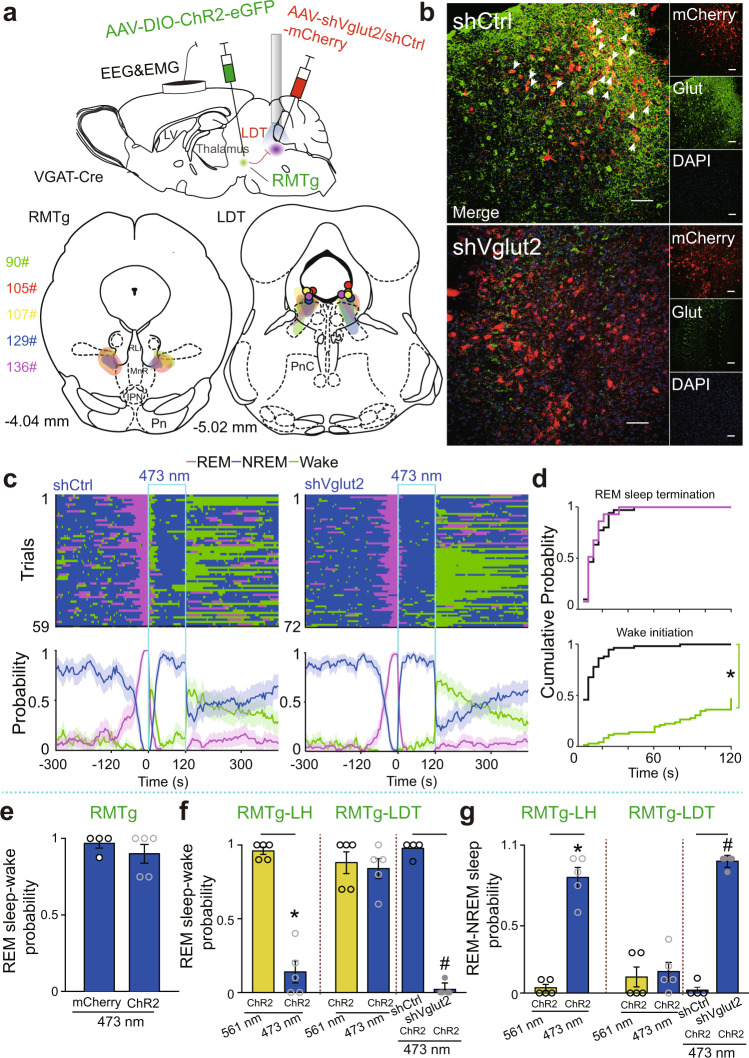
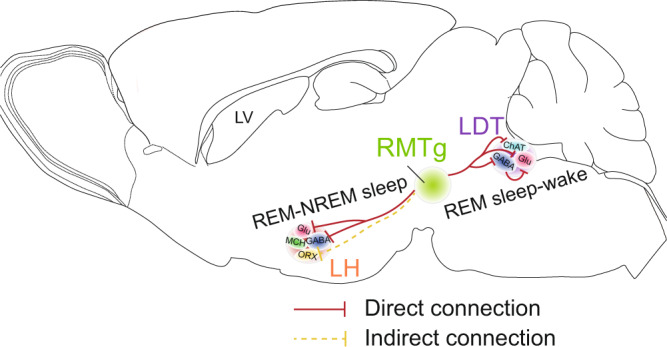
Rapid eye movement (REM) sleep disturbances are prevalent in various psychiatric disorders. However, the neural circuits that regulate REM sleep remain poorly understood. Here, we found that in male mice, optogenetic activation of rostromedial tegmental nucleus (RMTg) GABAergic neurons immediately converted REM sleep to arousal and then initiated non-REM (NREM) sleep. Conversely, laser-mediated inactivation completely converted NREM to REM sleep and prolonged REM sleep duration. The activity of RMTg GABAergic neurons increased to a high discharge level at the termination of REM sleep. RMTg GABAergic neurons directly converted REM sleep to wakefulness and NREM sleep via inhibitory projections to the laterodorsal tegmentum (LDT) and lateral hypothalamus (LH), respectively. Furthermore, LDT glutamatergic neurons were responsible for the REM sleep-wake transitions following photostimulation of the RMTgGABA-LDT circuit. Thus, RMTg GABAergic neurons are essential for suppressing the induction and maintenance of REM sleep.


Conflict of interest statement

The authors declare no competing interests.

Figures

Fig. 1
Fig. 1. Chemogenetic activation of RMTg GABAergic neurons suppressed REM sleep.
a A coronal section shows the superimposed injection sites of adeno-associated virus (AAV) encoding hM3Dq fused to an enhanced red fluorescent protein (mCherry) reporter into the bilateral RMTg in nine VGAT-Cre mice. b Representative photomicrographs of RMTg GABAergic neurons from a mouse microinjected with AAV vectors encoding hM3Dq. The mCherry (red) and GABA-immunolabeling (green) indicate hM3Dq- and GABA-expressing neurons, respectively, and the yellow image depicts merged neurons. Top: lower magnification of the images. The dashed circle area shows the location of the RMTg. Bottom: higher magnification of the dashed square region in the top corresponding images. c A typical trace recorded from an hM3Dq+ neuron in the RMTg during appication of Clozapine-N-oxide (CNO). d CNO significantly increased the firing rates (T12 = 8.446, p < 0.0001) and membrane potential (T12 = 9.217, p < 0.0001) of RMTg hM3Dq-expressing neurons (N = 13 cells from 5 mice). e, f After administration of saline or CNO at 9:00, the hourly average amount of each stage (REM sleep: F1,16 = 9.158, p = 0.0080; NREM sleep: F1,16 = 6.395, p = 0.0223; wake: F1,16 = 2.254, p = 0.1527) (e) and the total amount of each stage (REM sleep: T8 = 3.662, p = 0.0064; NREM sleep: T8 = 2.410, p = 0.0425; wake: T8 = 1.662, p = 0.1351] during the 8-h period (9:00–17:00) (f). gj Sleep–wake architecture during the 8-h post-injection period (9:00–17:00), including mean duration (g), episode number (REM sleep: T8 = 5.438, p = 0.0006) (h), number of REM sleep bouts with different durations (F1,16 = 10.34, p = 0.0054) (i), and conversions between W (wakefulness), N (NREM sleep), and R (REM sleep) (N–R: T8 = 5.383, p = 0.0007; R–W: T8 = 5.041, p = 0.001) (j). *p < 0.05, **p < 0.01. Statistics by two-way repeated ANOVA followed by a post hoc Sidak test (e, i) and by paired t test (fh, j). Data represent mean ± SEM. IPN interpeduncular nucleus, MnR median raphe nucleus, Pn pontine reticular nucleus. Source data are provided as a Source Data file.
Fig. 2
Fig. 2. Optogenetic activation of RMTg GABAergic neurons terminated REM sleep and inhibited REM sleep induction.
a Schematic illustration of virus injection. Adeno-associated virus (AAV) encoding channelrhodopsin 2 (ChR2) fused to an enhanced red fluorescent protein (mCherry) reporter was introduced into the bilateral RMTg in VGAT-Cre mice. b The coronal section shows the superimposed virus-injected area in five mice. c A ChR2-mCherry expressing RMTg GABAergic neuron showed spiking following 30 Hz blue light illumination in current–clamp mode (top). Fidelity analysis of the action potential evoked by stimulus at frequencies ranging from 1 Hz to 100 Hz (bottom). d Representative EEG and EMG traces and corresponding heat map of EEG power spectrum in different sleep–wake states from a mouse in the mCherry (top) and ChR2 (bottom) group, respectively. Blue line, laser stimulation (30 Hz, 120 s,10 ms per pulse). e, h Sleep–wake state changes (top) and probability of brain state transitions (bottom) after photostimulation was applied during REM sleep lasting no less than 16 s before laser on (e) and NREM sleep lasting no less than 60 s before laser on (h) in all trials from mice in the mCherry (left) and ChR2 (right) groups, respectively. Shading indicates 95% confidence intervals. f Mean latency of REM sleep transitions to wakefulness or NREM sleep after blue laser stimulation during REM sleep in the first eight trials per mouse. p = 0.0159, Mann–Whitney U test. g, i During 120 s laser stimulation, the cumulative probability for REM sleep termination, wake, and NREM sleep initiation when laser illuminated during REM sleep (g) and REM sleep and wake initiation when laser illuminated during NREM sleep (i). Colorful stairs, ChR2 group. Black stairs, mCherry group. Data represent mean ± SEM. *p < 0.05 vs. mCherry group, Kolmogorov–Smirnov test. ChR2: n = 5, mCherry: n = 4. Source data are provided as a Source Data file.
Fig. 3
Fig. 3. Optogenetic inactivation of RMTg GABAergic neurons induced REM sleep generation and inhibited REM sleep transition.
a Schematic illustration of virus injection. Adeno-associated virus (AAV) encoding archaerhodopsin-3 (Arch) fused to an enhanced green fluorescent protein (eGFP) reporter was introduced into the bilateral RMTg. b The coronal section shows the superimposed virus-injected area in five mice. c Yellow laser stimulation induced hyperpolarization in current–clamp mode (top) and outward current in voltage–clamp mode with voltage holding at −60 mV (bottom) in an Arch-eGFP expressing RMTg GABAergic neuron. d The average membrane potential (T8 = 11.32, p < 0.0001) of RMTg Arch-expressing neurons (N = 9 cells from 3 mice) was significantly decreased by yellow laser illumination. The results from each cell are shown on the scatter plot. e Representative EEG and EMG traces and the corresponding heat map of the EEG power spectrum in different sleep–wake states from a mouse in the eGFP (top) and Arch (bottom) group, respectively. Yellow line, laser stimulation (constant 60 s). f, i Sleep–wake state changes (top) and probability of brain state transitions (bottom) after photostimulation was applied during NREM sleep lasting no less than 60 s before laser on (f) and REM sleep lasting no less than 16 s before laser on (i) in all trials from mice in the eGFP (left) and Arch (right) groups, respectively. Shading indicates 95% confidence intervals. g, h During 60 s laser stimulation illuminated during NREM sleep, the cumulative probability of REM sleep initiation and NREM sleep termination (g) and mean probability of NREM to REM sleep transition in the first eight trials per mouse (h). Colorful stairs, Arch group. Black stairs, eGFP group. *p < 0.05 vs. eGFP group, Kolmogorov–Smirnov test (g). j Mean latency of REM sleep transitions to wakefulness/NREM sleep after yellow laser stimulation during REM sleep in the first eight trials per mouse. p = 0.0159 vs. eGFP, Mann–Whitney U test (h, j). Data represent mean ± SEM. Arch: n = 5, eGFP: n = 4. Source data are provided as a Source Data file.
Fig. 4
Fig. 4. Firing rates of identified RMTg GABAergic neurons across brain states.
a An example unit. Comparison between laser-evoked (blue) and spontaneous (black) spike waveforms from this unit (left). Spike raster showing multiple trials of laser stimulation at 30 Hz. Blue ticks, laser pulses (right). b Recording sites of 12 identified units across the rostrocaudal extent of the RMTg in VGAT-Cre mice. Each indigo dot indicates one unit. c Firing rates of an example RMTg GABAergic neuron (yellow) together with the EEG spectrogram, EMG amplitude, and color-marked brain state. d Mean firing rates of all identified GABAergic neurons at sleep–wake state transitions. e Firing rate changes of identified RMTg GABAergic neurons from NREM to REM sleep transition (left) and linear regression of firing frequency of all identified units during the initial 30 s of REM sleep (right). Dashed line: confidence bounds (R2 = 0.819, p < 0.01). Shading indicates 95% confidence intervals (d, e). n = 12 units from 3 mice. Source data are provided as a Source Data file.
Fig. 5
Fig. 5. The RMTgGABA-LDT and RMTgGABA-LH circuits mediated distinct REM sleep transitions.
a, g Diagram of experiments for in vivo optogenetic stimulation of RMTg GABAergic terminals in the laterodorsal tegmentum (LDT) (a) or lateral hypothalamus (LH) (g). Schematic illustration of adeno-associated virus (AAV) encoding channelrhodopsin 2 (ChR2) fused to an enhanced red fluorescent protein mCherry delivered into the bilateral RMTg in VGAT-Cre mice (top left). The coronal section shows the superimposed virus-injected area (top right) and tips of optical fibers (bottom). b, h Representative EEG and EMG traces and corresponding heat map of the EEG power spectrum in different sleep–wake states induced by laser stimulation of the RMTgGABA-LDT (b) and RMTgGABA-LH (h). Top, control group with 561 nm laser stimulation. Bottom, 473 nm laser stimulation. c, i Sleep–wake state changes (top) and probability of brain state transitions (bottom) after photostimulation of RMTg GABAergic axons in the LDT (c) or LH (i) during REM sleep lasting no less than 16 s before laser on in all trials from mice in each of these two circuit groups with 561 nm laser stimulation as the control (left) and 473 nm laser stimulation (right), respectively. Shading indicates 95% confidence intervals. Yellow and blue lines, 561 nm and 473 nm laser stimulation (30 Hz, 120 s, 10 ms pulse), respectively (b, c, h, i). df, jl During 120 s laser stimulation of the RMTgGABA-LDT (df) and RMTgGABA-LH (jl), mean latency of REM sleep transitions to wakefulness or NREM sleep after blue laser stimulation during REM sleep in the first eight trials per mouse. p = 0.0312 vs. control group, Wilcoxon test (d, j); cumulative probability of REM sleep termination, wake and NREM sleep initiation. *p < 0.05 for comparison between 473 nm laser stimulation and 561 nm control group, Kolmogorov–Smirnov test. Colorful stairs, group with 473 nm laser illumination. Black stairs, control group with 561 nm laser illumination (e, f, k, l). Data represent mean ± SEM. n = 5 for the circuits of RMTgGABA-LDT or RMTgGABA-LH. Source data are provided as a Source Data file.
Fig. 6
Fig. 6. RMTg GABAergic neurons directly inhibited LDT cholinergic, GABAergic, and glutamatergic neurons and indirectly disinhibited LDT glutamatergic neurons.
ao RMTg GABAergic terminals formed inhibitory connections with laterodorsal tegmentum (LDT) cholinergic, GABAergic, and glutamatergic neurons. pt Within the LDT, GABAergic neurons formed inhibitory connections with glutamatergic neurons. a, f, k, p Schematic diagrams of the experimental protocols. In VGAT-Cre mice, Cre-dependent AAVs encoding ChR2 was injected into the RMTg (a, f, k) or the LDT (p), whereas AAVs encoding the promoter of cholinergic neurons (ChAT-eGFP) (a), DIO-eGFP (f), ChAT-eGFP and DIO-eGFP (k), or ChAT-eGFP (p) were injected into the LDT of VGAT-Cre mice. b, g, l, q Representative images showing a recorded biocytin-filled neuron (violet) that is a cholinergic neuron (ChAT-eGFP: green) (b), GABAergic neuron (DIO-eGFP: green) (g), a glutamatergic neuron with no eGFP expression (l), and glutamatergic neuron with no eGFP or mCherry expression (q). Scale bar: 50 μm. c, h, m, r Typical traces of inhibitory postsynaptic currents (IPSCs) from an LDT cholinergic neuron (c), GABAergic neuron (h), and glutamatergic neuron (m, r) evoked by blue light stimulation (black line) of ChR2-expressing GABAergic terminals in the RMTg (c, h, m) or LDT (r). The evoked currents were completely abolished by the application of picrotoxin (PTX) (red line) but not NBQX and APV (black line). d, i, n, s Latency of light-evoked IPSCs in LDT cholinergic neurons (d), GABAergic neurons (i), and glutamatergic neurons (n, s) that responded to laser stimulation of ChR2-expressing GABAergic terminals in the RMTg (d, i, n) or LDT (s). Data represent mean ± SEM. e, j, o, t Proportion of recorded LDT cholinergic (e), GABAergic (j), and glutamatergic neurons (o, t) that responded to laser stimulation of ChR2-expressing GABAergic terminals in the RMTg (e, j, o) or LDT (t). N = 22 cells (e), N = 20 cells (j), N = 17 cells (o), and N = 23 cells (t) from 3 mice. NBQX 6-nitro-7-ulphamoylbenzo(f)-quinoxaline-2,3-dione, APV d-(-)-2-amino-5-phosphonopentanoic acid, ACh cholinergic neurons, Glu glutamatergic neurons. Source data are provided as a Source Data file.
Fig. 7
Fig. 7. Causal evidence for transient arousal from REM sleep by activation of the RMTgGABA-LDT circuit.
a Schematic diagram of the experimental protocol (top). The coronal section shows the superimposed virus-injected area (bottom, left: RMTg; right: LDT) and the tips of optical fibers in the LDT (bottom, right). b Representative photographs of coronal sections containing the LDT from a control (top) and a knockdown (bottom) VGAT-Cre mouse. The images show mCherry-expressing neurons (red), glutamate (Glut)-expressing neurons (green, but not the green ChR2-expressing RMTg GABAergic nerve endings), merged neurons (yellow) pointed to by arrows with Glut and mCherry, and 4′,6-diamidino-2-phenylindole (DAPI, blue) staining. Scale bar, 50 μm. c Sleep–wake state changes (top) and probability of brain state transitions (bottom) after photostimulation of RMTg GABAergic axon endings in the LDT during REM sleep lasting no less than 16 s before laser on in all trials from mice in the shCtrl (left) and shVglut2 (right) groups. Shading indicates 95% confidence intervals. d During 120 s laser stimulation of the RMTgGABA-LDT, the cumulative probability for REM sleep termination and wake initiation. Colorful stairs, shVglut2 group. Black stairs, shCtrl group. *p < 0.05, Kolmogorov–Smirnov test. e Probability of first transitions from REM sleep to wakefulness by ChR2-mediated activation of RMTg GABAergic neurons. ChR2: n = 5, mCherry: n = 4. f, g Comparison between the probability of first transitions from REM sleep to wakefulness (f) and REM to NREM sleep (g) by activation of the RMTgGABA-LH (n = 5), RMTgGABA-LDT (n = 5), and RMTgGABA-LDT with shVglut2 (n = 5) and shCtrl (n = 4) microinjection in the LDT, respectively. A 561 nm yellow laser stimulation was used as the control group. A 473 nm blue laser stimulation was used as the experimental group. *p < 0.05, Wilcoxon signed rank test for the experimental group with the 561 nm control group; #p < 0.05, Mann–Whitney U test for the shVglut2 and shCtrl group. Data represent mean ± SEM. Source data are provided as a Source Data file. LDT laterodorsal tegmentum.
Fig. 8
Fig. 8. Hypothesis for neural mechanisms of RMTg GABAergic neurons suppressing REM sleep through the LDT/LH.
RMTg GABAergic neurons inhibited cholinergic and/or GABAergic neurons in the LDT to cease REM sleep. Activation of RMTg GABAergic neurons inhibited GABAergic interneurons in the LDT, which then disinhibited glutamatergic neurons in the LDT to facilitate REM sleep–wake transitions. Activation of RMTg GABAergic terminals in the LH facilitated REM–NREM sleep transitions through direct inhibition of glutamatergic and/or GABAergic neurons and/or through indirect synaptic connection with orexin neurons. RMTg rostromedial tegmental nucleus, LDT laterodorsal tegmentum, LH lateral hypothalamus, LV lateral ventricle, ChAT cholinergic neurons, Glu glutamatergic neurons, ORX orexin neurons, MCH melanin-concentrating hormone neurons.

References

    1. Scammell TE, Arrigoni E, Lipton JO. Neural circuitry of wakefulness and sleep. Neuron. 2017;93:747–765. doi: 10.1016/j.neuron.2017.01.014. - DOI - PMC - PubMed
    1. Peever J, Fuller PM. The biology of REM sleep. Curr. Biol. 2017;27:R1237–R1248. doi: 10.1016/j.cub.2017.10.026. - DOI - PubMed
    1. Liu D, Dan Y. A motor theory of sleep-wake control: arousal-action circuit. Annu. Rev. Neurosci. 2019;42:27–46. doi: 10.1146/annurev-neuro-080317-061813. - DOI - PubMed
    1. Miller KE, Gehrman PR. REM sleep: what is it good for? Curr. Biol. 2019;29:R806–R807. doi: 10.1016/j.cub.2019.06.074. - DOI - PubMed
    1. Tempesta D, Socci V, De Gennaro L, Ferrara M. Sleep and emotional processing. Sleep. Med. Rev. 2018;40:183–195. doi: 10.1016/j.smrv.2017.12.005. - DOI - PubMed

Publication types