. 2023 Feb;32(4):800-818.
doi: 10.1111/mec.16810. Epub 2022 Dec 19.

Whole genome resequencing identifies local adaptation associated with environmental variation for redband trout

Affiliations

Whole genome resequencing identifies local adaptation associated with environmental variation for redband trout

Kimberly R Andrews et al. Mol Ecol. 2023 Feb.

Abstract

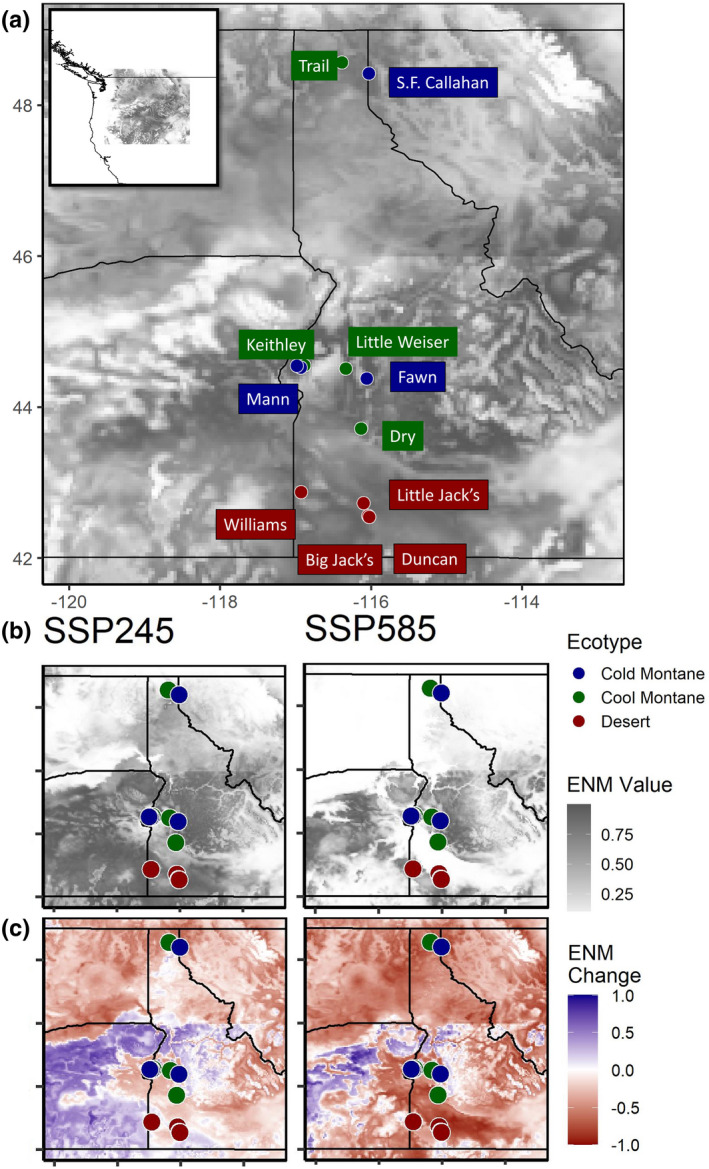
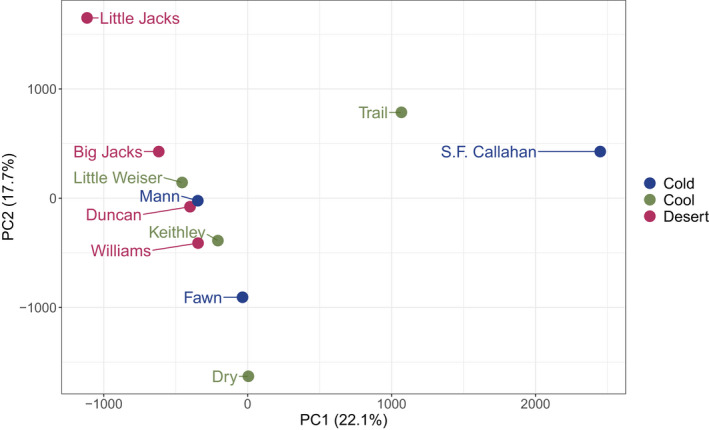
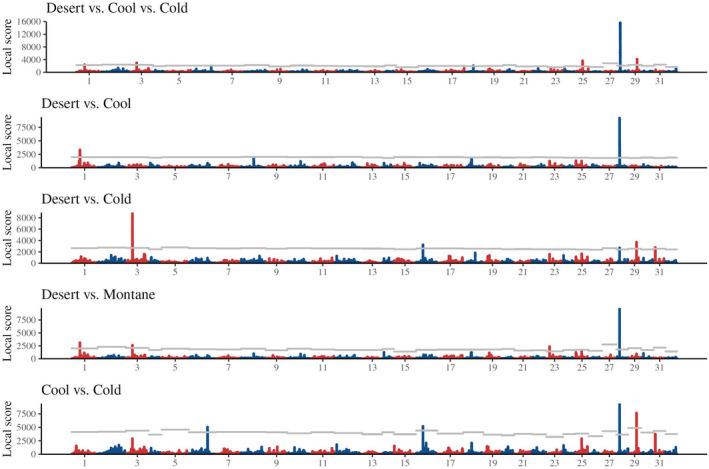
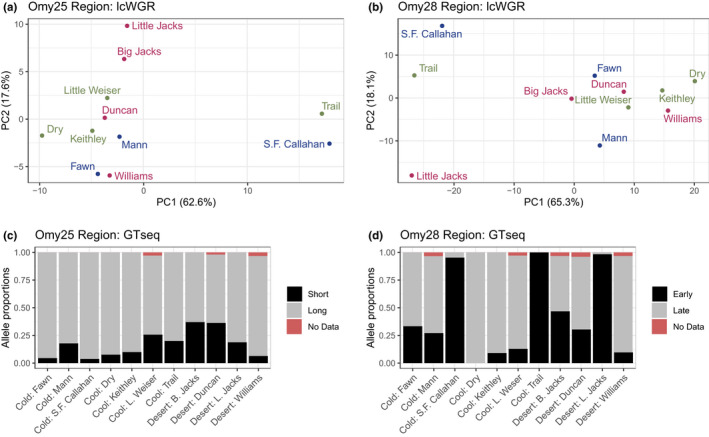
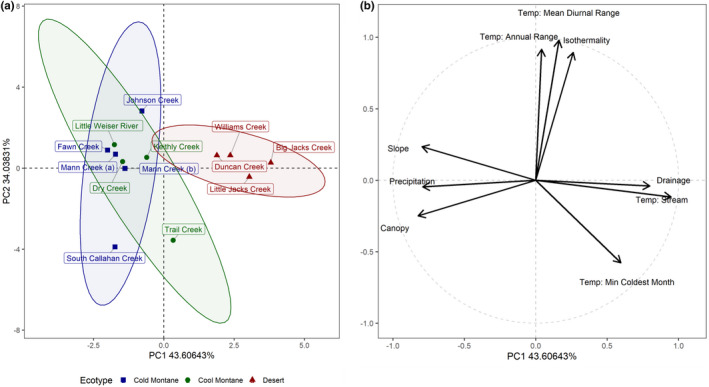
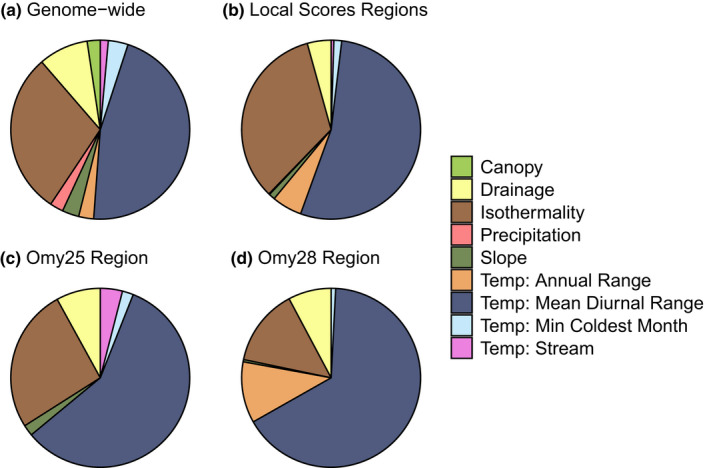
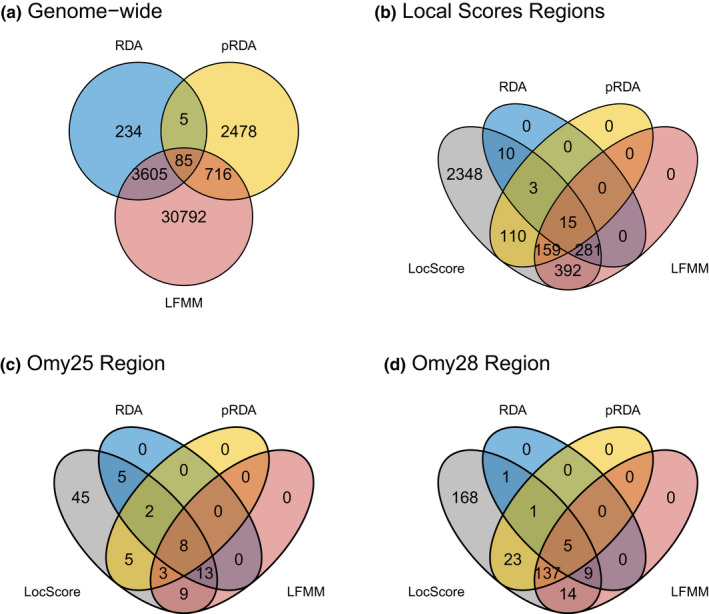
Aquatic ectotherms are predicted to harbour genomic signals of local adaptation resulting from selective pressures driven by the strong influence of climate conditions on body temperature. We investigated local adaptation in redband trout (Oncorhynchus mykiss gairdneri) using genome scans for 547 samples from 11 populations across a wide range of habitats and thermal gradients in the interior Columbia River. We estimated allele frequencies for millions of single nucleotide polymorphism loci (SNPs) across populations using low-coverage whole genome resequencing, and used population structure outlier analyses to identify genomic regions under divergent selection between populations. Twelve genomic regions showed signatures of local adaptation, including two regions associated with genes known to influence migration and developmental timing in salmonids (GREB1L, ROCK1, SIX6). Genotype-environment association analyses indicated that diurnal temperature variation was a strong driver of local adaptation, with signatures of selection driven primarily by divergence of two populations in the northern extreme of the subspecies range. We also found evidence for adaptive differences between high-elevation desert vs. montane habitats at a smaller geographical scale. Finally, we estimated vulnerability of redband trout to future climate change using ecological niche modelling and genetic offset analyses under two climate change scenarios. These analyses predicted substantial habitat loss and strong genetic shifts necessary for adaptation to future habitats, with the greatest vulnerability predicted for high-elevation desert populations. Our results provide new insight into the complexity of local adaptation in salmonids, and important predictions regarding future responses of redband trout to climate change.

Keywords: Oncorhynchus mykiss gairdneri; developmental timing; ecological niche modelling; genome scan; genotype-environment association analysis; thermal gradient.


Conflict of interest statement

The authors declare no conflicts of interest.

Figures

FIGURE 1
FIGURE 1
Map of study sites and ecological niche model (ENM) results for the present day, and for the period 2081–2100 across two shared‐socioeconomic pathways (SSP245 and SSP585). a) ENM values for the present day, with higher ENM values representing higher relative probability of presence (a proxy for habitat quality). b) Raw ENM value for future time period. c) Change from present day ENM values for future time period. “Cold” = cold montane forest, “Cool” = cool montane forest, “Desert” = high‐elevation desert
FIGURE 2
FIGURE 2
Principal components analysis of all genome‐wide SNPs across geographical sites, colour‐coded by ecotype: “Cold” = cold montane forest, “Cool” = cool montane forest, “Desert” = high‐elevation desert
FIGURE 3
FIGURE 3
Manhattan plots of Local Scores across genome‐wide SNPs for pairwise comparisons between habitat types for the full data set analyses (including all Snake River and Kootenai River populations). Chromosome numbers are given along the x‐axis. Horizontal grey lines indicate average chromosome significance = .001 after correction for multiple tests
FIGURE 4
FIGURE 4
Population structure for SNPs occurring within outlier genomic regions identified using Local Score analysis on chromosomes Omy25 and Omy28. (a, b) PCA for all SNPs identified by poolparty analysis and occurring within the outlier regions (n = 128 SNPs for Omy 25 region, n = 454 SNPs for Omy28 region); red = high‐elevation desert populations; green = cool montane forest populations; blue = cold montane forest populations. (c, d) Allele proportions for one GTseq SNP occurring within 100 kb of each outlier region (Locus L01 for Omy25, Locus L02 for Omy28); allele proportions for the remaining GTseq SNPs within these regions show similar results due to strong linkage, and are reported in Figures S11 and S13. Previous studies have identified Oncorhynchus mykiss phenotypes associated with each GTseq SNP allele: an earlier (“Short”) or later (“Long”) age at maturity for the Omy25 region, and an “Early” or “Late” migration timing for the Omy28 region (Willis et al., 2020). “No Data” indicates the proportion of samples that failed to produce genotype data
FIGURE 5
FIGURE 5
Principal components analysis of environmental data. (a) Populations colour coded by ecotype, and with distribution ellipses around 95% confidence intervals. “Blue” = cold montane forest, “green” = cool montane forest, “red” = high‐elevation desert. “Mann Creek (a)” and “Mann Creek (b)” represent two geographically proximate tributaries. (b) Contributions of environmental variables to the principal components
FIGURE 6
FIGURE 6
Proportions of environmental associations for LFMM outlier SNPs for full data set analyses (including both Snake River and Kootenai River populations). Each environmental association is treated independently, and therefore SNPs associated with more than one environmental variable are represented more than once. (a) All LFMM outlier SNPs (35,198 SNPs), (b) only LFMM outlier SNPs occurring in the 10 Local Scores population structure outlier regions (847 SNPs), (c) only LFMM outlier SNPs within the Omy25 outlier region (33 SNPs), and (d) only LFMM outlier SNPs within the Omy28 outlier region (165 SNPs)
FIGURE 7
FIGURE 7
Overlap of outlier SNPs across detection methods for the full data set analyses (including all Snake River and Kootenai River populations). (a) Genome‐wide outlier SNPs from all GEA methods (RDA, pRDA, LFMM), (b) SNPs found within all 10 outlier regions identified by the Local Score (LocScore) population structure outlier analysis, (c) SNPs found within the Omy25 outlier region, and (d) SNPs found within the Omy28 outlier region. SNPs that were outliers for more than one environmental variable were counted only once

References

    1. Aguirre‐Liguori, J. A. , Ramirez‐Barahona, S. , & Gaut, B. S. (2021). The evolutionary genomics of species' responses to climate change. Nature Ecology & Evolution, 5, 1350–1360. 10.1038/s41559-021-01526-9 - DOI - PubMed
    1. Alshwairikh, Y. A. , Kroeze, S. L. , Olsson, J. , Stephens‐Cardenas, S. A. , Swain, W. L. , Waits, L. P. , Horn, R. L. , Narum, S. R. , & Seaborn, T. (2021). Influence of environmental conditions at spawning sites and migration routes on adaptive variation and population connectivity in Chinook salmon. Ecology and Evolution, 11, 16890–16908. 10.1002/ece3.8324 - DOI - PMC - PubMed
    1. Andrews, S. (2010). FastQC: A quality control tool for high throughput sequence data [Online] . http://www.bioinformatics.babraham.ac.uk/projects/fastqc/
    1. Barson, N. J. , Aykanat, T. , Hindar, K. , Baranski, M. , Bolstad, G. H. , Fiske, P. , Jacq, C. , Jensen, A. J. , Johnston, S. E. , Karlsson, S. , Kent, M. , Moen, T. , Niemelä, E. , Nome, T. , Næsje, T. F. , Orell, P. , Romakkaniemi, A. , Sægrov, H. , Urdal, K. , … Primmer, C. R. (2015). Sex‐dependent dominance at a single locus maintains variation in age at maturity in salmon. Nature, 528, 405. 10.1038/nature16062 - DOI - PubMed
    1. Bear, E. A. , McMahon, T. E. , & Zale, A. V. (2007). Comparative thermal requirements of westslope cutthroat trout and rainbow trout: Implications for species interactions and development of thermal protection standards. Transactions of the American Fisheries Society, 136, 1113–1121. 10.1577/t06-072.1 - DOI

Publication types

MeSH terms

LinkOut - more resources