Evaluation of the peritumoral features using radiomics and deep learning technology in non-spiculated and noncalcified masses of the breast on mammography
- PMID: 36479079
- PMCID: PMC9721450
- DOI: 10.3389/fonc.2022.1026552
Evaluation of the peritumoral features using radiomics and deep learning technology in non-spiculated and noncalcified masses of the breast on mammography
Abstract
Objective: To assess the significance of peritumoral features based on deep learning in classifying non-spiculated and noncalcified masses (NSNCM) on mammography.
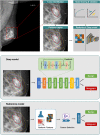
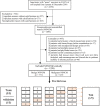
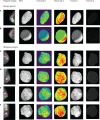
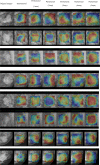
Methods: We retrospectively screened the digital mammography data of 2254 patients who underwent surgery for breast lesions in Harbin Medical University Cancer Hospital from January to December 2018. Deep learning and radiomics models were constructed. The classification efficacy in ROI and patient levels of AUC, accuracy, sensitivity, and specificity were compared. Stratified analysis was conducted to analyze the influence of primary factors on the AUC of the deep learning model. The image filter and CAM were used to visualize the radiomics and depth features.
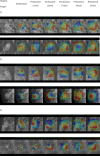
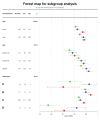
Results: For 1298 included patients, 771 (59.4%) were benign, and 527 (40.6%) were malignant. The best model was the deep learning combined model (2 mm), in which the AUC was 0.884 (P < 0.05); especially the AUC of breast composition B reached 0.941. All the deep learning models were superior to the radiomics models (P < 0.05), and the class activation map (CAM) showed a high expression of signals around the tumor of the deep learning model. The deep learning model achieved higher AUC for large size, age >60 years, and breast composition type B (P < 0.05).
Conclusion: Combining the tumoral and peritumoral features resulted in better identification of malignant NSNCM on mammography, and the performance of the deep learning model exceeded the radiomics model. Age, tumor size, and the breast composition type are essential for diagnosis.
Keywords: deep learning; mammography; non-spiculated and noncalcified masses; peritumoral features; radiomics.
Copyright © 2022 Guo, Li, Gao, Huang, Zhang, Xu, Xu, Li, Sun and Jiang.
Conflict of interest statement
Authors FGa, CH, FZ, and JX are employed by Beijing Deepwise & League of PHD Technology Co., Ltd. The remaining authors declare that the research was conducted in the absence of any commercial or financial relationships that could be construed as a potential conflict of interest.
Figures

Similar articles
-
Diagnostic performance of perilesional radiomics analysis of contrast-enhanced mammography for the differentiation of benign and malignant breast lesions.Eur Radiol. 2022 Jan;32(1):639-649. doi: 10.1007/s00330-021-08134-y. Epub 2021 Jun 29. Eur Radiol. 2022. PMID: 34189600
-
Development of a nomogram-based model combining intra- and peritumoral ultrasound radiomics with clinical features for differentiating benign from malignant in Breast Imaging Reporting and Data System category 3-5 nodules.Quant Imaging Med Surg. 2023 Oct 1;13(10):6899-6910. doi: 10.21037/qims-23-283. Epub 2023 Sep 22. Quant Imaging Med Surg. 2023. PMID: 37869276 Free PMC article.
-
Comparative Evaluation of Machine Learning-Based Radiomics and Deep Learning for Breast Lesion Classification in Mammography.Diagnostics (Basel). 2025 Apr 9;15(8):953. doi: 10.3390/diagnostics15080953. Diagnostics (Basel). 2025. PMID: 40310389 Free PMC article.
-
Intratumoral and Peritumoral Analysis of Mammography, Tomosynthesis, and Multiparametric MRI for Predicting Ki-67 Level in Breast Cancer: a Radiomics-Based Study.Mol Imaging Biol. 2022 Aug;24(4):550-559. doi: 10.1007/s11307-021-01695-w. Epub 2021 Dec 13. Mol Imaging Biol. 2022. PMID: 34904187
-
Radiomics in breast cancer classification and prediction.Semin Cancer Biol. 2021 Jul;72:238-250. doi: 10.1016/j.semcancer.2020.04.002. Epub 2020 May 1. Semin Cancer Biol. 2021. PMID: 32371013 Review.
Cited by
-
Preoperative CT-based deep learning radiomics model to predict lymph node metastasis and patient prognosis in bladder cancer: a two-center study.Insights Imaging. 2024 Jan 25;15(1):21. doi: 10.1186/s13244-023-01569-5. Insights Imaging. 2024. PMID: 38270647 Free PMC article.
-
Deep learning assisted diagnosis system: improving the diagnostic accuracy of distal radius fractures.Front Med (Lausanne). 2023 Aug 17;10:1224489. doi: 10.3389/fmed.2023.1224489. eCollection 2023. Front Med (Lausanne). 2023. PMID: 37663656 Free PMC article.
-
CNN-Based Cross-Modality Fusion for Enhanced Breast Cancer Detection Using Mammography and Ultrasound.Tomography. 2024 Dec 12;10(12):2038-2057. doi: 10.3390/tomography10120145. Tomography. 2024. PMID: 39728907 Free PMC article.
-
Diagnosis of benign and malignant nodules with a radiomics model integrating features from nodules and mammary regions on DCE-MRI.Front Oncol. 2024 Feb 21;14:1307907. doi: 10.3389/fonc.2024.1307907. eCollection 2024. Front Oncol. 2024. PMID: 38450180 Free PMC article.
References
-
- Islam SR, Aziz SM. Mammography is the most effective method of breast cancer screening. Mymensingh Med J (2012) 21(2):366–71. - PubMed
LinkOut - more resources
Full Text Sources

