. 2022 Nov 21:13:1022401.
doi: 10.3389/fimmu.2022.1022401. eCollection 2022.

Platelets' morphology, metabolic profile, exocytosis, and heterotypic aggregation with leukocytes in relation to severity and mortality of COVID-19-patients

Affiliations

Platelets' morphology, metabolic profile, exocytosis, and heterotypic aggregation with leukocytes in relation to severity and mortality of COVID-19-patients

Basma A Yasseen et al. Front Immunol. .

Abstract

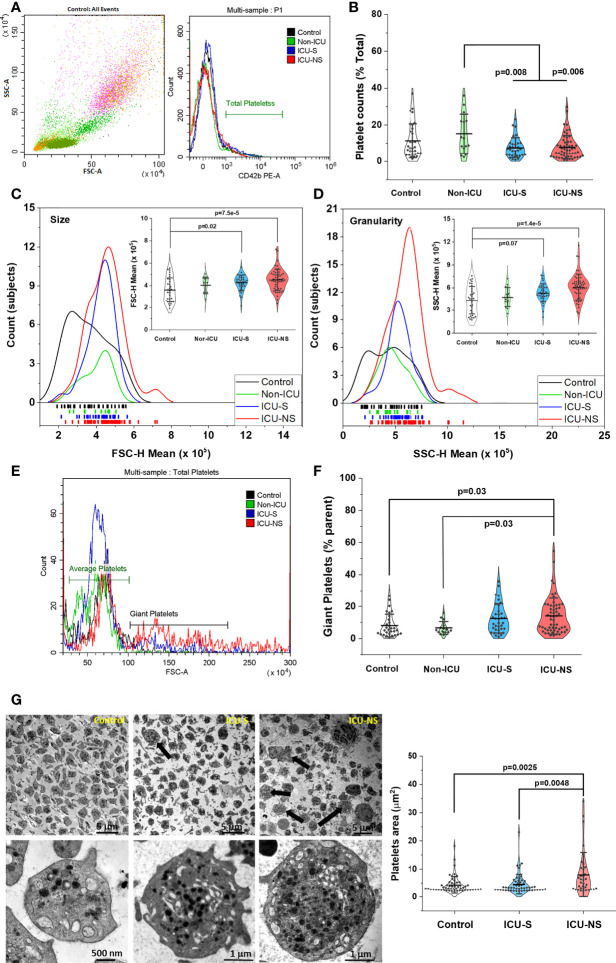
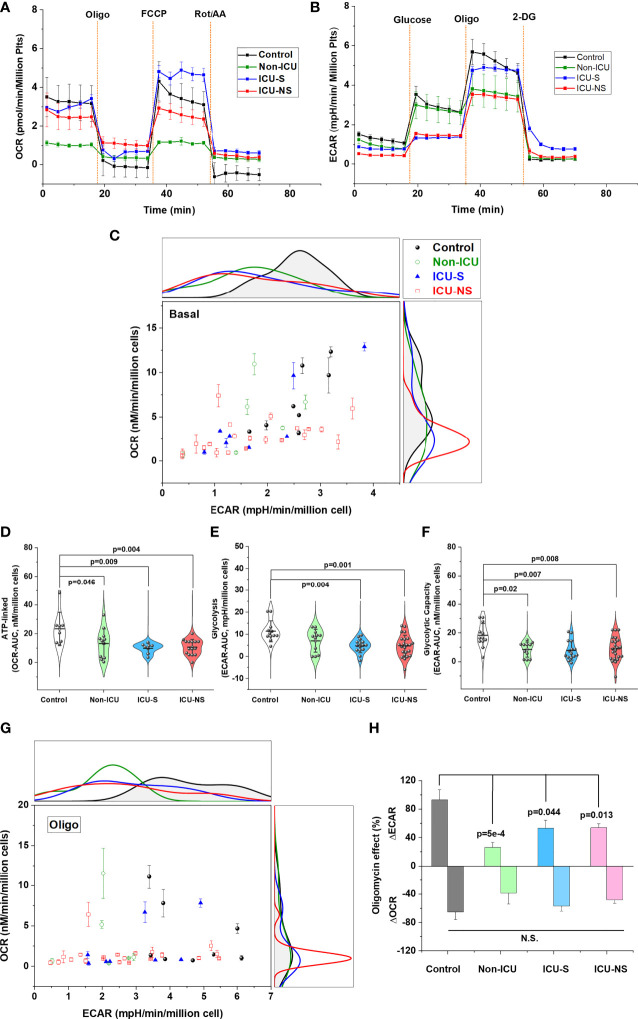
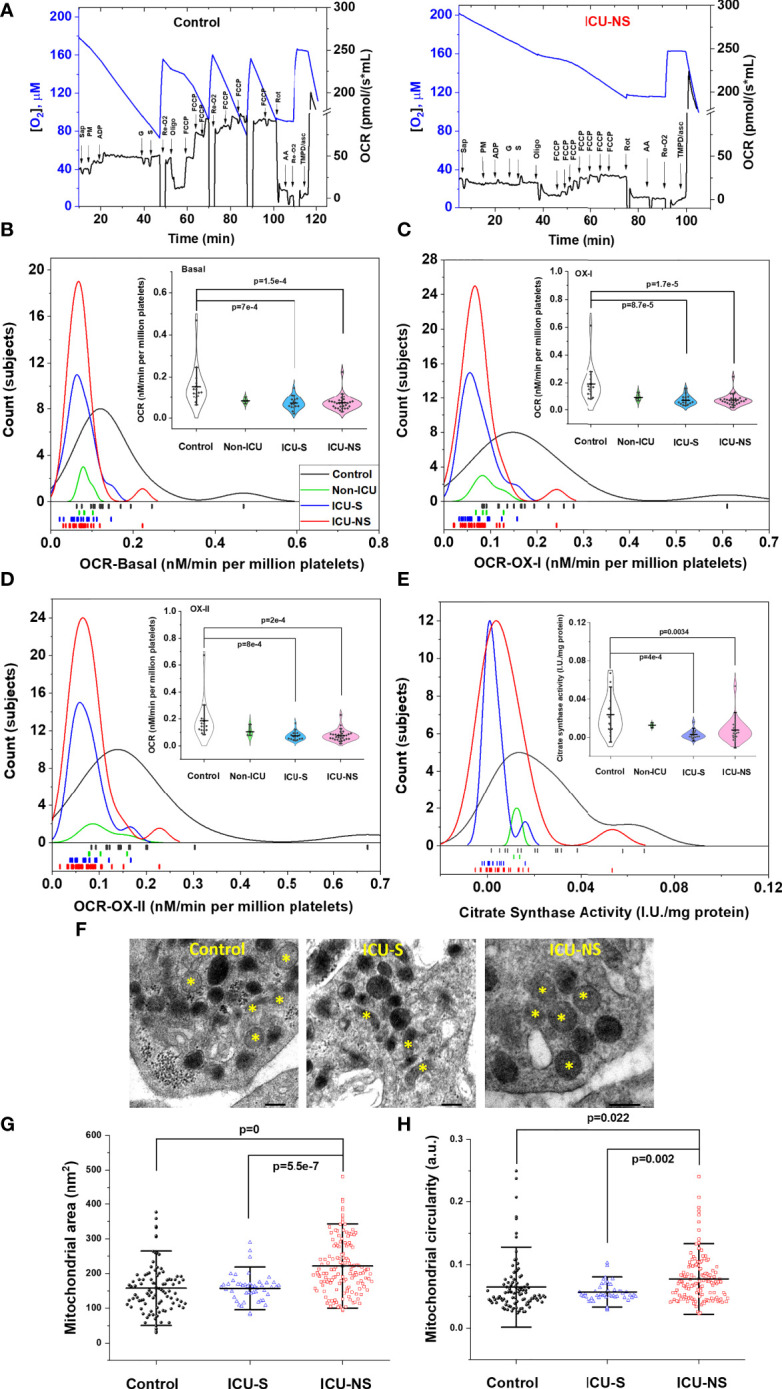
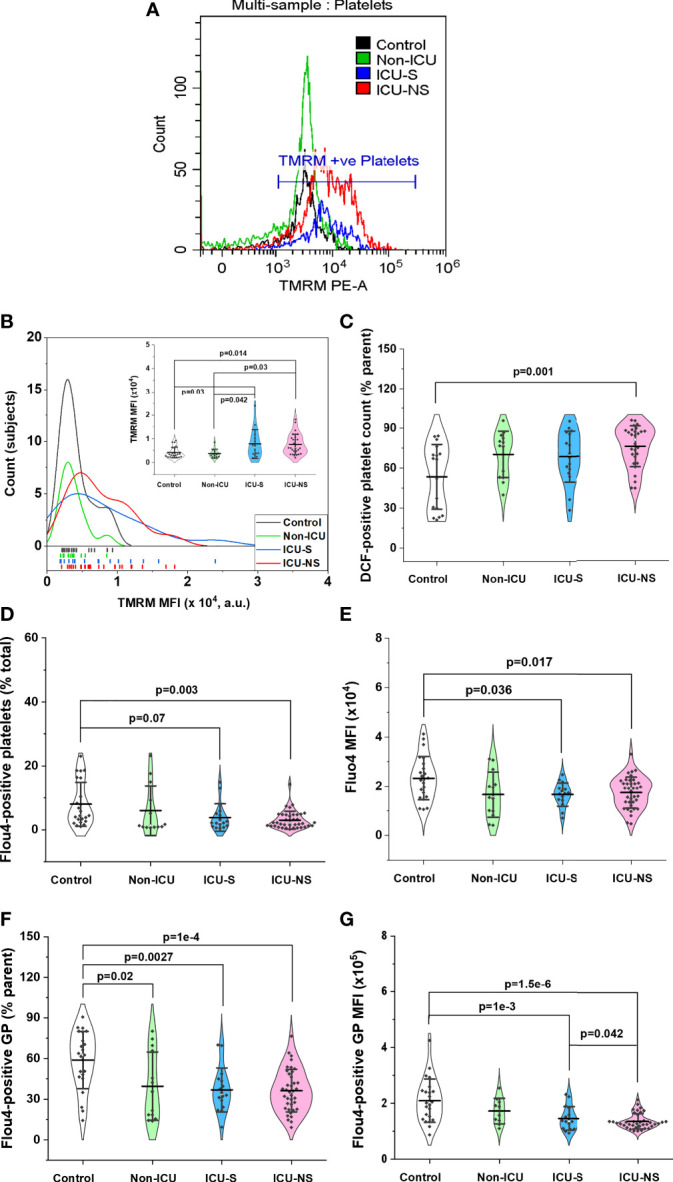
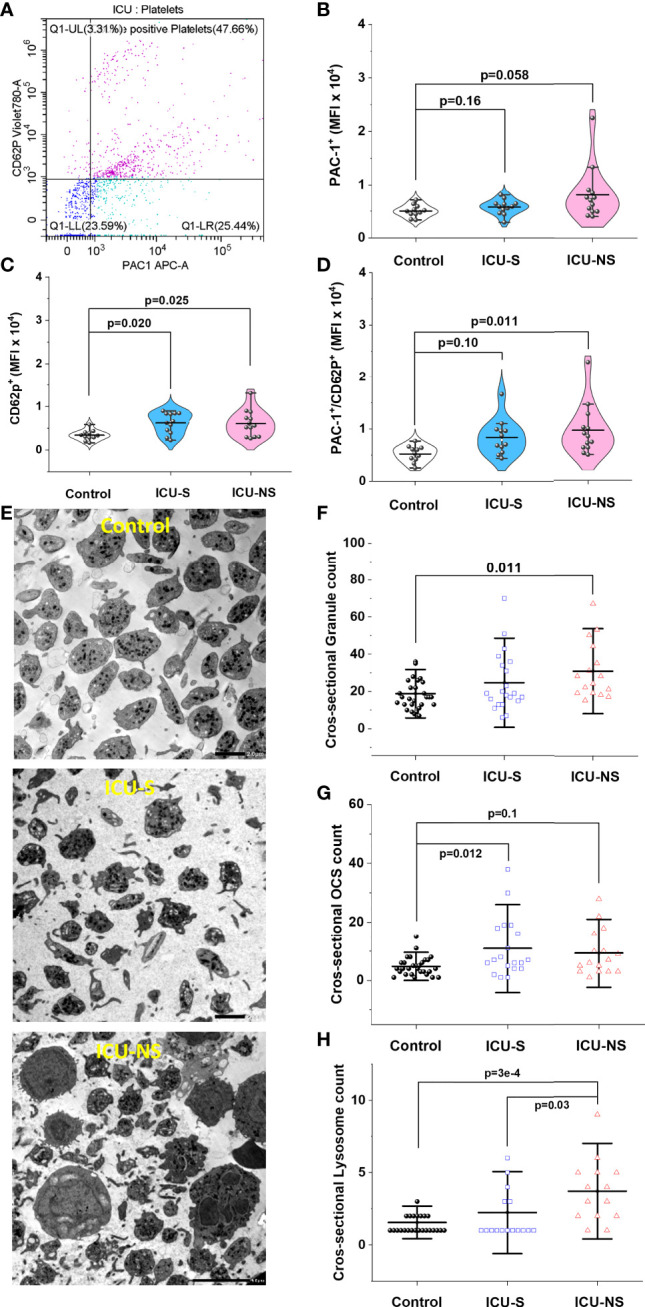
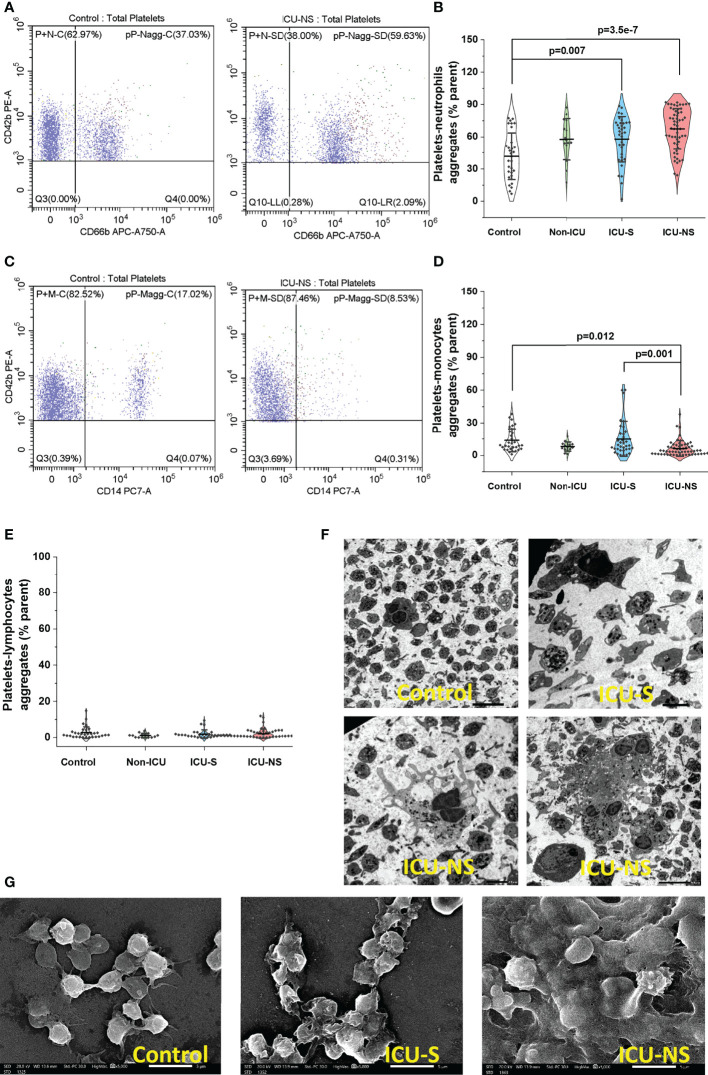
Roles of platelets during infections surpass the classical thrombus function and are now known to modulate innate immune cells. Leukocyte-platelet aggregations and activation-induced secretome are among factors recently gaining interest but little is known about their interplay with severity and mortality during the course of SARS-Cov-2 infection. The aim of the present work is to follow platelets' bioenergetics, redox balance, and calcium homeostasis as regulators of leukocyte-platelet interactions in a cohort of COVID-19 patients with variable clinical severity and mortality outcomes. We investigated COVID-19 infection-related changes in platelet counts, activation, morphology (by flow cytometry and electron microscopy), bioenergetics (by Seahorse analyzer), mitochondria function (by high resolution respirometry), intracellular calcium (by flow cytometry), reactive oxygen species (ROS, by flow cytometry), and leukocyte-platelet aggregates (by flow cytometry) in non-intensive care unit (ICU) hospitalized COVID-19 patients (Non-ICU, n=15), ICU-survivors of severe COVID-19 (ICU-S, n=35), non-survivors of severe COVID-19 (ICU-NS, n=60) relative to control subjects (n=31). Additionally, molecular studies were carried out to follow gene and protein expressions of mitochondrial electron transport chain complexes (ETC) in representative samples of isolated platelets from the studied groups. Our results revealed that COVID-19 infection leads to global metabolic depression especially in severe patients despite the lack of significant impacts on levels of mitochondrial ETC genes and proteins. We also report that severe patients' platelets exhibit hyperpolarized mitochondria and significantly lowered intracellular calcium, concomitantly with increased aggregations with neutrophil. These changes were associated with increased populations of giant platelets and morphological transformations usually correlated with platelets activation and inflammatory signatures, but with impaired exocytosis. Our data suggest that hyperactive platelets with impaired exocytosis may be integral parts in the pathophysiology dictating severity and mortality in COVID-19 patients.

Keywords: COVID-19 severity; Critically ill COVID-19 patients; exocytosis; leukocyte-platelet aggregation; metabolism; mitochondrial function; platelet activation.


Conflict of interest statement

The authors declare that the research was conducted in the absence of any commercial or financial relationships that could be construed as a potential conflict of interest.

Figures

Figure 1
Figure 1
Increased size, granularity, and giant platelets counts are hallmarks in severe COVID-19 patients. Identification of platelets, determination of their counts, size and granularity by whole blood flow cytometry. A discriminator is set to only record events that express a platelet-specific marker (i.e., CD42b). Events are double gated for characteristic light scatter and platelet-specific marker; CD42b expression (A). (B) A scatter and violin diagram showing statistically significant decrease in platelet counts of ICU-hospitalized (survivors, and non-survivors) when compared to non-ICU (mild+moderate) patients (n=31, 15, 34, and 56 for control, non-ICU, ICU-S, ICU-NS; respectively). (C) A distribution and rug plot showing a systematic increase in the mean platelet size with COVID-19 severity. A violin plot within (C) showing a statistically significant increase in the mean FSC (platelet size) in ICU-hospitalized patients relative to control group (n=31, 15, 35, and 57 for control, non-ICU, ICU-S, ICU-NS; respectively). (D) A diagram revealing increased granularity in platelets of non-survivors relative to control platelets (n=31, 15, 35, and 57 for control, non-ICU, ICU-S, ICU-NS; respectively). (E) Representative flow cytometric histograms comparing populations of giant platelets for all groups. (F) When the percentage of giant platelets were compared for all groups, non-survivors’ platelets comprises significantly larger subset of giant platelets (n=30, 15, 35, and 56 for control, non-ICU, ICU-S, ICU-NS; respectively). (G) Representative TEM images for all groups, showing ultrastructural features of peripheral blood cells in fields populated with platelets. The upper-right image and quantification panel revealed more frequently observed giant platelets in the ICU-NS group (n=3 of each group and analyzed platelets = 54, 53, 34 for control, ICU-S, and ICU-NS; respectively). Also, platelets exhibited morphological changes from a resting discoid shape in control subjects to an activated state with numerous pseudopodia in severe COVID-19 patients. Additional images are given in Supplementary Figure S3 . Multiple comparisons were carried out using ANOVA followed by Tukey test and p values are given. Data plotted as mean ± SD.
Figure 2
Figure 2
Metabolic profiling of isolated platelets showed remarkable metabolic depression and impaired metabolic flexibility in severe COVID-19 patients. The OCR (aerobic metabolism) (A) and ECAR (glycolytic flux) (B) were measured in platelets freshly isolated from control, non-ICU, ICU-S, and ICU-NS and normalized to platelets count. (C) ECAR and OCR data were plotted simultaneously to reveal overall relative basal metabolic profiles (no substrate added) for all groups. Metabolic analysis of basal activities showing diminished glycolytic as well as mitochondrial respiratory activities in platelets isolated from ICU-hospitalized COVID-19 patients (n=8, 6, 8, and 21 for control, non-ICU, ICU-S, ICU-NS; respectively). (D) When ATP-linked oxygen consumption were compared for all groups, both non-ICU and ICU groups showed statistically significant metabolic depression relative to control groups (n=8, 11, 8, and 15 for control, non-ICU, ICU-S, ICU-NS; respectively). Glycolytic metabolism (E) and glycolytic capacity (F) were impaired in patients’ platelets compared to control platelets (n=12, 11, 15, and 23 for control, non-ICU, ICU-S, ICU-NS; respectively). (G) ECAR and OCR data were plotted concurrently to compare metabolic flexibility under the inhibition of mitochondrial ATP-synthesis by oligomycin for all groups (n=8, 6, 8, and 21 for control, non-ICU, ICU-S, ICU-NS; respectively). (H) A diagram showing significantly impaired metabolic switch to glycolytic pathway in COVID-19 patients compared to control (ΔECAR, n=7, 6, 7, and 19 for control, non-ICU, ICU-S, ICU-NS; respectively; ΔOCR, n=7, 6, 8, and 21 for control, non-ICU, ICU-S, ICU-NS; respectively). Multiple comparisons were carried out using ANOVA followed by Tukey test and p values are given.
Figure 3
Figure 3
Depressed mitochondrial respiratory activity in severe COVID-19 patients. (A) Representative figures of the O2 flux per volume measured by high-resolution OROBOROS O2k respirometer in permeabilized platelets for a control and an ICU-NS subjects. Distribution and rug plots showing reduction in mitochondrial respiration of ICU-hospitalized patients’ platelets at basal (B) or upon Complex-I (C) or complex-II (D) stimulations. Violin plots within (B–D) showing a statistically significant decrease in the oxygen consumption rate at basal (B) or during Complex-I (C) or complex-II stimulations (D) in ICU-hospitalized patients relative to control group (n=15, 4, 17, and 29 for control, non-ICU, ICU-S, ICU-NS; respectively). (E) Citrate synthase activity in platelets was significantly decreased in ICU-hospitalized patients relative to control group (n=15, 2, 15, and 21 for control, non-ICU, ICU-S, ICU-NS; respectively). (F) Representative TEM images showing changes in mitochondria morphology in platelets of control and ICU-hospitalized patients. Additional images are given in Supplementary Figure S3 . Quantification diagrams revealed significantly increased average cross-sectional area (G) and circularity (H) in platelets mitochondria from the ICU-NS group relative to control and ICU-S. groups (n=1-3 for each group and analyzed mitochondria n= 96, 48, 144 for control, ICU-S, ICU-NS; respectively). Multiple comparisons were carried out using ANOVA followed by Tukey test and p values are given. Data plotted as mean ± SD.* denotes identified mitochondria.
Figure 4
Figure 4
Changes in platelets’ mitochondrial transmembrane potential, ROS levels, and intracellular calcium in relation to severity and mortality outcomes. (A) Representative flow cytometric histograms comparing TMRM fluorescence for all groups. (B) When the distribution of TMRM mean fluorescence intensity were compared for all groups, both ICU-S and ICU-NS showed hyperpolarized mitochondria (n=23, 12, 16, and 29 for control, non-ICU, ICU-S, ICU-NS; respectively). DCF staining revealed increased levels of ROS in platelets (% parent) (C) of ICU-NS group (n=17, 13, 16, and 28 for control, non-ICU, ICU-S, ICU-NS; respectively). Quantification diagrams revealed significantly decreased counts of calcium-positive platelets (D), n=23, 13, 16, and 38 for control, non-ICU, ICU-S, ICU-NS; respectively) and intracellular Ca2+ levels (E), n=23, 13, 15, and 37 for control, non-ICU, ICU-S, ICU-NS; respectively) in platelets from ICU -hospitalized groups relative to control group. When the counts of calcium-positive giant platelets (F) and intracellular Ca2+ levels in giant platelets (G) were compared for all groups, ICU -hospitalized groups showed statistically significant increase in calcium-positive cell count and mean fluorescence intensity relative to control group (n=23, 13, 16, and 38 for control, non-ICU, ICU-S, ICU-NS; respectively). Multiple comparisons were carried out using ANOVA followed by Tukey test and p values are given. Data plotted as mean ± SD.
Figure 5
Figure 5
Increased platelet activation in severe COVID-19 patients. (A) Representative flow cytometric scatter diagram of PAC1 and CD62P double positive populations of platelets for severe patient. (B) A violin plot showing a trend of increase in PAC1 expression in ICU-hospitalized patients relative to control group (n=11, 12, and 13 for control, ICU-S, ICU-NS; respectively). (C) A violin plot showing significant increase in CD62P mean fluorescence intensity in both ICU-S and ICU-NS groups when compared to control group (n=11, 12, and 13 for control, ICU-S, ICU-NS; respectively). (D) When the MFI of CD62P/PAC1 were compared for all groups, only platelets of ICU-NS showed significantly higher MFI of double positive populations when compared to control group (n=11, 12, and 13 for control, ICU-S, ICU-NS; respectively). (E) Representative TEM images for control, ICU-S and ICU-NS groups showing a shift from a resting discoid shape in control subjects to an activated state with numerous pseudopodia in severe COVID-19 patients. (F) A diagram showing a significant increase in total granule counts (α- + dense-granules) in ICU-NS group compared to control group (n=3-4 subjects from each group and analyzed platelets = 31, 21, 16 for control, ICU-S, and ICU-NS; respectively). (G) A diagram showing a significant increase in open canalicular structures (OCS) in the ICU-S group relative to control group (n=3-4 subjects from each group and analyzed platelets = 29, 19, 16 for control, ICU-S, and ICU-NS; respectively). (H) A diagram showing significantly increased count of lysosomes per platelet of the ICU-NS group relative to control and ICU-S groups (n=3-4 of each group and analyzed platelets = 27, 17, 14 for control, ICU-S, and ICU-NS; respectively). Multiple comparisons were carried out using ANOVA followed by Tukey test and p values are given. Data plotted as mean ± SD.
Figure 6
Figure 6
Platelet activation in severe COVID-19 patients is associated with increased tendency to aggregate with neutrophils. (A) Representative flow cytometric scatter plots of CD42b/CD66b double positive populations in control and ICU-NSgroups. (B) A violin plot showing significant increase in the percentage of CD42b/CD66b double positive populations in ICU patients (n=31, 15, 35, and 57 for control, non-ICU, ICU-S, ICU-NS; respectively). (C) Representative flow cytometric diagrams of CD42b/CD14 double positive populations in control and ICU (NS) groups. (D) A violin plot showing significant decrease in the percentage of CD42b/CD14 double positive populations in ICU-NS relative to controls, and relative to ICU-S group (n=31, 15, 35, and 57 for control, non-ICU, ICU-S, ICU-NS; respectively). (E) When the platelet-lymphocyte aggregation (CD42b/CD3 double positive populations) were compared for all groups, no statistically significant differences were observed between control, non-ICU, ICU-S, and ICU-NS (n=31, 15, 28, and 54 for control, non-ICU, ICU-S, ICU-NS; respectively). (F) Representative TEM (F) and SEM (G) images showing enhanced homo- and heterotypic aggregate formation in the ICU-NS group. Multiple comparisons were carried out using ANOVA followed by Tukey test and p values are given. Data plotted as mean ± SD.

Similar articles

Cited by

References

    1. Phillips N. The coronavirus is here to stay - here’s what that means. Nature (2021) 590:382–4. doi: 10.1038/D41586-021-00396-2 - DOI - PubMed
    1. Barale C, Melchionda E, Morotti A, Russo I. Prothrombotic phenotype in COVID-19: Focus on platelets. Int J Mol Sci (2021) 22:13638. doi: 10.3390/IJMS222413638 - DOI - PMC - PubMed
    1. Rezel-Potts E, Douiri A, Sun X, Chowienczyk PJ, Shah AM, Gulliford MC. Cardiometabolic outcomes up to 12 months after COVID-19 infection. a matched cohort study in the UK. PloS Med (2022) 19:e1004052. doi: 10.1371/JOURNAL.PMED.1004052 - DOI - PMC - PubMed
    1. Ali RA, Wuescher LM, Worth RG. Platelets: essential components of the immune system. Curr Trends Immunol (2015) 16:65. - PMC - PubMed
    1. Koupenova M, Clancy L, Corkrey HA, Freedman JE. Circulating platelets as mediators of immunity, inflammation, and thrombosis. Circ Res (2018) 122:337–51. doi: 10.1161/CIRCRESAHA.117.310795 - DOI - PMC - PubMed

Publication types