. 2022 Oct 28;4(12):798-815.
doi: 10.1096/fba.2022-00071. eCollection 2022 Dec.

Bone marrow-derived extracellular vesicles modulate the abundance of infiltrating immune cells in the brain and exert an antiviral effect against the Japanese encephalitis virus

Affiliations

Bone marrow-derived extracellular vesicles modulate the abundance of infiltrating immune cells in the brain and exert an antiviral effect against the Japanese encephalitis virus

Naina Soni et al. FASEB Bioadv. .

Abstract

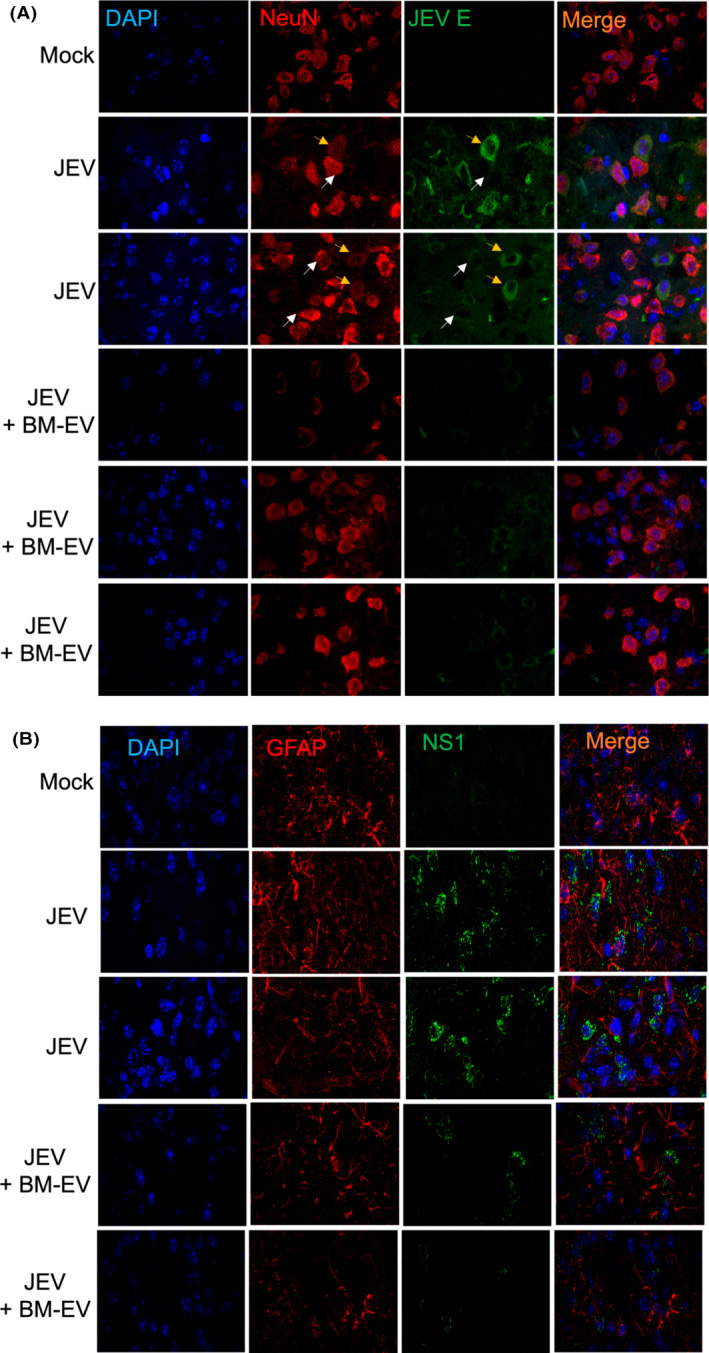
Mesenchymal stem cells (MSCs) have regenerative capacity and have reported a beneficial effect on the Japanese encephalitis virus (JEV) in an encephalitis model. However, the MSCs do not cross the blood-brain barrier and have other disadvantages limiting their therapeutic utility scope. Recently, there has been a shift in concept from a cell-based to a cell-free approach using MSCs-derived extracellular vesicles (MSC-EVs). The MSC-EVs retain regenerative and immunomodulatory capacity as their parental cells. However, the role of MSC-EVs in limiting JEV pathology remains elusive. In this study, we have used Bone marrow (BM)-derived EV (BM-EVs) and assessed their effect on JEV replication and pathogenesis in primary neuronal stem cells and a murine model. The in vitro and in vivo studies suggested that BM-derived EVs delay JEV-induced symptoms and death in mice, improve the length of survival, accelerate neurogenesis in primary neuronal stem cells, reduce JEV-induced neuronal death, and attenuate viral replication. BM-EVs treatment upregulated interferon-stimulated genes. Flow cytometry analysis revealed a reduction in the frequency of macrophages. At the same time, CD4+ T cells and neutrophils were significantly augmented, accompanied by the alteration of cytokine expression with the administration of BM-EVs, reinforcing the immunomodulatory role of EVs during JEV-induced encephalitis. In conclusion, our study describes the beneficial role of BM-EVs in limiting JEV pathology by attenuating virus replication, enhancing antiviral response, and neurogenesis in primary neuronal stem cells. However, BM-EVs do not seem to protect BBB integrity and alter immune cell infiltration into the treated brain.

Keywords: EVs; JEV; MSC; Neurospheres; antiviral genes.


Conflict of interest statement

The authors have no relevant financial or nonfinancial interests to disclose.

Figures

FIGURE 1
FIGURE 1
Effect of conditioned media from different Mesenchymal stem cell sources and their paracrine effect on JEV. (A) C17.2 cells were infected with JEV at MOI = 5 and incubated with conditioned media at two concentrations, 250 and 750 μl, for 24 h. Cells were lysed, and the viral load was measured using RT‐PCR. (B) Trans‐well assay was performed in 12‐well trans plates of pore size 0.4 μm. C17.2 cells were seeded in the upper compartment of the trans‐well and infected with JEV at MOI 5 for 1 h. Conditioned media (CM) of two different concentrations from all three sources was poured into the lower compartment of the trans well plate. After 24 h incubation, cells were harvested and processed for RT‐PCR to check the viral load. All qRT‐PCR data are represented as mean ± SD, *p < 0.05, **p < 0.001. (C) Cells (C17.2) were infected at MOI = 5 and incubated with 750 μl (BM‐CM or AD‐CM) + 250 μl of DMEM for 24 h. Immunofluorescence was performed to visualize the virus infectivity posttreatment in cells. The virus was marked using NS1 (green), Nestin (red) stem cell marker, and the nucleus was stained using DAPI (blue). AD, Adipose tissue; BM, Bone marrow; CM, Conditioned media.
FIGURE 2
FIGURE 2
(A) Characterization of BM‐MSCs. (i) Phase‐contrast microscopy of MSCs (magnification 10×). (ii) Tri‐lineage differentiation potential of MSCs showing osteogenesis as determined by Alizarin red staining of the extracellular mineralized matrix, adipogenesis as determined by Oil red O staining of lipid droplets, and Chondrogenesis as determined by Alcian blue staining of proteoglycans. (iii) Surface marker profiling by Flow Cytometer. (B) Characterization of EVs (i) EVs size distribution analysis using nanoparticle tracking analysis (NTA). (ii) Morphological analysis of EVs by Transmission Electron Microscope (TEM). Red arrows were indicating cup‐shaped EVs (Bar = 100 nm; 29 KX) .(iii) Expression of EVs‐specific markers CD63 and ALIX by western blotting.
FIGURE 3
FIGURE 3
Effect of bone marrow‐mesenchymal stem cells (BM‐MSCs) derived conditioned media (CM) and EVs on JEV replication. (A) MTT assay was performed to check the cell viability at different concentrations of EVs. (B) Cells were incubated with PKH67‐labeled EVs (green) and visualized under the microscope at indicated time points. DAPI (blue) was used to stain the nucleus. (C) Flow cytometry analysis showed an increase in green fluorescence‐positive cells over time, suggesting EV uptake by the cells. (D, E) Cells were infected with JEV followed by incubation with EVs derived from BM or AD at concentrations of 10, 20, and 30 μg for different incubation hours, and viral RNA was quantified using RT‐PCR. GAPDH mRNA level was used for normalization. (F) Mice were injected with JEV at (107 pfu/ml) and treated with 50 μg of EVs through the intra‐cranial route postinfection days one and day 3. Viral RNA was quantified post 24 h of symptoms onset. All qRT‐PCR data are represented as mean ± SD; *p < 0.05, **p < 0.001.
FIGURE 4
FIGURE 4
The effect of BM‐EVs on the size, growth, and functionality of the neurospheres (NS). The neurospheres (NS) were isolated from the subventricular zone of mice and cultured in vitro. The NS were infected with JEV and treated with different concentrations of EVs. (A) NS were incubated with PKH67 labeled BM‐EVs to monitor EV uptake and visualized under the confocal microscope after indicated times of incubation. (C) Spheres were visualized under the light microscope, and the sphere size and growth were checked. Significantly large and a greater number of spheres were observed in a higher dose of treatment. Scale bar = 10 μm. (B, D) Spheres were lysed to check viral RNA and various neurogenesis markers through RT‐PCR to assess the neurogenesis profile post‐BM‐EVs treatment. Significantly less viral load was observed in the higher dose group (B). The expression of DCX, GFAP, and Ngn1 is increased substantially in the treatment group (D). All qRT‐PCR data are represented as mean ± SD; *p < 0.05, ***p < 0.0005.
FIGURE 5
FIGURE 5
Status of virus in C57BL/6 mice post‐BM‐EVs treatment. (A) Schematic diagram of BM‐EVs treatment in JEV‐infected C57BL/6 mice. C57BL/6 mice (3–4 weeks, n = 12) old inoculated with JEV at (107 pfu/ml) and treated with BM‐EVs at the dosage of 50 μg twice a day post 12 h of infection till day 7. The panel shows the Kaplan–Meier survival curves of animals infected and treated with BM‐EVs using a log rank. (B, C) The brains were harvested at different time points after the appearance of symptoms, and the lysate was prepared. Representative Western blots showed the expression level of JEV (NS1), and GAPDH was used as an internal control. (D) The infected brains were homogenized in MEM, and the supernatant was collected for the virus titration. The plaque assay was performed from the supernatant of both groups. The bars depicted the data from 5 subjects in each group. All qRT‐PCR data are represented as mean ± SD; ***p < 0.0005.
FIGURE 6
FIGURE 6
Effect of BM‐EVs treatment on neuronal infectivity and astrocyte activation upon JEV infection. C57BL/6 mice were infected with JEV (107 pfu) through the intraperitoneal route followed by BM‐EVs administration. Twenty‐four‐hour postsymptoms onset brains were harvested, and sections were prepared. (A) Brain Sections from all three groups were subjected to staining for the viral expression JEV E (green), Neuron (red), and DAPI (blue) for the nucleus. Arrows (white and yellow) were used to show the inverse expression of NeuN and JEV protein. (B) Cryopreserved sections were processed for staining with the viral marker (NS1, green), Astrocyte marker (GFAP, red), and DAPI for the nucleus. All the images are captured at 60× magnification. Scale bar = 10 μm.
FIGURE 7
FIGURE 7
Pathological effect of JEV in C57BL/6 mice brains in mock, infected, and treated brain sections. Representative images show the staining for Hematoxylin and Eosin. The left panel in the JEV sections shows the signature of JEV infection, like perivascular cuffing, lesions, and immune cell infiltration. Comparatively, fewer lesions and cuffing were observed in BM‐EVs treated sections. The rightmost panel shows the viral expression NS1 stained with immune peroxidase counterstained with hematoxylin. Images were captured at 40× magnification.
FIGURE 8
FIGURE 8
Caspase activation in JEV‐infected and BM‐EVs‐treated C57BL/6 mice brain sections. Sections were thawed and processed for viral antigen detection and caspase activation. Viral antigen was stained with JEV E antibody (Green), and caspase activation was shown using Caspase 3 antibody (red). DAPI (blue) was used to stain the nucleus. All the images were captured at 60× oil magnification. Scale bar = 20 μm.
FIGURE 9
FIGURE 9
Expression pattern of interferon‐stimulated genes and cytokines in JEV‐infected and BM‐EVs treated mice brain. (A) C57BL/6 mice were inoculated with JEV (107 pfu) and treated with 50 μg of EV protein twice a day for 7 days. Brains were harvested post symptoms severity and processed for RNA isolation and protein lysate preparation. ISGs expression was quantified using RT‐PCR by using GAPDH as an internal control. (B) The cytokine expression pattern was checked by flow cytometry using a cytokine bead array kit. The data were analyzed using FCAP and qognit software. All qRT‐PCR and protein data are represented as mean ± SD; *p < 0.05.
FIGURE 10
FIGURE 10
Infiltrating immune cells profile of JEV‐infected and treatment group 24 h post symptoms onset. C57BL/6 (n = 5) were infected with JEV, followed by treatment. Brains were harvested 24 h postsymptom onset, and the sample was prepared for FACS acquisition. (A, B) Cells were stained for microglia and macrophages markers and categorized as per the expression pattern of cell surface markers CD11b, CD86, and CD45. (C) Expression pattern of monocytes and neutrophils was checked by staining them with Ly6C and Ly6G. (D) Bar graphs showed the expression pattern of the T cell population. Each dot represents cells from individual mice. *p < 0.005.
FIGURE 11
FIGURE 11
Schematic diagram representing the effect of BM‐EVs treatment on Japanese Encephalitis virus replication and immune response.

Similar articles

Cited by

References

    1. Campbell GL, Hills SL, Fischer M, et al. Estimated global incidence of Japanese encephalitis: a systematic review. Bull World Health Organ. 2011;89(766–774):774A‐774E. - PMC - PubMed
    1. Banerjee A, Tripathi A. Recent advances in understanding japanese encephalitis. F1000Res. 2019;8:1915. - PMC - PubMed
    1. Staff NP, Jones DT, Singer W. Mesenchymal stromal cell therapies for neurodegenerative diseases. Mayo Clin Proc. 2019;94:892‐905. - PMC - PubMed
    1. Torrente Y, Polli E. Mesenchymal stem cell transplantation for neurodegenerative diseases. Cell Transplant. 2008;17:1103‐1113. - PubMed
    1. Zanier ER, Pischiutta F, Riganti L, et al. Bone marrow mesenchymal stromal cells drive protective M2 microglia polarization after brain trauma. Neurotherapeutics. 2014;11:679‐695. - PMC - PubMed

LinkOut - more resources