. 2022 Nov 21:16:1066312.
doi: 10.3389/fncel.2022.1066312. eCollection 2022.

A rapid in vitro assay for evaluating the effects of acetylcholinesterase inhibitors and reactivators in the rat basolateral amygdala

Affiliations

A rapid in vitro assay for evaluating the effects of acetylcholinesterase inhibitors and reactivators in the rat basolateral amygdala

Jeffrey S Thinschmidt et al. Front Cell Neurosci. .

Abstract

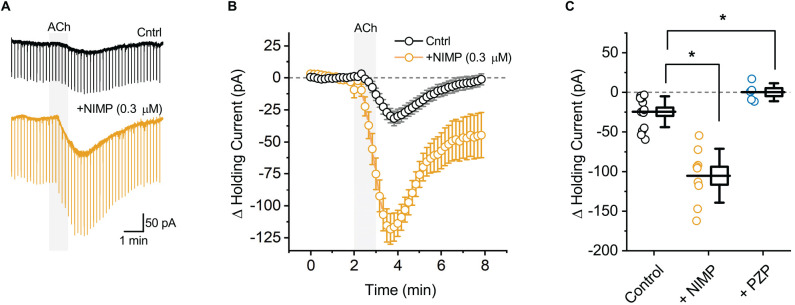
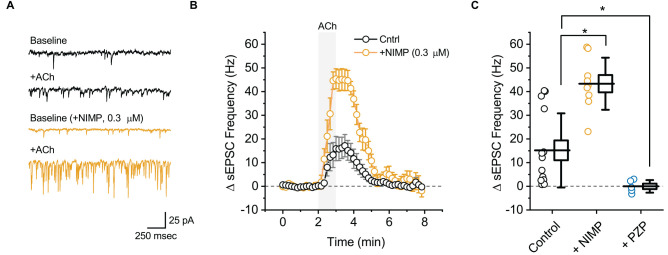
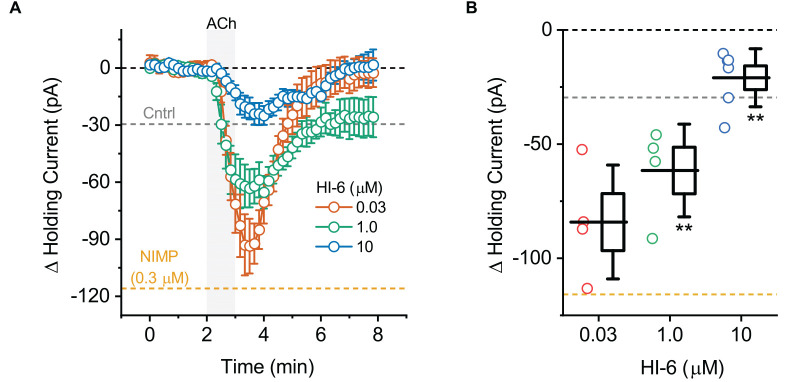
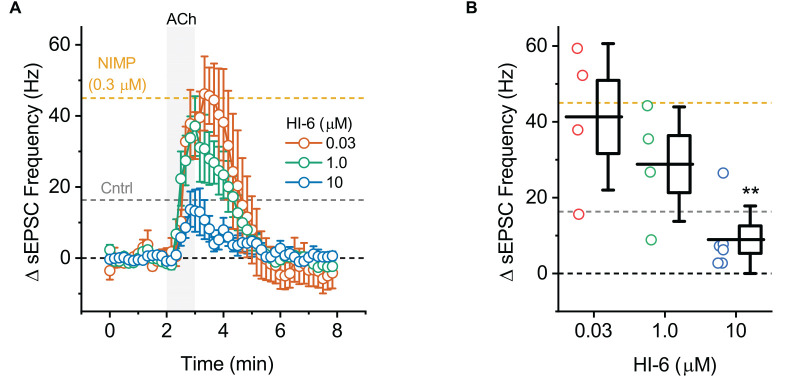
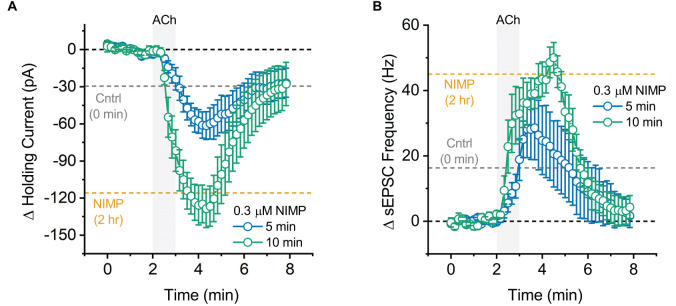
We established a novel brain slice assay to test the ability of acetylcholinesterase (AChE) reactivators to prevent ACh-induced M1 muscarinic acetylcholine receptor (mAChR) dependent hyperexcitability observed after exposure to the organophosphate (OP)-based AChE inhibitor and sarin surrogate 4-nitrophenyl isopropyl methylphosphonate (NIMP). Whole-cell patch clamp recordings were used to evaluate the response of pyramidal neurons in the rat basolateral amygdala (BLA) to brief (1 min) bath application of ACh (100 μM), either in control conditions, or after exposure to NIMP ± an AChE reactivator. Bath application of ACh produced atropine- and pirenzepine-sensitive inward currents in voltage clamped BLA pyramidal neurons, and increased the frequency of spontaneous EPSCs, suggesting robust activation of M1 mAChRs. Responses to ACh were increased ~3-5 fold in slices that had been preincubated in NIMP, and these effects were reversed in a concentration dependent manner by exposure to a commercially available AChE reactivator. The current work outlines a simple assay that can be used to evaluate the efficacy of both known and novel AChE reactivators in an area of the limbic system that likely contributes to seizures after acute exposure to OP-based AChE inhibitors.

Keywords: HI-6; NIMP; acetylcholine; acetylcholinesterase; basolateral amygdala; electrophysiology; organophosphates; status epilepticus.


Conflict of interest statement

JDT was employed by the company Alchem Laboratories Corporation. MAK was a consultant for the company Alchem Laboratories Corporation. The remaining authors declare that the research was conducted in the absence of any commercial or financial relationships that could be construed as a potential conflict of interest.

Figures

Figure 1
Figure 1
ACh-induced changes in holding current in BLA pyramidal neurons can be used to quantify the effects of central AChE inhibition. (A) Representative holding current traces from BLA pyramidal neurons illustrating the response to acute bath application of 100 μM ACh (shaded region) in control conditions (black) and following exposure to NIMP (0.3 μM, orange). Rapid transients observed in these traces were produced by a membrane test delivered every 10 s (see “Materials and methods” Section). (B) ACh-induced change in holding current over time as recorded in neurons from control slices (n = 14, open black circles) and in neurons from slices preincubated in 0.3 μM NIMP (open orange circles, n = 9). ACh was bath applied from 2 to 3 min (gray shaded area). Error bars represent the SEM. (C) Summary data illustrating the ACh-induced change in holding current, observed from 3 to 4 min as plotted in panel (B), for each cell in the control and NIMP datasets (open black and orange circles respectively). Blue circles illustrate the effect of ACh on holding current in neurons from control slices, as observed in the presence of 1 μM PZP. For each group, box height illustrates the SEM, whiskers illustrate the SD, and horizontal lines highlight the group means. Asterisks indicate p < 0.05.
Figure 2
Figure 2
ACh-induced increases in sEPSC frequency in BLA pyramidal neurons can be used to quantify the effects of central AChE inhibition. (A) Top two traces (black) illustrate the effect of bath applied ACh (100 μM for 1 min) on sEPSCs as observed in a representative BLA pyramidal neuron voltage clamped at −70 mV in control conditions. Next two traces (orange) are representative of data obtained when an identical experiment was performed in a slice that was preincubated in 0.3 μM NIMP. (B) ACh-induced change in sEPSC frequency over time as recorded in neurons from control slices (n = 14, open black circles) and from neurons in slices preincubated in 0.3 μM NIMP (open orange circles, n = 9). ACh (100 μM) was bath applied from 2 to 3 min (gray shaded area). Error bars represent the SEM. (C) Summary data illustrating the ACh-induced change in sEPSC frequency, observed from 3 to 4 min as plotted in panel (B), for each cell in the control and NIMP datasets (open black and orange circles respectively). Blue circles (PZP) illustrate the effect of ACh on sEPSC frequency in neurons from control slices, as observed in the presence of 1 μM PZP. For each group, box height illustrates the SEM, whiskers illustrate the SD, and horizontal lines highlight the group means. Asterisks indicate p < 0.01.
Figure 3
Figure 3
ACh-induced changes in holding current in BLA pyramidal neurons can be used to quantify the effectiveness of AChE reactivators in slices preincubated with NIMP. (A) ACh-induced change in holding current over time as recorded in BLA pyramidal neurons from slices preincubated in 0.3 μM NIMP, and then treated with various concentrations of AChE reactivator HI-6 as indicated in the legend. (B) Summary data illustrating the ACh-induced change in holding current, observed from 3 to 4 min as plotted in panel (A), for each cell tested. Group colors are matched to the panel (A) legend. For each group, box height illustrates the SEM, whiskers illustrate the SD, and horizontal lines highlight the group means. In both panels, the dashed gray and orange lines highlight the mean ACh-induced change in holding current as observed at 3–4 min in BLA pyramidal neurons from control and NIMP datasets as illustrated in Figure 1B. Dashed black line highlights 0 pA. **Indicates p ≤ 0.05 compared to responses observed in slices treated identically with NIMP but not exposed to HI-6. See text of “Results” Section and Table 1 for further details.
Figure 4
Figure 4
ACh-induced increases in sEPSC frequency in BLA pyramidal neurons can be used to quantify the effectiveness of AChE reactivators in slices preincubated with NIMP. (A) ACh-induced change in sEPSC frequency over time as produced by acute bath application of ACh in BLA pyramidal neurons preincubated in 0.3 μM NIMP, and then treated with various concentrations of AChE reactivator HI-6 as indicated in the legend. See “Results”/”Materials and methods” Section for further details. (B) Summary data illustrating the ACh-induced change in sEPSC frequency, observed from 3 to 4 min as plotted in panel (A), for each cell tested. For each group, box height illustrates the SEM, whiskers illustrate the SD, and horizontal lines highlight the group means. In both panels, the dashed gray and orange lines highlight the mean ACh-induced change in sEPSC frequency as observed at 3–4 min in BLA pyramidal neurons from control and NIMP datasets as illustrated in Figure 2B. Dashed black line highlights 0 pA. **Indicates p ≤ 0.05 compared to responses observed in slices treated identically with NIMP but not exposed to HI-6. See text of results and Table 1 for further details.
Figure 5
Figure 5
Maximal effect of 0.3 μM NIMP on ACh-evoked responses is apparent after 10 min, but not 5 min, of preincubation. (A) ACh-induced change in holding current over time as produced by acute bath application of ACh in BLA pyramidal neurons preincubated in 0.3 μM NIMP for 5 vs. 10 min (open blue vs. open green circles respectively). (B) ACh-induced change in sEPSC frequency produced by acute bath application of ACh in BLA pyramidal neurons preincubated in 0.3 μM NIMP for 5 vs. 10 min (open blue vs. open green circles respectively). In both panels, the dashed gray and orange lines highlight the mean ACh-induced response as observed at 3–4 min in BLA pyramidal neurons from control and 0.3 μM NIMP datasets as illustrated in Figures 1; 2B. Dashed black lines highlight 0 pA or 0 Hz. Error bars represent the SEM.

Similar articles

Cited by

References

    1. Abou-Donia M. B., Siracuse B., Gupta N., Sokol A. S. (2016). Sarin (GB, O-isopropyl methylphosphonofluoridate). neurotoxicity: critical review. Crit. Rev. Toxicol. 46, 1–31. 10.1080/10408444.2016.1220916 - DOI - PMC - PubMed
    1. Albuquerque E. X., Pereira E. F. R., Aracava Y., Fawcett W. P., Oliveira M., Randall W. R., et al. . (2006). Effective countermeasure against poisoning by organophosphorus insecticides and nerve agents. Proc. Nat. Acad. Sci. U S A 103, 13220–13225. 10.1073/pnas.0605370103 - DOI - PMC - PubMed
    1. Alkondon M., Albuquerque E. X., Pereira E. F. R. (2013). Acetylcholinesterase inhibition reveals endogenous nicotinic modulation of glutamate inputs to CA1 stratum radiatum interneurons in hippocampal slices. Neurotoxicology 36, 72–81. 10.1016/j.neuro.2013.02.005 - DOI - PMC - PubMed
    1. Angrand L., Takillah S., Malissin I., Berriche A., Cervera C., Bel R., et al. . (2021). Persistent brainwave disruption and cognitive impairment induced by acute sarin surrogate sub-lethal dose exposure. Toxicology 456:152787. 10.1016/j.tox.2021.152787 - DOI - PubMed
    1. Antonijevic B., Stojiljkovic M. P. (2007). Unequal efficacy of pyridinium oximes in acute organophosphate poisoning. Clin. Med. Res. 5, 71–82. 10.3121/cmr.2007.701 - DOI - PMC - PubMed