

Published Erratum
doi: 10.3389/fphys.2022.1077956.
eCollection 2022.
Corrigendum: Resetting the circadian clock of Alzheimer's mice via GLP-1 injection combined with time-restricted feeding
Affiliations
- PMID: 36479341
- PMCID: PMC9720383
- DOI: 10.3389/fphys.2022.1077956
Item in Clipboard
Published Erratum
Corrigendum: Resetting the circadian clock of Alzheimer's mice via GLP-1 injection combined with time-restricted feeding
Front Physiol.
.
Abstract
[This corrects the article DOI: 10.3389/fphys.2022.911437.].
Keywords: Alzheimer’s disease; amyloid-β; circadian rhythm; glucagon-like peptide-1; time-restricted feeding.
Copyright © 2022 Dong, Cheng and Zhao.
Figures
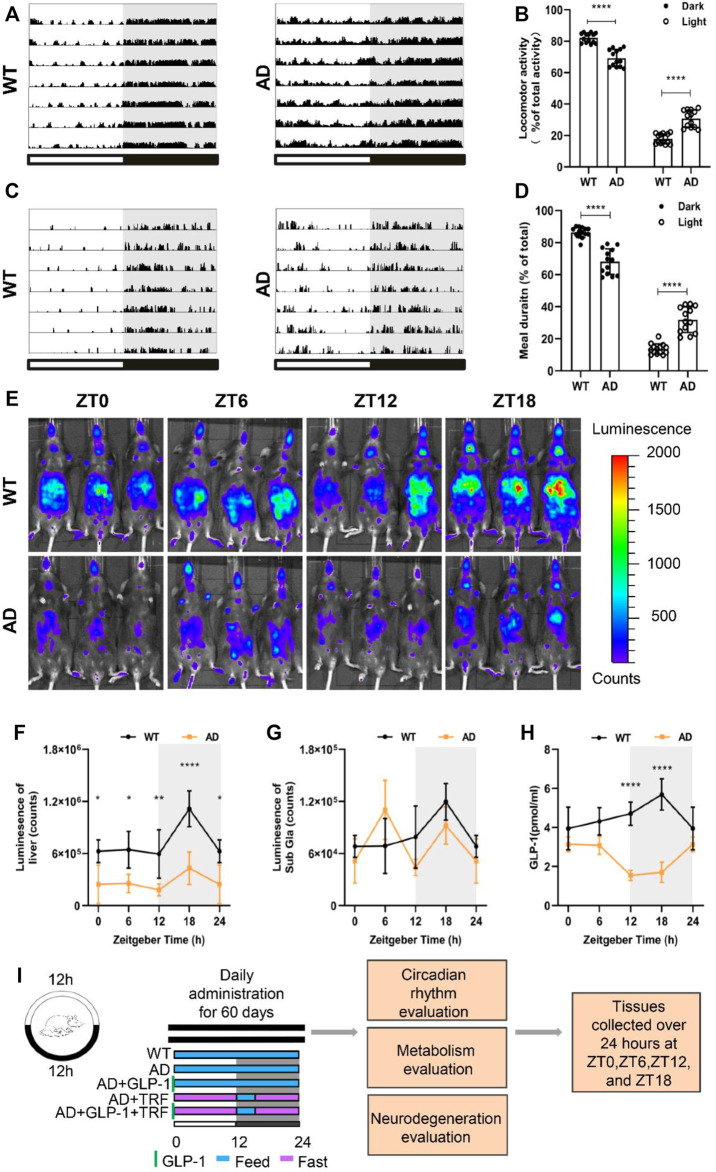
Alzheimer’s disease mice exhibit circadian rhythm disturbances. (A) Representative locomotor activity records of 5 × FAD mice (AD) and wildtype mice (WT), respectively. Locomotor activity was defined as the moving distance per unit time (2 min). Each horizontal line represents 24 h. Periods of darkness are indicated by grey backgrounds. The black and white bars on the button indicate 12 h-dark and 12 h-light periods, respectively. (B) Percentage of the locomotor activity in the dark and light/total activity (24 h). n ⁼ 7 per group, ****p 0.0001, using two-way ANOVA followed by Sidak t test. (C) Representative meal duration records of two groups. (D) Percentage of the meal duration in the dark and light/total meal duration (24 h). n ⁼ 7 per group, ****p 0.0001, using Two-Way ANOVA followed by Sidak t test. (E) Representative photographs of PER2:LUC mice in vivo monitoring from each time point at 6 h intervals. (F,G) Raw photon count data of individual bioluminescence rhythms from E. n ⁼ 3 per group, n ⁼ 3 per group, *p 0.015, **p < 0.01 using Two-Way ANOVA test. (H) GLP-1 secretion levels in both groups. (I) The protocol design of our study.
Erratum for
-
Resetting the circadian clock of Alzheimer's mice via GLP-1 injection combined with time-restricted feeding.Front Physiol. 2022 Aug 24;13:911437. doi: 10.3389/fphys.2022.911437. eCollection 2022. Front Physiol. 2022. PMID: 36148311 Free PMC article.
Publication types
LinkOut - more resources
Full Text Sources