

Similarities between maternal and fetal RR interval tachograms and their association with fetal development
- PMID: 36479345
- PMCID: PMC9721082
- DOI: 10.3389/fphys.2022.964755
Similarities between maternal and fetal RR interval tachograms and their association with fetal development
Abstract
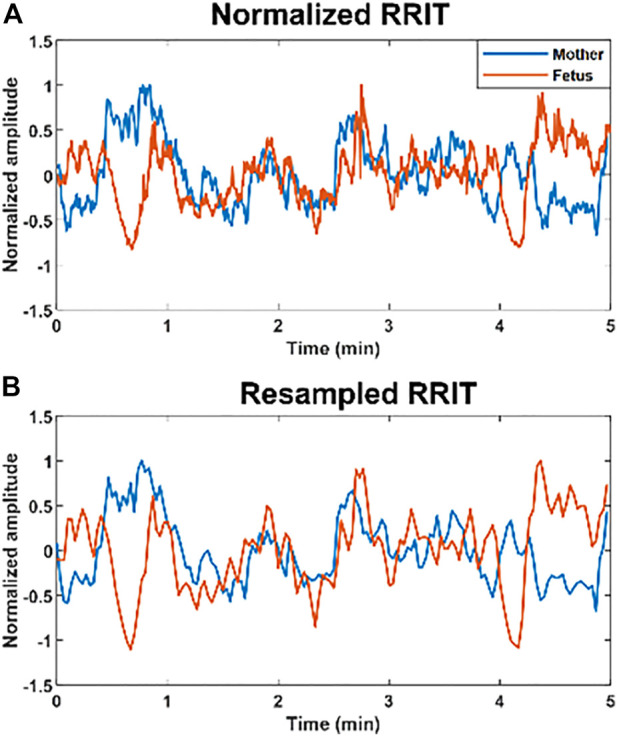
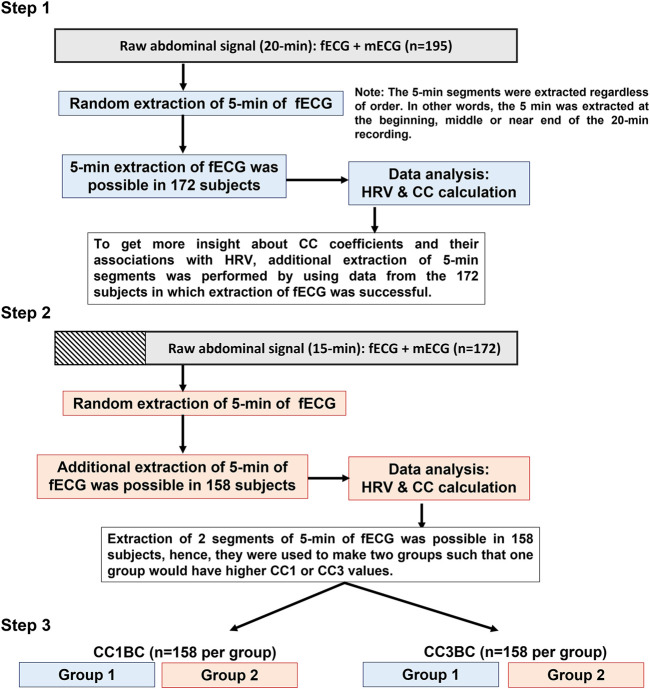
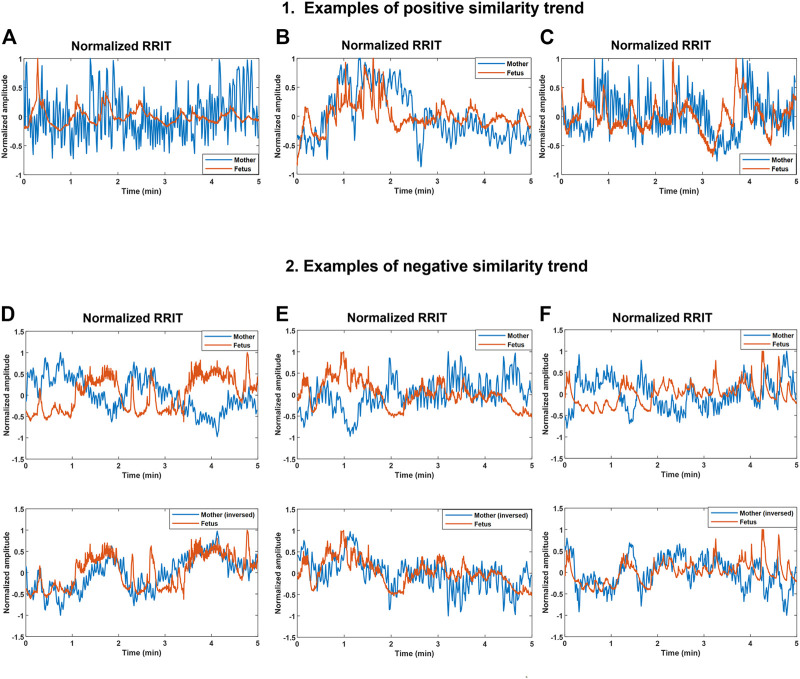
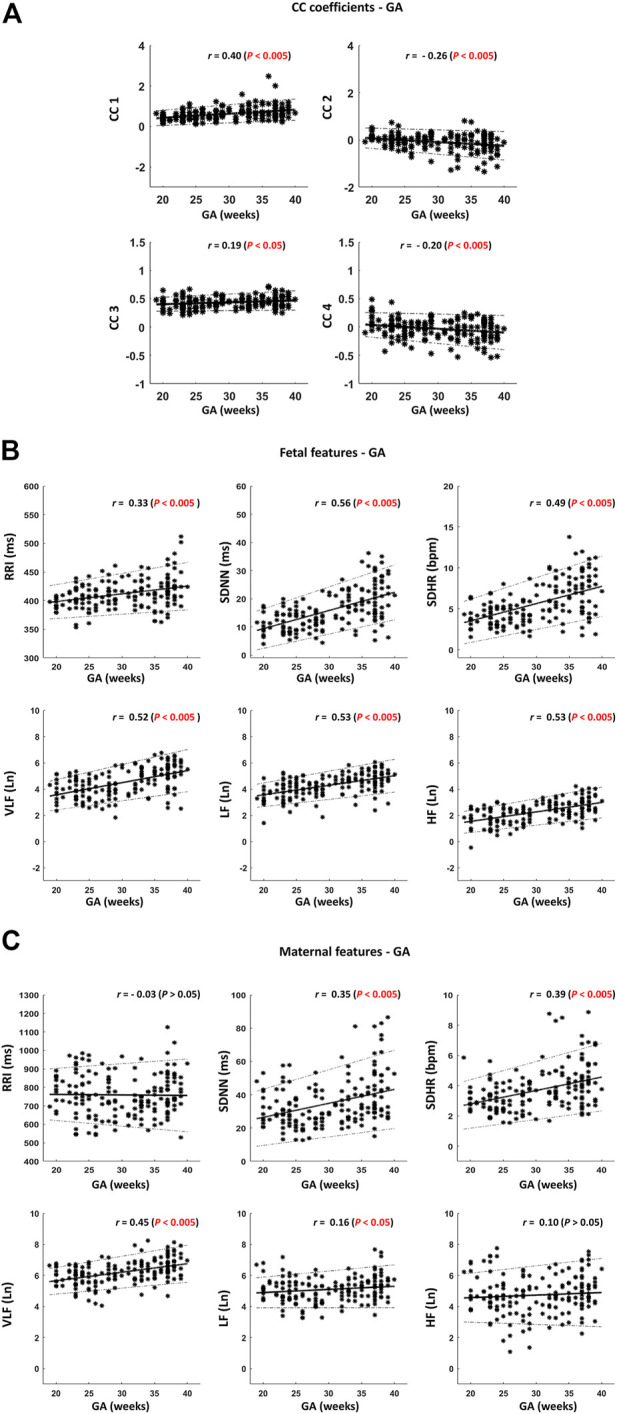
An association between maternal and fetal heart rate (HR) has been reported but, so far, little is known about its physiological implication and importance relative to fetal development. Associations between both HRs were investigated previously by performing beat-by-beat coupling analysis and correlation analysis between average maternal and fetal HRs. However, studies reporting on the presence of similarities between maternal and fetal HRs or RR intervals (RRIs) over the short term (e.g., 5-min) at different gestational ages (GAs) are scarce. Here, we demonstrate the presence of similarities in the variations exhibited by maternal and fetal RRl tachograms (RRITs). To quantify the same similarities, a cross-correlation (CC) analysis between resampled maternal and fetal RRITs was conducted; RRITs were obtained from non-invasive electrocardiogram (ECG). The degree of similarity between maternal and fetal RRITs (bmfRRITs) was quantified by calculating four CC coefficients. CC analysis was performed for a total of 330 segments (two 5-min segments from 158 subjects and one 5-min from 14 subjects). To investigate the association of the similarity bmfRRITs with fetal development, the linear correlation between the calculated CC coefficients and GA was calculated. The results from the latter analysis showed that similarities bmfRRITs are common occurrences, they can be negative or positive, and they increase with GA suggesting the presence of a regulation that is associated with proper fetal development. To get an insight into the physiological mechanisms involved in the similarity bmfRRITs, the association of the same similarity with maternal and fetal HR variability (HRV) was investigated by comparing the means of two groups in which one of them had higher CC values compared to the other. The two groups were created by using the data from the 158 subjects where fetal RRI (fRRI) calculation from two 5-min ECG segments was feasible. The results of the comparison showed that the maternal very low frequency (VLF) HRV parameter is potentially associated with the similarity bmfRRITs implying that maternal hormones could be linked to the regulations involved in the similarity bmfRRITs. Our findings in this study reinforce the role of the maternal intrauterine environment on fetal development.
Keywords: fetal developement; fetal programming; heart rate vaiability; maternal-fetal RRI similarity; very low frequency.
Copyright © 2022 Widatalla, Khandoker, Alkhodari, Koide, Yoshida, Kasahara, Kimura and Saito.
Conflict of interest statement
YKa received funding from Shiguredo Inc. The remaining authors declare that the research was conducted in the absence of any commercial or financial relationships that could be construed as a potential conflict of interest.
Figures
Similar articles
-
Prediction of fetal RR intervals from maternal factors using machine learning models.Sci Rep. 2023 Nov 13;13(1):19765. doi: 10.1038/s41598-023-46920-4. Sci Rep. 2023. PMID: 37957257 Free PMC article.
-
Correlation between maternal and fetal heart rate increases with fetal mouse age in typical development and is disturbed in autism mouse model treated with valproic acid.Front Psychiatry. 2022 Nov 24;13:998695. doi: 10.3389/fpsyt.2022.998695. eCollection 2022. Front Psychiatry. 2022. PMID: 36518366 Free PMC article.
-
Effect of Maternal Respiration on Fetal Heart Rate Variability.Annu Int Conf IEEE Eng Med Biol Soc. 2024 Jul;2024:1-4. doi: 10.1109/EMBC53108.2024.10781735. Annu Int Conf IEEE Eng Med Biol Soc. 2024. PMID: 40039521
-
Investigating the association of maternal heart rate variability with fetal birth weight.Annu Int Conf IEEE Eng Med Biol Soc. 2023 Jul;2023:1-4. doi: 10.1109/EMBC40787.2023.10340182. Annu Int Conf IEEE Eng Med Biol Soc. 2023. PMID: 38082611
-
Fetal biometry for guiding the medical management of women with gestational diabetes mellitus for improving maternal and perinatal health.Cochrane Database Syst Rev. 2019 Sep 3;9(9):CD012544. doi: 10.1002/14651858.CD012544.pub2. Cochrane Database Syst Rev. 2019. PMID: 31476798 Free PMC article.
Cited by
-
Editorial: The repercussions of maternal inflammation in pre-eclampsia on fetal health and neurodevelopment.Front Immunol. 2024 May 29;15:1434260. doi: 10.3389/fimmu.2024.1434260. eCollection 2024. Front Immunol. 2024. PMID: 38868765 Free PMC article. No abstract available.
-
Psychophysiological and interpersonal effects of parallel group crafting: a multimodal study using EEG and ECG.Sci Rep. 2024 Aug 2;14(1):17883. doi: 10.1038/s41598-024-68980-w. Sci Rep. 2024. PMID: 39095523 Free PMC article.
References
-
- Amorim-Costa C., Gaio A., Ayres-de-Campos D., Bernardes J. (2017). Longitudinal changes of cardiotocographic parameters throughout pregnancy: A prospective cohort study comparing small-for-gestational-age and normal fetuses from 24 to 40 weeks. J. Perinat. Med. 45 (4), 493–501. 10.1515/jpm-2016-0065 May - DOI - PubMed
-
- BenSaïda A. Shapiro-Wilk and Shapiro-Francia normality tests. [Online].; 2014 [cited 2022 April 19. Available from: https://www.mathworks.com/matlabcentral/fileexchange/13964-shapiro-wilk-....
LinkOut - more resources
Full Text Sources