

Estimated SARS-CoV-2 antibody seroprevalence trends and relationship to reported case prevalence from a repeated, cross-sectional study in the 50 states and the District of Columbia, United States-October 25, 2020-February 26, 2022
- PMID: 36479424
- PMCID: PMC9716971
- DOI: 10.1016/j.lana.2022.100403
Estimated SARS-CoV-2 antibody seroprevalence trends and relationship to reported case prevalence from a repeated, cross-sectional study in the 50 states and the District of Columbia, United States-October 25, 2020-February 26, 2022
Abstract
Background: Sero-surveillance of severe acute respiratory syndrome coronavirus 2 (SARS-CoV-2) can reveal trends and differences in subgroups and capture undetected or unreported infections that are not included in case-based surveillance systems.
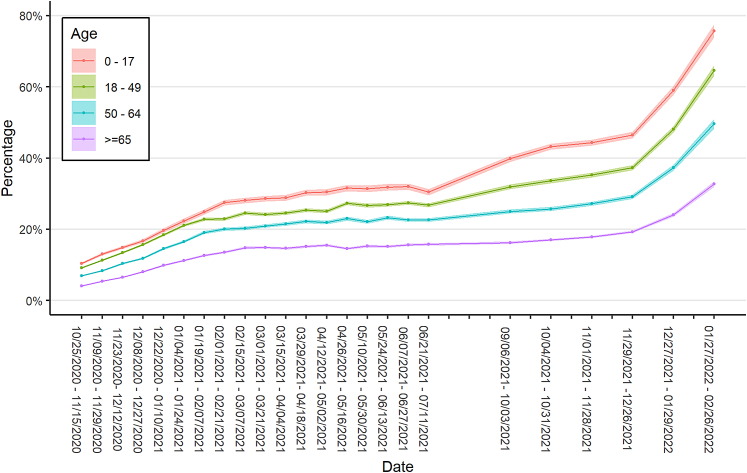
Methods: Cross-sectional, convenience samples of remnant sera from clinical laboratories from 51 U.S. jurisdictions were assayed for infection-induced SARS-CoV-2 antibodies biweekly from October 25, 2020, to July 11, 2021, and monthly from September 6, 2021, to February 26, 2022. Test results were analyzed for trends in infection-induced, nucleocapsid-protein seroprevalence using mixed effects models that adjusted for demographic variables and assay type.
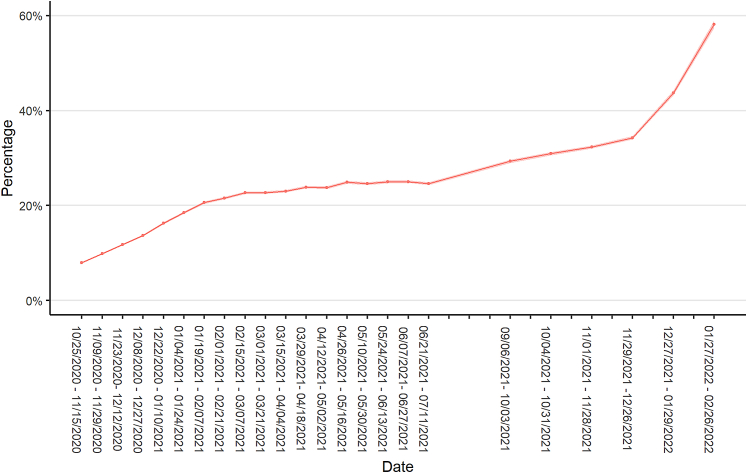
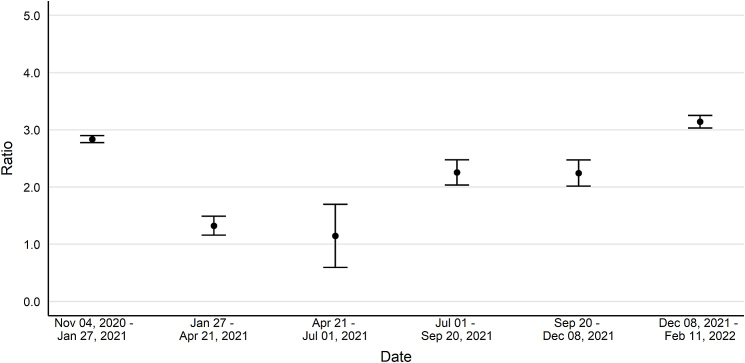
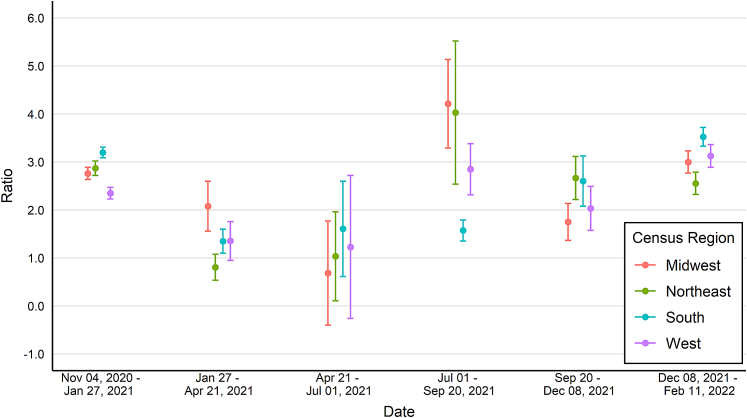
Findings: Analyses of 1,469,792 serum specimens revealed U.S. infection-induced SARS-CoV-2 seroprevalence increased from 8.0% (95% confidence interval (CI): 7.9%-8.1%) in November 2020 to 58.2% (CI: 57.4%-58.9%) in February 2022. The U.S. ratio of the change in estimated seroprevalence to the change in reported case prevalence was 2.8 (CI: 2.8-2.9) during winter 2020-2021, 2.3 (CI: 2.0-2.5) during summer 2021, and 3.1 (CI: 3.0-3.3) during winter 2021-2022. Change in seroprevalence to change in case prevalence ratios ranged from 2.6 (CI: 2.3-2.8) to 3.5 (CI: 3.3-3.7) by region in winter 2021-2022.
Interpretation: Ratios of the change in seroprevalence to the change in case prevalence suggest a high proportion of infections were not detected by case-based surveillance during periods of increased transmission. The largest increases in the seroprevalence to case prevalence ratios coincided with the spread of the B.1.1.529 (Omicron) variant and with increased accessibility of home testing. Ratios varied by region and season with the highest ratios in the midwestern and southern United States during winter 2021-2022. Our results demonstrate that reported case counts did not fully capture differing underlying infection rates and demonstrate the value of sero-surveillance in understanding the full burden of infection. Levels of infection-induced antibody seroprevalence, particularly spikes during periods of increased transmission, are important to contextualize vaccine effectiveness data as the susceptibility to infection of the U.S. population changes.
Funding: This work was supported by the Centers for Disease Control and Prevention, Atlanta, Georgia.
Keywords: COVID-19; SARS-CoV-2; Seroprevalence; United States.
Conflict of interest statement
BioReference Laboratories, Inc., ICF Inc., Laboratory Corporation of America Holdings, and Quest Diagnostics, Inc. were awarded federal contracts from the U.S. Centers for Disease Control and Prevention (CDC) for the execution of this project. No other disclosures were reported.
Figures
Similar articles
-
Estimated SARS-CoV-2 Seroprevalence in the US as of September 2020.JAMA Intern Med. 2021 Apr 1;181(4):450-460. doi: 10.1001/jamainternmed.2020.7976. JAMA Intern Med. 2021. PMID: 33231628 Free PMC article.
-
Comparison of SARS-CoV-2 seroprevalence estimates between commercial lab serum specimens and blood donor specimens, United States, September-December 2021.Microbiol Spectr. 2024 Aug 6;12(8):e0012324. doi: 10.1128/spectrum.00123-24. Epub 2024 Jun 13. Microbiol Spectr. 2024. PMID: 38869287 Free PMC article.
-
Seroprevalence of anti-SARS-CoV-2 IgG Antibodies in the Staff of a Public School System in the Midwestern United States.medRxiv [Preprint]. 2020 Oct 27:2020.10.23.20218651. doi: 10.1101/2020.10.23.20218651. medRxiv. 2020. Update in: PLoS One. 2021 Jun 10;16(6):e0243676. doi: 10.1371/journal.pone.0243676. PMID: 33140066 Free PMC article. Updated. Preprint.
-
Estimated US Infection- and Vaccine-Induced SARS-CoV-2 Seroprevalence Based on Blood Donations, July 2020-May 2021.JAMA. 2021 Oct 12;326(14):1400-1409. doi: 10.1001/jama.2021.15161. JAMA. 2021. PMID: 34473201 Free PMC article.
-
Riding high: seroprevalence of SARS-CoV-2 after 4 pandemic waves in Manitoba, Canada, April 2020-February 2022.BMC Public Health. 2023 Dec 5;23(1):2420. doi: 10.1186/s12889-023-17239-6. BMC Public Health. 2023. PMID: 38053033 Free PMC article.
Cited by
-
Long-Term Symptoms Associated With SARS-CoV-2 Infection Among Blood Donors.JAMA Netw Open. 2024 Apr 1;7(4):e245611. doi: 10.1001/jamanetworkopen.2024.5611. JAMA Netw Open. 2024. PMID: 38587842 Free PMC article.
-
Infectious disease surveillance needs for the United States: lessons from Covid-19.Front Public Health. 2024 Jul 15;12:1408193. doi: 10.3389/fpubh.2024.1408193. eCollection 2024. Front Public Health. 2024. PMID: 39076420 Free PMC article. Review.
-
Bias and negative values of COVID-19 vaccine effectiveness estimates from a test-negative design without controlling for prior SARS-CoV-2 infection.Nat Commun. 2024 Nov 20;15(1):10062. doi: 10.1038/s41467-024-54404-w. Nat Commun. 2024. PMID: 39567531 Free PMC article.
-
A repeated cross-sectional analysis of SARS-CoV-2 seroprevalence in Manila, the Philippines after implementation of the national COVID-19 vaccination program.Trop Med Health. 2025 Jun 16;53(1):81. doi: 10.1186/s41182-025-00767-9. Trop Med Health. 2025. PMID: 40524246 Free PMC article.
-
High immunity and low mortality after Omicron and mass event in Cameroon despite low vaccination.J Public Health Afr. 2024 Nov 7;15(1):649. doi: 10.4102/jphia.v15i1.649. eCollection 2024. J Public Health Afr. 2024. PMID: 39649435 Free PMC article.
References
-
- McNamara L.A., Wiegand R.E., Burke R.M., et al. Estimating the early impact of the US COVID-19 vaccination programme on COVID-19 cases, emergency department visits, hospital admissions, and deaths among adults aged 65 years and older: an ecological analysis of national surveillance data. Lancet. 2021;399(10320):152–160. - PMC - PubMed
-
- del Rio C., Malani P.N., Omer S.B. Confronting the delta variant of SARS-CoV-2, summer 2021. JAMA. 2021;326(11):1001–1002. - PubMed
-
- Centers for Disease Control and Prevention CDC COVID data tracker. 2022. https://covid.cdc.gov/covid-data-tracker/#datatracker-home
LinkOut - more resources
Full Text Sources
Miscellaneous
