

Effects of arch support doses on the center of pressure and pressure distribution of running using statistical parametric mapping
- PMID: 36479433
- PMCID: PMC9719983
- DOI: 10.3389/fbioe.2022.1051747
Effects of arch support doses on the center of pressure and pressure distribution of running using statistical parametric mapping
Abstract
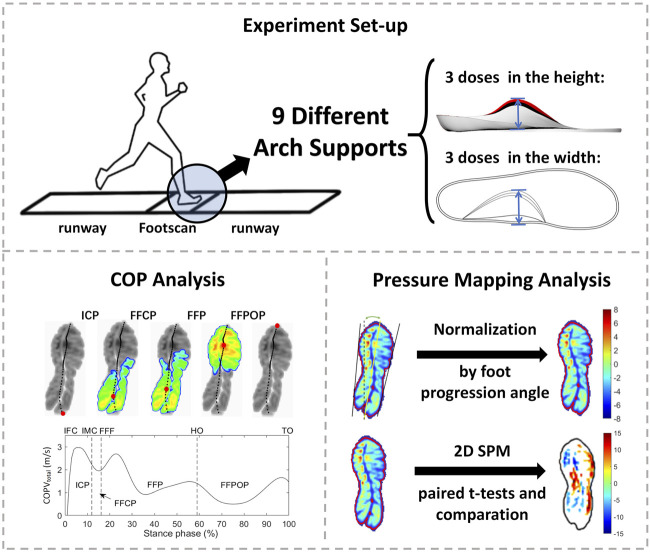
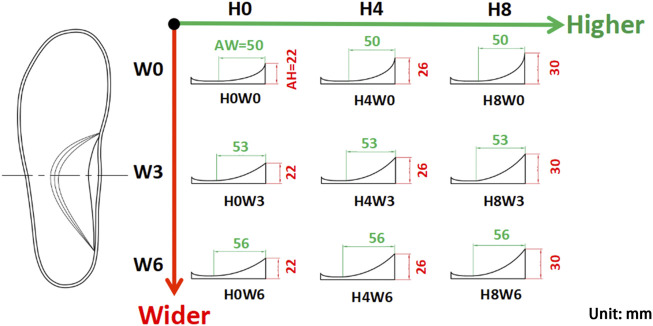
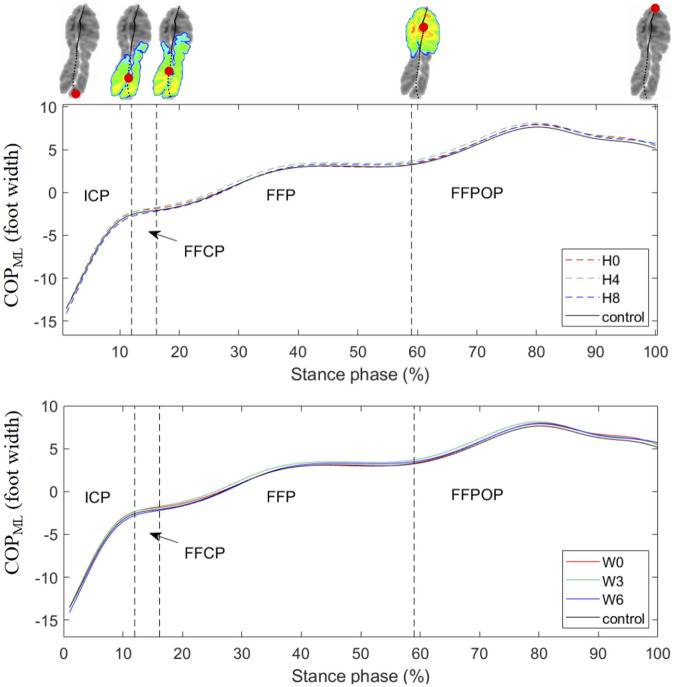
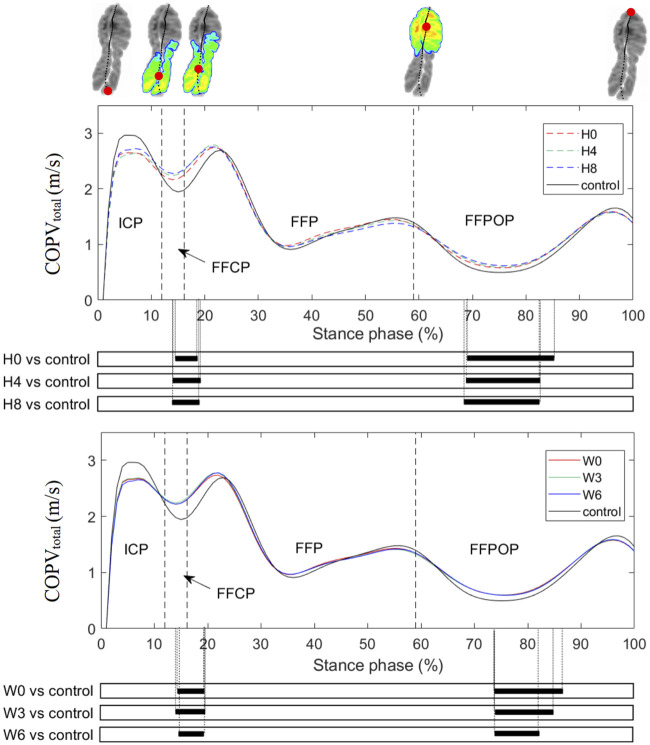
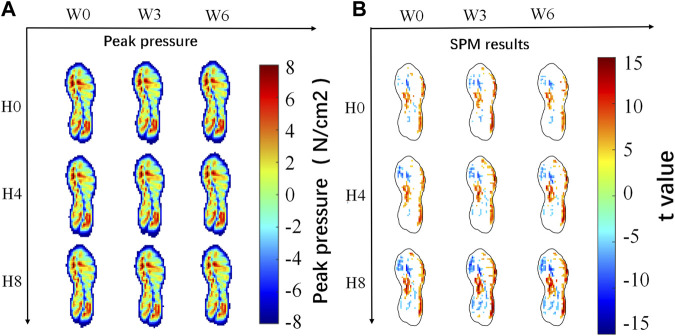
Insoles with an arch support have been used to address biomechanical risk factors of running. However, the relationship between the dose of support and running biomechanics remains unclear. The purpose of this study was to determine the effects of changing arch support doses on the center of pressure (COP) and pressure mapping using statistical parametric mapping (SPM). Nine arch support variations (3 heights * 3 widths) and a flat insole control were tested on fifteen healthy recreational runners using a 1-m Footscan pressure plate. The medial-lateral COP (COPML) coordinates and the total COP velocity (COPVtotal) were calculated throughout the entirety of stance. One-dimensional and two-dimensional SPM were performed to assess differences between the arch support and control conditions for time series of COP variables and pressure mapping at a pixel level, respectively. Two-way ANOVAs were performed to test the main effect of the arch support height and width, and their interaction on the peak values of the COPVtotal. The results showed that the COPVtotal during the forefoot contact and forefoot push off phases was increased by arch supports, while the COP medial-lateral coordinates remained unchanged. There was a dose-response effect of the arch support height on peak values of the COPVtotal, with a higher support increasing the first and third valleys but decreasing the third peak of the COPVtotal. Meanwhile, a higher arch support height shifted the peak pressure from the medial forefoot and rearfoot to the medial arch. It is concluded that changing arch support doses, primarily the height, systematically altered the COP velocities and peak plantar pressure at a pixel level during running. When assessing subtle modifications in the arch support, the COP velocity was a more sensitive variable than COP coordinates. SPM provides a high-resolution view of pressure comparisons, and is recommended for future insole/footwear investigations to better understand the underlying mechanisms and improve insole design.
Keywords: arch support; center of pressure; pressure distribution; running biomechanics; statistical parametric mapping.
Copyright © 2022 Cheng, Zeng, Lai and Zhang.
Conflict of interest statement
The authors declare that the research was conducted in the absence of any commercial or financial relationships that could be construed as a potential conflict of interest.
Figures
Similar articles
-
Dose-response effects of forefoot and arch orthotic components on the center of pressure trajectory during running in pronated feet.Gait Posture. 2022 Feb;92:212-217. doi: 10.1016/j.gaitpost.2021.11.033. Epub 2021 Nov 27. Gait Posture. 2022. PMID: 34864487
-
The effect of changing mediolateral center of pressure on rearfoot eversion during treadmill running.Gait Posture. 2021 Jan;83:201-209. doi: 10.1016/j.gaitpost.2020.10.032. Epub 2020 Nov 3. Gait Posture. 2021. PMID: 33171373
-
The effect of personalized orthopedic insoles on plantar pressure during running in subtle cavus foot.Front Bioeng Biotechnol. 2024 Feb 22;12:1343001. doi: 10.3389/fbioe.2024.1343001. eCollection 2024. Front Bioeng Biotechnol. 2024. PMID: 38456009 Free PMC article.
-
Arch-Support Insoles Benefit the Archery Performance and Stability of Compound Archers.Int J Environ Res Public Health. 2022 Jul 10;19(14):8424. doi: 10.3390/ijerph19148424. Int J Environ Res Public Health. 2022. PMID: 35886275 Free PMC article.
-
The trajectory of the centre of pressure during barefoot running as a potential measure for foot function.Gait Posture. 2008 May;27(4):669-75. doi: 10.1016/j.gaitpost.2007.08.013. Epub 2007 Nov 9. Gait Posture. 2008. PMID: 17997096
Cited by
-
A method for automated masking and plantar pressure analysis using segmented computed tomography scans.Gait Posture. 2024 Jun;111:92-98. doi: 10.1016/j.gaitpost.2024.04.015. Epub 2024 Apr 15. Gait Posture. 2024. PMID: 38657477 Free PMC article.
References
LinkOut - more resources
Full Text Sources