

Epigenome-wide association study of BMI in Black populations from InterGEN and GENOA
- PMID: 36479596
- PMCID: PMC10107734
- DOI: 10.1002/oby.23589
Epigenome-wide association study of BMI in Black populations from InterGEN and GENOA
Abstract
Objective: Obesity is a significant public health concern across the globe. Research investigating epigenetic mechanisms related to obesity and obesity-associated conditions has identified differences that may contribute to cellular dysregulation that accelerates the development of disease. However, few studies include Black women, who experience the highest incidence of obesity and early onset of cardiometabolic disorders.
Methods: The association of BMI with epigenome-wide DNA methylation (DNAm) was examined using the 850K Illumina EPIC BeadChip in two Black populations (Intergenerational Impact of Genetic and Psychological Factors on Blood Pressure [InterGEN], n = 239; and The Genetic Epidemiology Network of Arteriopathy [GENOA] study, n = 961) using linear mixed-effects regression models adjusted for batch effects, cell type heterogeneity, population stratification, and confounding factors.
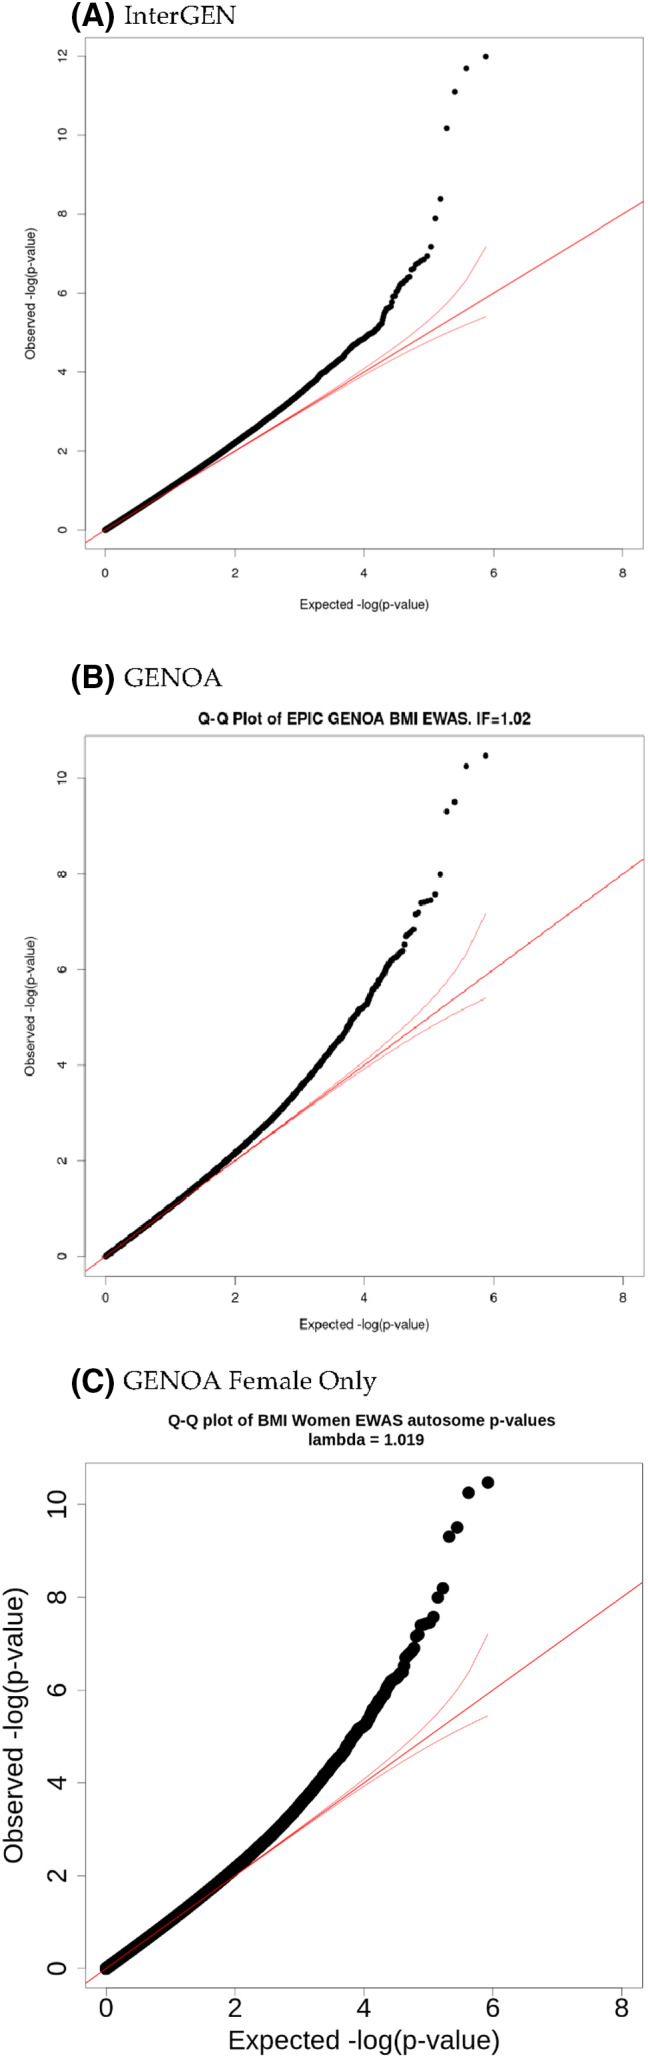
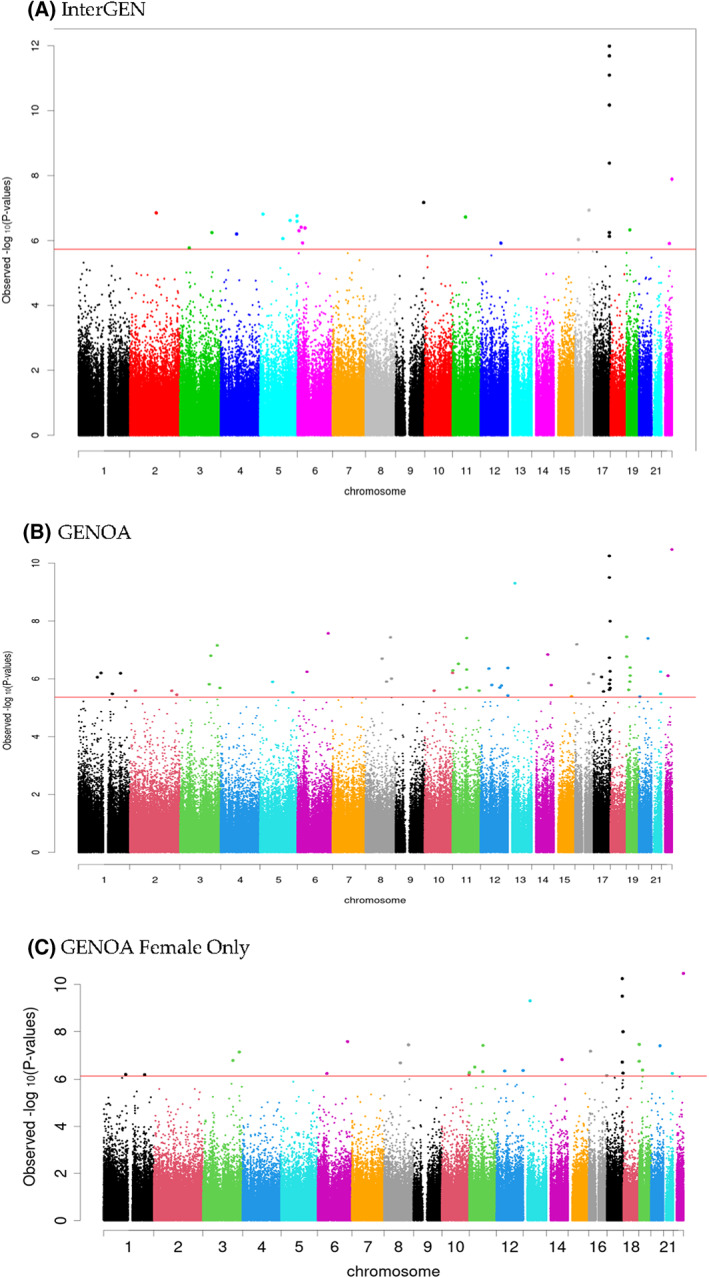
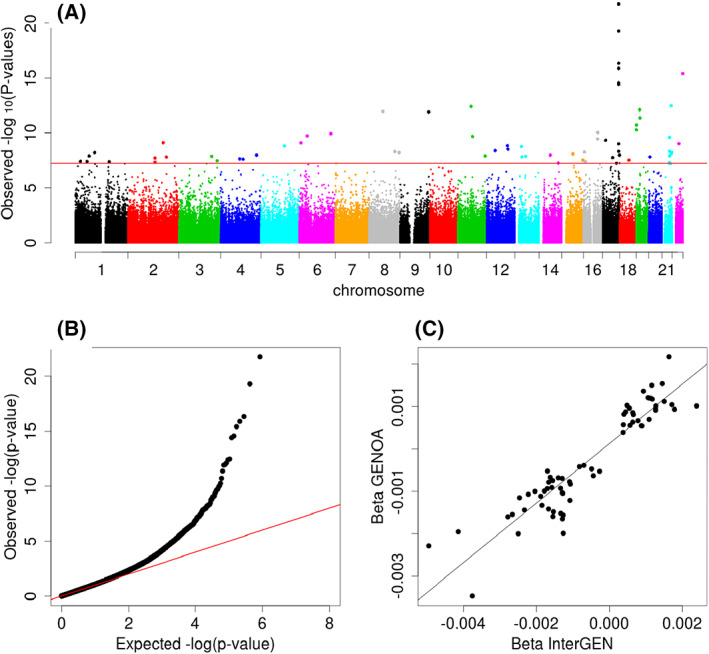
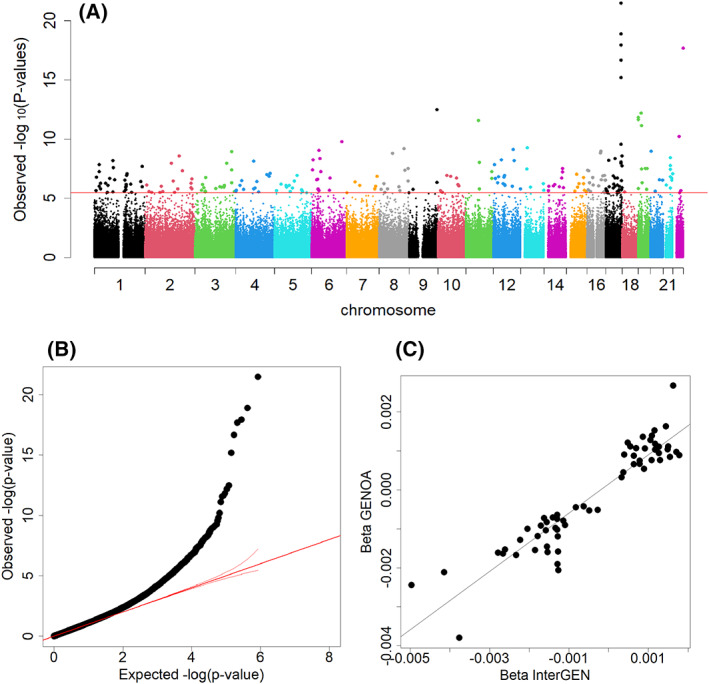
Results: Cross-sectional analysis of the InterGEN discovery cohort identified 28 DNAm sites significantly associated with BMI, 24 of which had not been previously reported. Of these, 17 were replicated using the GENOA study. In addition, a meta-analysis, including both the InterGEN and GENOA cohorts, identified 658 DNAm sites associated with BMI with false discovery rate < 0.05. In a meta-analysis of Black women, we identified 628 DNAm sites significantly associated with BMI. Using a more stringent significance threshold of Bonferroni-corrected p value 0.05, 65 and 61 DNAm sites associated with BMI were identified from the combined sex and female-only meta-analyses, respectively.
Conclusions: This study suggests that BMI is associated with differences in DNAm among women that can be identified with DNA extracted from salivary (discovery) and peripheral blood (replication) samples among Black populations across two cohorts.
© 2022 The Authors. Obesity published by Wiley Periodicals LLC on behalf of The Obesity Society.
Conflict of interest statement
The authors declared no conflict of interest.
Figures
References
-
- Hales CM, Carroll MD, Fryar CD, Ogden CL. Prevalence of obesity and severe obesity among adults: United States, 2017–2018. NCHS Data Brief, no. 360. National Center for Health Statistics; 2020. - PubMed
-
- Centers for Disease Control and Prevention . About adult BMI. Updated June 3, 2022. https://www.cdc.gov/healthyweight/assessing/bmi/adult_bmi/index.html
Publication types
MeSH terms
Grants and funding
LinkOut - more resources
Full Text Sources
