. 2023 Mar;32(3):574-619.
doi: 10.1002/hec.4635. Epub 2022 Dec 8.

The effect of health financing systems on health system outcomes: A cross-country panel analysis

Affiliations

The effect of health financing systems on health system outcomes: A cross-country panel analysis

Jacopo Gabani et al. Health Econ. 2023 Mar.

Abstract

Several low- and middle-income countries are considering health financing system reforms to accelerate progress toward universal health coverage (UHC). However, empirical evidence of the effect of health financing systems on health system outcomes is scarce, partly because it is difficult to quantitatively capture the 'health financing system'. We assign country-year observations to one of three health financing systems (i.e., predominantly out-of-pocket, social health insurance (SHI) or government-financed), using clustering based on out-of-pocket, contributory SHI and non-contributory government expenditure, as a percentage of total health expenditures. We then estimate the effect of these different systems on health system outcomes, using fixed effects regressions. We find that transitions from OOP-dominant to government-financed systems improved most outcomes more than did transitions to SHI systems. Transitions to government financing increases life expectancy (+1.3 years, p < 0.05) and reduces under-5 mortality (-8.7%, p < 0.05) and catastrophic health expenditure incidence (-3.3 percentage points, p < 0.05). Results are robust to several sensitivity tests. It is more likely that increases in non-contributory government financing rather than SHI financing improve health system outcomes. Notable reasons include SHI's higher implementation costs and more limited coverage. These results may raise a warning for policymakers considering SHI reforms to reach UHC.

Keywords: health expenditure; health financing; health system; social health insurance; universal health coverage.


Conflict of interest statement

None of the authors has any conflict of interest to declare.

Figures

FIGURE 1
FIGURE 1
Conceptual framework. Source: authors' elaboration, expanding frameworks presented in (Kutzin, 2008). The conceptual framework follows a logic model representation. Black lines represent potential causal pathways between HFS and health system outcomes; numbers attached to black lines refer to hypotheses listed in the “Hypotheses” section. The two hypotheses and two unintended consequences noted in the figure are not exhaustive. Red lines represent the pathways investigated by this study. Blue lines represent pathways investigated by existing cross‐country regression studies: Wagstaff and Moreno‐Serra, , and Wagstaff and Neelsen,
FIGURE 2
FIGURE 2
Proportion of 124 countries by HFS, year 2000 to year 2017. Source: Author elaboration. The graph represents the percentage of countries assigned to each predominant‐HFS per year
FIGURE 3
FIGURE 3
Average of OOP, SHI and government financing as % of THE, during health financing transitions. Source: Author elaboration. The figure shows SHI, OOP and government financing as % of THE for countries that switched from OOP‐ to SHI‐predominant and government financing‐predominant HFS. The sum of OOP, government financing and SHI as % of THE may not equal 100% due to other health financing arrangements (e.g., voluntary private health insurance, non‐resident arrangements)
FIGURE 4
FIGURE 4
Histogram of parallel trend assumption specification tests p‐values. Source: Author elaboration. Histogram of p‐values resulting from PTA tests of the (Savedoff & Yazbeck, 2020) GOV and SHI dummy variables, across 2 specifications, random trend model PTA test (Equation 4) and differential trend model PTA test (Equation 9), all 6 outcomes (total of 24 tests)
FIGURE 5
FIGURE 5
Histogram of reverse causality test p‐values. Source: Author elaboration. Histogram of p‐values of leads of GOV and SHI dummy variables regressed on 6 outcomes across 3 specifications: main DID specification, random trend model (Equation 3), and differential trend model PTA test (Equation 7) (total of 36 tests)
FIGURE 6
FIGURE 6
p‐values for difference between government financing and SHI coefficients. Source: Author elaboration. The Figure shows the histogram of p‐values for difference between government financing and SHI coefficients (ρ1ρ2=0 in [1], [3], [7]). Whenever the p‐value is below 10%, there is at least suggestive evidence that government financing HFS transitions show better results than SHI HFS transitions. The p‐values are 15, resulting from three models (FE model, random trend model and differential trend model) times five health system outcomes (LE, U5M, MM, CAT 10%, immunization). THE is not considered as an outcome because larger health expenditure is desirable only if larger expenditure translates into more services coverage
FIGURE A1
FIGURE A1
Health financing schemes definitions. Source: Author elaboration based on OECD, Eurostat, WHO, 2017, Chapter 7
None
Source: Authors elaboration. The above figures are the results of the calculations described in the previous paragraph for WSS, ln(WSS), eta squared, PRE
None
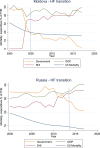
Source: Author elaboration. Descriptive data for selected variables, for Russia and Moldova, over time

References

    1. Anderson, M. , Averi Albala, S. , Patel, N. , & Lloyd, J. (2018). Economic case for PHC. Available from http://www.who.int/docs/default‐source/primary‐health‐care‐conference/ph...
    1. Angrist, J. D. , & Pischke, J. S. (2008). Chapter 3.2.3: Bad controls. In Mostly harmless econometrics: An empiricist’s companion (pp. 47–51).
    1. Angrist, J. D. , & Pischke, J. S. (2008). Chapter 5.2.1: Regression difference‐in‐difference. In Mostly harmless econometrics: An empiricist’s companion.
    1. Barasa, E. , Kazungu, J. , Nguhiu, P. , & Ravishankar, N. (2021). Examining the level and inequality in health insurance coverage in 36 sub‐Saharan African countries. BMJ Global Health, 6(4), e004712. 10.1136/bmjgh-2020-004712 - DOI - PMC - PubMed
    1. Billor, N. , Hadi, A. S. , & Velleman, P. F. (2000). Bacon: Blocked adaptive computationally efficient outlier nominators. Computational Statistics & Data Analysis, 34(3), 279–298. 10.1016/S0167-9473(99)00101-2 - DOI

Publication types