Novel noninvasive identification of patient-specific epileptic networks in focal epilepsies: Linking single-photon emission computed tomography perfusion during seizures with resting-state magnetoencephalography dynamics
- PMID: 36480260
- PMCID: PMC9921232
- DOI: 10.1002/hbm.26168
Novel noninvasive identification of patient-specific epileptic networks in focal epilepsies: Linking single-photon emission computed tomography perfusion during seizures with resting-state magnetoencephalography dynamics
Abstract
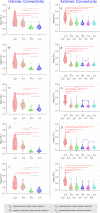
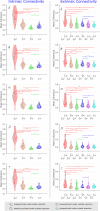
Single-photon emission computed tomography (SPECT) during seizures and magnetoencephalography (MEG) during the interictal state are noninvasive modalities employed in the localization of the epileptogenic zone in patients with drug-resistant focal epilepsy (DRFE). The present study aims to investigate whether there exists a preferentially high MEG functional connectivity (FC) among those regions of the brain that exhibit hyperperfusion or hypoperfusion during seizures. We studied MEG and SPECT data in 30 consecutive DRFE patients who had resective epilepsy surgery. We parcellated each ictal perfusion map into 200 regions of interest (ROIs) and generated ROI time series using source modeling of MEG data. FC between ROIs was quantified using coherence and phase-locking value. We defined a generalized linear model to relate the connectivity of each ROI, ictal perfusion z score, and distance between ROIs. We compared the coefficients relating perfusion z score to FC of each ROI and estimated the connectivity within and between resected and unresected ROIs. We found that perfusion z scores were strongly correlated with the FC of hyper-, and separately, hypoperfused ROIs across patients. High interictal connectivity was observed between hyperperfused brain regions inside and outside the resected area. High connectivity was also observed between regions of ictal hypoperfusion. Importantly, the ictally hypoperfused regions had a low interictal connectivity to regions that became hyperperfused during seizures. We conclude that brain regions exhibiting hyperperfusion during seizures highlight a preferentially connected interictal network, whereas regions of ictal hypoperfusion highlight a separate, discrete and interconnected, interictal network.
Keywords: MEG; SPECT; cerebral blood perfusion; epilepsy; functional connectivity.
© 2022 The Authors. Human Brain Mapping published by Wiley Periodicals LLC.
Conflict of interest statement
None of the authors has any conflict of interest to disclose. We confirm that we have read the Journal's position on issues involved in ethical publication and affirm that this report is consistent with those guidelines.
Figures


Similar articles
-
Common Ictal and Interictal Perfusion Patterns: A Window into the Epileptogenic Network and SUDEP Mechanism in Drug-Resistant Focal Epilepsy.Curr Pharm Des. 2022 Jul 13;28(14):1198-1209. doi: 10.2174/1381612828666220603125328. Curr Pharm Des. 2022. PMID: 35658889
-
Measurable transitions during seizures in intracranial EEG: A stereoelectroencephalography and SPECT study.Clin Neurophysiol. 2024 May;161:80-92. doi: 10.1016/j.clinph.2024.02.022. Epub 2024 Feb 23. Clin Neurophysiol. 2024. PMID: 38452427
-
Interictal and ictal source localization for epilepsy surgery using high-density EEG with MEG: a prospective long-term study.Brain. 2019 Apr 1;142(4):932-951. doi: 10.1093/brain/awz015. Brain. 2019. PMID: 30805596 Free PMC article.
-
Interictal Functional Connectivity in Focal Refractory Epilepsies Investigated by Intracranial EEG.Brain Connect. 2022 Dec;12(10):850-869. doi: 10.1089/brain.2021.0190. Epub 2022 Sep 14. Brain Connect. 2022. PMID: 35972755 Free PMC article. Review.
-
Neuronuclear assessment of patients with epilepsy.Semin Nucl Med. 2008 Jul;38(4):227-39. doi: 10.1053/j.semnuclmed.2008.02.004. Semin Nucl Med. 2008. PMID: 18514079 Review.
Cited by
-
The Role of Neuroinflammation and Network Anomalies in Drug-Resistant Epilepsy.Neurosci Bull. 2025 May;41(5):881-905. doi: 10.1007/s12264-025-01348-w. Epub 2025 Feb 24. Neurosci Bull. 2025. PMID: 39992353 Free PMC article. Review.
-
Symptom network analysis of prefrontal seizures.Epilepsia. 2025 Jul;66(7):2566-2577. doi: 10.1111/epi.18372. Epub 2025 Mar 19. Epilepsia. 2025. PMID: 40105434 Free PMC article.
References
-
- Antony, A. R. , Alexopoulos, A. V. , González‐Martínez, J. A. , Mosher, J. C. , Jehi, L. , Burgess, R. C. , So, N. K. , & Galán, R. F. (2013). Functional connectivity estimated from intracranial EEG predicts surgical outcome in intractable temporal lobe epilepsy. PLoS One, 8, e77916. 10.1371/journal.pone.0077916 - DOI - PMC - PubMed
-
- Arthuis, M. , Valton, L. , Régis, J. , Chauvel, P. , Wendling, F. , Naccache, L. , Bernard, C. , & Bartolomei, F. (2009). Impaired consciousness during temporal lobe seizures is related to increased long‐distance cortical–subcortical synchronization. Brain, 132, 2091–2101. 10.1093/brain/awp086 - DOI - PubMed
-
- Bartolomei, F. , Wendling, F. , Vignal, J.‐P. , Kochen, S. , Bellanger, J.‐J. , Badier, J.‐M. , Le Bouquin‐Jeannes, R. , & Chauvel, P. (1999). Seizures of temporal lobe epilepsy: Identification of subtypes by coherence analysis using stereo‐electro‐encephalography. Clinical Neurophysiology, 110, 1741–1754. 10.1016/S1388-2457(99)00107-8 - DOI - PubMed
-
- Benjamini, Y. , & Hochberg, Y. (1995). Controlling the false discovery rate: A practical and powerful approach to multiple testing. Journal of the Royal Statistical Society, Series B, 57, 289–300. 10.2307/2346101 - DOI
-
- Bettus, G. , Ranjeva, J.‐P. , Wendling, F. , Bénar, C. G. , Confort‐Gouny, S. , Régis, J. , Chauvel, P. , Cozzone, P. J. , Lemieux, L. , Bartolomei, F. , & Guye, M. (2011). Interictal functional connectivity of human epileptic networks assessed by intracerebral EEG and BOLD signal fluctuations. PLoS One, 6, e20071. 10.1371/journal.pone.0020071 - DOI - PMC - PubMed

