. 2023 Feb 15;133(4):e159498.
doi: 10.1172/JCI159498.

Mitochondrial dysfunction in macrophages promotes inflammation and suppresses repair after myocardial infarction

Affiliations

Mitochondrial dysfunction in macrophages promotes inflammation and suppresses repair after myocardial infarction

Shanshan Cai et al. J Clin Invest. .

Abstract

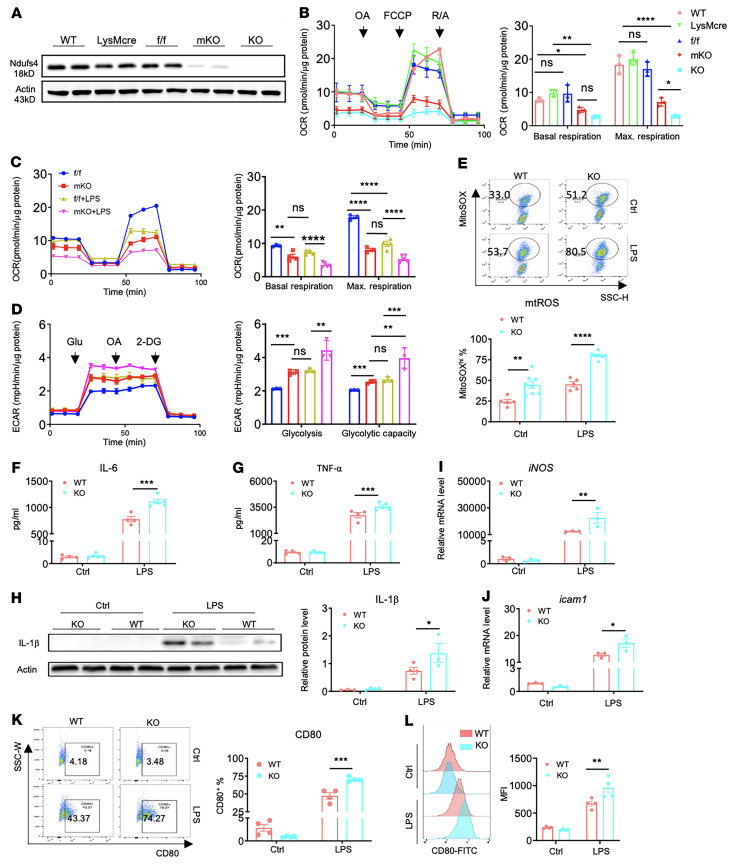
Innate immune cells play important roles in tissue injury and repair following acute myocardial infarction (MI). Although reprogramming of macrophage metabolism has been observed during inflammation and resolution phases, the mechanistic link to macrophage phenotype is not fully understood. In this study, we found that myeloid-specific deletion (mKO) of mitochondrial complex I protein, encoded by Ndufs4, reproduced the proinflammatory metabolic profile in macrophages and exaggerated the response to LPS. Moreover, mKO mice showed increased mortality, poor scar formation, and worsened cardiac function 30 days after MI. We observed a greater inflammatory response in mKO mice on day 1 followed by increased cell death of infiltrating macrophages and blunted transition to the reparative phase during post-MI days 3-7. Efferocytosis was impaired in mKO macrophages, leading to lower expression of antiinflammatory cytokines and tissue repair factors, which suppressed the proliferation and activation of myofibroblasts in the infarcted area. Mitochondria-targeted ROS scavenging rescued these impairments, improved myofibroblast function in vivo, and reduced post-MI mortality in mKO mice. Together these results reveal a critical role of mitochondria in inflammation resolution and tissue repair via modulation of efferocytosis and crosstalk with fibroblasts. These findings have potential significance for post-MI recovery as well as for other inflammatory conditions.

Keywords: Cardiology; Cardiovascular disease; Macrophages; Metabolism; Mitochondria.


Figures

Figure 1
Figure 1. Deletion of the mitochondrial complex I protein Ndufs4 mimics the metabolic profile of inflammatory macrophages and exacerbates the response to LPS.
(A) Ndufs4 protein expression levels in BMDMs from WT, LysMcre, f/f, mKO, and KO mice were detected by Western blotting. (B) Representative tracings of the OCR of BMDMs from the indicated groups of mice (left). The group average of basal and maximal (Max.) OCRs are shown (right). Vertical lines indicate time of addition of mitochondrial inhibitors oligomycin A (OA) (5 μM), FCCP (3 μM), or rotenone/antimycin A (R/A) (1 μM/1 μM). Experiments were repeated in 3 mice per group. (C and D) Mitochondrial respiration and glycolysis were measured according to the OCR (C) and the ECAR (D) in BMDMs treated with LPS (10 ng/mL) or vehicle for 6 hours. OCR and ECAR tracings are shown on the left. Average values at basal state and during maximum respiration or glycolysis (glycolytic capacity) are presented on the right. Experiments were repeated in 3–5 mice per group. (E) mtROS levels were measured by flow cytometry. MitoSOX was used as the ROS-sensitive dye in WT and KO macrophages pretreated with LPS (10 ng/mL) or vehicle for 6 hours. Representative flow cytometric analysis of MitoSOX fluorescence (upper) and the average of MitoSOXhi percentage (lower) are shown. Experiments were repeated in 5–8 mice per group. SSC-H, side scatter height. (FH) Protein levels in BMDMs treated with vehicle (PBS, control [Ctrl]) and LPS 100 ng/mL for 6 hours. IL-6 (F), TNF-α (G) levels were detected by ELISA, and IL-1β levels (H) were detected by Western blotting. Experiments were repeated in 4–5 mice per group. (I and J) Relative mRNA level of iNOS (I) and Icam1 (J) in WT and KO BMDMs treated with 100 ng/mL LPS or PBS for 6 hours (n = 3/group). (K) Representative plots and quantification of CD80+ macrophages (percentage) in BMDMs treated with 100 ng/mL LPS or PBS for 24 hours. (L) Representative flow cytometry histogram and average (MFI) of CD80 staining. Experiments were repeated in 4 mice per group. All Data are presented as the mean ± SEM. *P < 0.05, **P < 0.01, ***P < 0.001, and ****P < 0.0001, by 1- or 2-way ANOVA.
Figure 2
Figure 2. Myeloid-specific mitochondrial deficiency worsens post-MI outcomes.
(A) Pictorial description of the MI model by ligation of the left coronary artery. (B) Survival rate in the 30 days following MI or sham operation for the indicated groups. (C) Rate of cardiac rupture out to 7 days after MI. (D) Survival rate of male mice following ligation at a lower site along the left descending coronary artery, as shown in A, to induce a smaller ischemic area (mMI). Survival rates were compared by Gehan–Breslow–Wilcoxon test with a P value of less than 0.01 considered statistically significant. (E) LV FS after mMI assessed by echocardiography at day 30 in male and female mice (n = 4–9/group). (F)Mid-ventricular sections from a f/f and a mKO perfusion-fixed heart at post-MI day 30. (G) Male and female scar thickness measured in sections with Masson’s trichrome stain at day 30 after mMI (n = 4–11/group). Data are presented as the mean ± SEM. *P < 0.05 and **P < 0.01, by 1-or 2-way ANOVA.
Figure 3
Figure 3. Heightened inflammation is coupled with increased macrophage death and failed transition to a reparative phenotype in mKO mice after MI.
(A and B) Flow cytometric quantification of neutrophils in blood (A) and infarcted tissue (B) at days 1, 3, and 7 (D1, D3, D7) after mMI (n = 3–8/group). (CE) Cytokine/chemokine levels of TNF-α, CXCL1, CXCL2, and CCL2 in plasma on day 1 after mMI (C), as well as levels of CXCL1 (D) and CXCL2 (E) chemokines in infarcted tissue at post-MI days 1, 3, and 7 were detected by ELISA (n = 4–6/group). (FI) Flow cytometric quantification of monocytes (CD45+CD11b+ly6G) in blood (F) and monocytes and macrophages in infarcted tissue (G) at post-mMI days 1, 3, and 7. Ly6Chi monocytes (H) and CD206+ macrophages (I) in infarcted tissue at post-MI days 1, 3, and 7 (n = 3–10/group). (J) IL-6 cytokine levels in infarcted tissue at post-MI days 1, 3, and 7 were detected by ELISA (n = 3–4/group). (KL) mRNA levels of selected genes involved in inflammatory responses in cM cells isolated from infarcted tissue at day 3 after MI. RNA was extracted from cM cells and then subjected to quantitative PCR (qPCR) (n = 4/group). Data are presented as the mean ± SEM. (MQ) Detection of apoptotic neutrophils and macrophages in mouse heart at post-MI day 3. (M) Frozen sections of heart tissue from LysMcre and mKO mice were double stained for Ly6G (green) and Tunel (red), and nuclei were stained with Hoechst (blue) Scale bars: 25 μm. (N) Same sections as in M, stained for CD68 (green) and Tunel (red); nuclei were stained with Hoechst (blue) Scale bars: 50 μm. (O) Quantitative analysis of ly6G+ (green) and ly6G+Tunel+ cells per field (left y axis) and percentage of ly6G+Tunel+ cells per Ly6G+ nuclei in the infarcted area (right y axis). (P) Quantitative analysis of CD68+, CD68+Tunel+ cells per field (left y axis) and percentage of CD68+Tunel+ per CD68+ nuclei in the infarcted area (right y axis) (n = 4/group). Data are presented as the mean ± SEM. (Q) mRNA levels of selected genes involved in apoptotic cell death in cM cells isolated from infarct tissue at post-MI day 3 (n = 4/group). *P < 0.05, **P < 0.01, and ***P < 0.001, by 2-tailed Student’s t test.
Figure 4
Figure 4. Defective efferocytosis blunts antiinflammatory responses in mKO macrophages.
(AC) Flow cytometric analysis of efferocytosis in BMDMs. BMDMs from WT and mKO mice were treated with CFDA-SE–prelabeled apoptotic RBCs for 3 hours. Representative histograms of total CFDA-SE+ counts (left) and quantitation of phagocytic macrophages (right) (A). Quantitation of the phagocytic index (B) and the percentage of CD206+ phagocytic macrophages (C). All experiments were repeated in 3–4 mice per group. Data are presented as the mean ± SEM. *P < 0.05, by Student’s t test. (DI) qPCR analysis of mRNA levels in macrophages upon coculturing with apoptotic RBCs for 8 hours. All experiments were repeated using macrophages from 3–5 mice per group. Data are presented as the mean ± SEM. **P < 0.01, ***P < 0.001, and ****P < 0.0001, by 2-way ANOVA. (J and K) mRNA levels of selected genes involved in efferocytosis in cM cells isolated from infarcted tissue at day 3 after MI (n = 4/group). Data are presented as the mean ± SEM. *P < 0.05 and **P < 0.01, by 2-tailed Student’s t test.
Figure 5
Figure 5. Activation and proliferation of cardiac myofibroblasts is suppressed in mKO mice after MI.
(A) Representative immunofluorescence images of CF proliferation. LysMcre and mKO mouse hearts were prelabeled with 100 mg/kg EdU 24 hours and 9 hours before harvesting on post-MI day 3. Cryosections of the heart were assessed by Click iT kit to detect Edu (pink) and PDGFRα (green). Nuclei are stained with Hoechst (blue). Scale bars: 50 μm. Arrows show proliferating myofibroblasts, i.e., PDGFRα+ and EdU+ cells. (B) Quantification of proliferating myofibroblasts as a percentage of all PDGFRα+ cells in the infarcted region (n = 4–5/group). Dots represent biological replicates, and data represent the mean ± SEM. ***P < 0.001, by unpaired, 2-tailed Student’s t test. (C) Immunofluorescence imaged of fibronectin in infarcted heart tissue at post-MI day 7. Scale bars: 50 μm. (D) Quantitative morphometry of immunostaining, in which the relative abundance of the stained area was calculated by averaging the results from multiple independent images from f/f and mKO mice (n = 4/group). **P < 0.01, by unpaired, 2-tailed Student’s t test. (E) Representative immunofluorescence images of α-SMA staining in the infarcted region at post-MI day 7: fibronectin (red), α-SMA (green), Hoechst (blue). Scale bars: 50 μm. (F) Quantification of α-SMA+ staining in heart tissue at post-MI day 7 (n = 4 per group). *P < 0.05, by unpaired, 2-tailed Student’s t test. (G and H) mRNA expression levels of col1α (G) and α-SMA (H) were determined by qPCR in CFs treated with supernatants of spent medium of cM cells or control medium. cM cells were isolated from infarcted heart tissue at post-MI day 3 and then cultured in DMEM with 10% FBS for 2 hours or 24 hours. The supernatants of the spent medium or control medium were collected and added to the CF culture for an additional 24 hours. RNA was extracted from CFs and then subjected to qPCR (n = 4/group). Dots represent biological replicates, and data represent the mean ± SEM. **P < 0.01 and ***P < 0.001, by 1-way ANOVA.
Figure 6
Figure 6. Mitochondria-targeted ROS scavenging improves macrophage function and reduces mortality in mKO mice after MI.
(A and B) Apoptotic RBCs were labeled with CFDA-SE and cocultured with mKO BMDMs (±1 μM mtT) for 3 hours. Representative histograms of total CFDA-SE+ cell counts (A) and quantitation of phagocytic macrophages (B) (n = 5/group). **P < 0.01, by 2-tailed Student’s t test. (CH) mRNA levels in mKO BMDMs after mtT (1 μM) or vehicle treatment and coculturing with or without apoptotic RBCs for 8 hours. All values are presented as the fold change relative to untreated control BMDMs. Dashed lines indicate mRNA levels in the control BMDMs cocultured with apoptotic RBCs. Data are shown as the mean ± SEM. All experiments were repeated in BMDMs from 4–5 mice per group. *P < 0.05, **P < 0.01, and ****P < 0.0001, by 2-way ANOVA. (I) Survival rates of mKO mice with or without administration of mito-TEMPO (10 mg/kg day) out to post-MI day 7. *P < 0.05, by Gehan–Breslow–Wilcoxon test. (J) Cardiac rupture rate during the first 7 days after MI. (K) Representative immunofluorescence images of cardiac myofibroblast proliferation at post-MI day 3. Proliferating myofibroblasts were identified (white arrows) as PDGFRα+ (green) and EdU+ (pink). Nuclei are stained with Hoechst (blue). Scale bar: 25 μm. (L) Quantitation of PDGFRα+ and EdU+ cells as a percentage of total PDGFRα+ cells in the infarcted region (n = 4–5/group). Dots represent biological replicates, and data represent the mean ± SEM. (M) Immunofluorescence images of fibronectin in infarcted heart tissue at post-MI day 7. Scale bars: 25 μm. (N) Quantitative morphometry of immunostaining, in which the relative abundance of the stained area was calculated by averaging the results from multiple independent images of heart sections (n = 4/group). (O) Representative immunofluorescence images of α-SMA in the infarcted heart section at post-MI day 7: fibronectin (red), α-SMA (green), and Hoechst (blue). Scale bars: 50 μm. (P) Quantification of α-SMA+ levels in heart tissue at post-MI day 7 (n = 4/group). Dots represent biological replicates, and data represent the mean ± SEM.

Comment in

  • Mitochondrial function in macrophages controls cardiac repair after myocardial infarction

References

    1. Mouton AJ, et al. Mapping macrophage polarization over the myocardial infarction time continuum. Basic Res Cardiol. 2018;113(4):26. doi: 10.1007/s00395-018-0686-x. - DOI - PMC - PubMed
    1. Heidt T, et al. Differential contribution of monocytes to heart macrophages in steady-state and after myocardial infarction. Circ Res. 2014;115(2):284–295. doi: 10.1161/CIRCRESAHA.115.303567. - DOI - PMC - PubMed
    1. Mantovani A, et al. Macrophage polarization: tumor-associated macrophages as a paradigm for polarized M2 mononuclear phagocytes. Trends Immunol. 2002;23(11):549–555. doi: 10.1016/S1471-4906(02)02302-5. - DOI - PubMed
    1. Mezzaroma E, et al. The inflammasome promotes adverse cardiac remodeling following acute myocardial infarction in the mouse. Proc Natl Acad Sci U S A. 2011;108(49):19725–19730. doi: 10.1073/pnas.1108586108. - DOI - PMC - PubMed
    1. Jung M, et al. IL-10 improves cardiac remodeling after myocardial infarction by stimulating M2 macrophage polarization and fibroblast activation. Basic Res Cardiol. 2017;112(3):33. doi: 10.1007/s00395-017-0622-5. - DOI - PMC - PubMed

Publication types

Substances