Review
. 2023 Feb;10(4):e2205540.
doi: 10.1002/advs.202205540. Epub 2022 Dec 8.

Advances in Selective Electrochemical Oxidation of 5-Hydroxymethylfurfural to Produce High-Value Chemicals

Affiliations
Review

Advances in Selective Electrochemical Oxidation of 5-Hydroxymethylfurfural to Produce High-Value Chemicals

Lei Guo et al. Adv Sci (Weinh). 2023 Feb.

Abstract

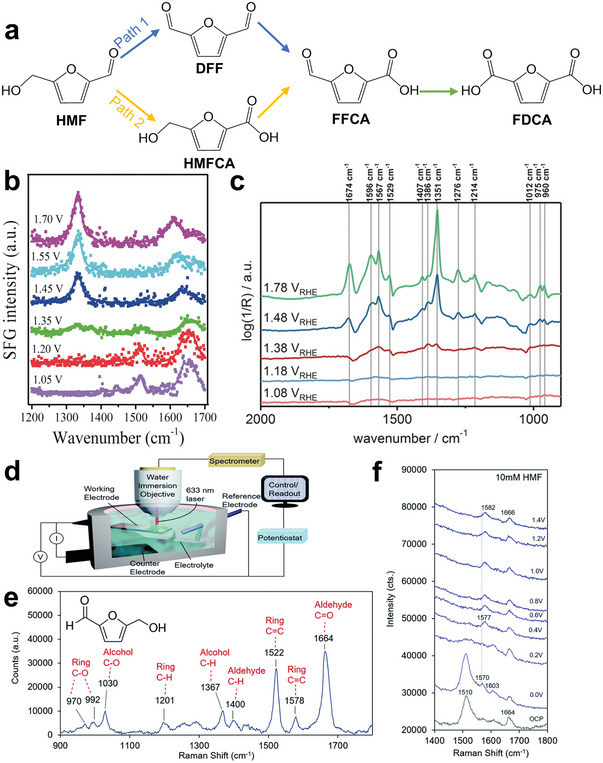
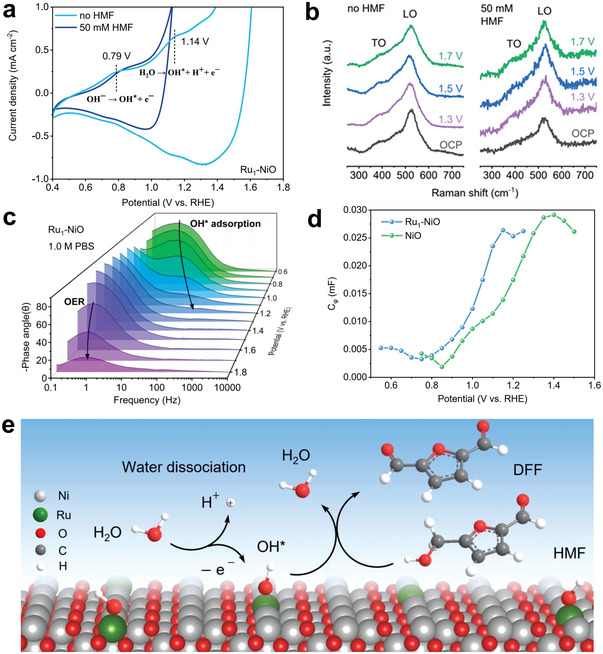
The conversion of biomass is a favorable alternative to the fossil energy route to solve the energy crisis and environmental pollution. As one of the most versatile platform compounds, 5-hydroxymethylfural (HMF) can be transformed to various value-added chemicals via electrolysis combining with renewable energy. Here, the recent advances in electrochemical oxidation of HMF, from reaction mechanism to reactor design are reviewed. First, the reaction mechanism and pathway are summarized systematically. Second, the parameters easy to be ignored are emphasized and discussed. Then, the electrocatalysts are reviewed comprehensively for different products and the reactors are introduced. Finally, future efforts on exploring reaction mechanism, electrocatalysts, and reactor are prospected. This review provides a deeper understanding of mechanism for electrochemical oxidation of HMF, the design of electrocatalyst and reactor, which is expected to promote the economical and efficient electrochemical conversion of biomass for industrial applications.

Keywords: HMF oxidation electrolysis; biomass upgrading; electrocatalyst; reaction mechanism; reactor.


Conflict of interest statement

The authors declare no conflict of interest.

Figures

Scheme 1
Scheme 1
Schematic diagram of green transformation for HMF and the wide application of value‐added chemicals.
Figure 1
Figure 1
a) Two reaction paths of electrooxidation of HMF; b) SFG spectra with ssp (polarization direction of the light source) polarizations recorded at the working electrode/electrolyte interface after running the cell at various voltages for 90 min. Reproduced with permission.[ 20a ] Copyright 2019, Wiley‐VCH. c) Operando ATR‐Fourier transform infrared spectra recorded at various applied potentials between 0.98 V versus reversible hydrogen electrode (RHE) and 1.78 V versus RHE after 20 min of applied potential. Reproduced with permission.[ 21a ] Copyright 2018, Wiley‐VCH. d) Operando SERS with a custom‐built reaction cell and water immersion objective; e) a spectrum of a 500 × 10−3 m aqueous solution of HMF; f) in situ Raman spectra of HMF under different voltages in 10 × 10−3 m KOH. Reproduced with permission.[ 22 ] Copyright 2020, Royal Society of Chemistry.
Figure 2
Figure 2
a) Scheme of nucleophile oxidation reaction mechanism for β‐Ni(OH)2. Reproduced with permission.[ 23b ] Copyright 2020, Cell Press. b) Scheme of electrooxidation of HMF by organic molecular. Reproduced with permission.[ 24 ] Copyright 2019, American Chemical Society.
Scheme 2
Scheme 2
The OH* mechanisms of the electrooxidation of HMF through a) path 1 and b) path 2. Reproduced with permission.[ 25 ] Copyright 2021, Royal Society of Chemistry.
Scheme 3
Scheme 3
Schematic diagram of possible mixing mechanism of a) path 1 and b) path 2.
Figure 3
Figure 3
a) Current density of the HMF oxidation in the flow cell at 1.55 V versus RHE. Reproduced with permission.[ 41 ] Copyright 2018, Springer. b) 10 h stability test with 5‐HMF conversion and FDCA yield for NiFe(‐Cl)‐LDH@NF in 0.1 m KOH with 10 × 10−3 m 5‐HMF, where HPLC samples were taken and the electrolyte was replaced every 2 h; c) pulse stability test of NiFe(‐Cl)‐LDH@NF. Reproduced with permission.[ 42 ] Copyright 2021, Cell Press.
Figure 4
Figure 4
a) CV curves of Ru‐NiO in 1.0 m PBS with and without 50 × 10−3 m HMF; b) the ex situ Raman spectra of Ru‐NiO after electrocatalysis of 5 min; c) bode plots of Ru‐NiO which can indicate the adsorption of OH* on the catalyst surface; d) plots of Cϕ versus potential for catalysts in 1.0 m PBS which represent the surface coverages of OH* at the interface between Ru‐NiO and the DDL; e) proposed HMFOR mechanism over Ru‐NiO in the neutral medium. Reproduced with permission.[ 28 ] Copyright 2022, Wiley‐VCH.
Scheme 4
Scheme 4
a,b) Controversial reaction pathways of HMF oxidation on Pd/C and Au/C electrocatalysts in alkaline media. a) Reproduced with permission.[ 34 ] Copyright 2020, American Chemical Society. b) Reproduced with permission.[ 33 ] Copyright 2014, Royal Society of Chemistry.
Figure 5
Figure 5
a) Schematic representation of the formation of FeSn2 and α‐FeIIIO(OH)@FeSn2 and b) Raman spectra of the FeSn2/FTO before (black) and after OER CA (red), c) PXRD pattern of the FeSn2/FTO before (black) and after OER CA (red). Reproduced with permission.[ 72 ] Copyright 2020, Wiley‐VCH. d) Raman data of pristine FeSi powder and in situ during OER. The numbers represent the frequencies in cm−1 of the Raman bands and e) Fe Kα XANES spectra. The black line is a linear combination of FeSi powder and FeOOH in a 1 to 1 ratio, f) EXAFS spectra together with their simulations. The green dotted line is the result of the subtraction of the FeSi powder spectrum FT amplitude from the FeSi OER in situ spectrum FT amplitude to gain an EXAFS plot that reflects the newly formed iron(III) phase. Reproduced with permission.[ 73 ] Copyright 2021, Wiley‐VCH.
Figure 6
Figure 6
a) A Scheme to show the relative performance for electrochemical HMF oxidation to the targeted product on spinel oxides by building geometric sites of the tetrahedron (Zn2+) or octahedron (Al3+) and b) LSV curves of ZnCo2O4, Co3O4, and CoAl2O4 normalized by BET area. Reproduced with permission.[ 76 ] Copyright 2020, Wiley‐VCH. c) Cyclic voltammograms of Co3O4 in 1 m KOH at a scan rate of 50 mV s−1. Reproduced with permission.[ 78 ] Copyright 2022, American Chemical Society. d,e) The reaction mechanism of HMFOR on Co3O4 and Vo‐Co3O4. Reproduced with permission.[ 79b ] Copyright 2021, Wiley‐VCH.
Figure 7
Figure 7
a) Schematic representation of crystal structure transformation among surface Ni(OH)2 octahedron, surface Ni(OH)O intermediate, and complex surface NiO x (OH) y , b) operando Raman spectroscopy during OER and c) HMFOR, d) schematic illustrations of OER and e) HMFOR system at Ni(OH)2 electrode. Reproduced with permission.[ 85 ] Copyright 2021, Wiley‐VCH. f) Mechanistic illustration of the potential‐dependent oxidation of HMF to produce HMFCA and FDCA, as mediated by electrogenerated Co3+ and Co4+ species. Reproduced with permission.[ 86 ] Copyright 2021, Wiley‐VCH.
Figure 8
Figure 8
SEM images of thin a) NiOOH, b) CoOOH, c) FeOOH films used for voltammetric studies. LSVs of thin d) Ni(OH)2, e) Co(OH)2, and f) FeOOH films in a 0.1 m KOH solution (scan rate: 5 mV s−1). Three consecutive LSVs were obtained in the same solution; the first (black) and second (blue) LSVs were performed in the absence of HMF, while the third (red) was performed after the addition of 5 × 10−3 m HMF. Reproduced with permission.[ 30b ] Copyright 2018, American Chemical Society.
Figure 9
Figure 9
a) Schematic diagram of the oxyhydroxide‐centered dual‐cycle mechanism for competitive OER and HMFOR and in situ Raman study of NiFeP catalysts during b) OER and c) HMFOR in 0.1 m KOH electrolyte with 10 × 10−3 m HMF. Reproduced with permission.[ 96 ] Copyright 2022, Elsevier. d) Fourier transformed EXAFS spectra of Ni3N during HMFOR and e) in situ XANES spectra of Ni K‐edge, f) in situ Raman spectra of Ni3N for HMFOR. Reproduced with permission.[ 19b ] Copyright 2021, Elsevier.
Scheme 5
Scheme 5
Comparison of the PEC and electrochemical cells. a) PEC TEMPO‐mediated HMF oxidation. b) Electrochemical TEMPO‐mediated HMF oxidation. CB, conduction band; EF, Fermi energy. Reproduced with permission.[ 110 ] Copyright 2015, Springer Nature.
Figure 10
Figure 10
Schematic illustration of a) undivided cell, b) H‐type cell, c) flow cell. Reproduced with permission.[ 43 ] Copyright 2021, Royal Society of Chemistry, and d) MEA‐based electrolyzer. Reproduced with permission.[ 42 ] Copyright 2021, Cell Press.
Figure 11
Figure 11
Schematics from a) state‐of‐the art CCM and b) PTE‐type MEA to c) Direcet membrane deposition MEA (DMD‐MEA); d) sealing concept based on DMD‐MEA setup membrane is directly deposited onto the cathode PTE and the PTFE frame. Reproduced with permission.[ 125 ] Copyright 2019, Elsevier. e) Step synthesis of novel 3D‐ordered MEA by electrodeposition and direct membrane deposition methods. Reproduced with permission.[ 126 ] Copyright 2022, Royal Society of Chemistry.
Figure 12
Figure 12
a) Schematic illustration of the MEA configurations with different ion‐selective membranes, including AEM, CEM, and BPM. Red arrows indicate the possible charge‐carrying ionic species that transport across the membranes. b) Cell voltage profiles for continuous 24 h electrolysis in the systems with AEM, CEM, and BPM at 2 mA cm−2 (10 mA). c) FE of electrochemical hydrogenation (left columns) and electrochemical oxidation (right columns) in different configurations. Reproduced with permission.[ 128 ] Copyright 2019, Chemistry Europe.
Figure 13
Figure 13
Electrochemical reactor operation in a) flow‐by mode operation and b) flow‐through mode operation. Reproduced with permission.[ 146 ] Copyright 2019, American Chemical Society. The designed and 3D‐printed component assembly of the c) flow‐by reactor and d) flow‐through reactor; e) HMF conversion, FDCA selectivity, and FE under different flow rates of the flow‐through and flow‐by reactors; f) the HMFOR of the flow‐through reactor under ten successive cycles. Reproduced with permission.[ 136 ] Copyright 2019, Royal Society of Chemistry.

Similar articles

Cited by

References

    1. a) Davidson D. J., Andrews J., Science 2013, 339, 1286; - PubMed
    2. b) Kittner N., Lill F., Kammen D. M., Nat. Energy 2017, 2, 17125.
    1. a) Zhang L., Liu Z., Cui G., Chen L., Prog. Polym. Sci. 2015, 43, 136;
    2. b) Feng Y., Long S., Tang X., Sun Y., Luque R., Zeng X., Lin L., Chem. Soc. Rev. 2021, 50, 6042. - PubMed
    1. a) Zhou C.‐H., Xia X., Lin C.‐X., Tong D.‐S., Beltramini J., Chem. Soc. Rev. 2011, 40, 5588; - PubMed
    2. b) Jing Y., Guo Y., Xia Q., Liu X., Wang Y., Chem 2019, 5, 2520.
    1. a) Chen Z., Liao S., Ge L., Amaniampong P. N., Min Y., Wang C., Li K., Lee J.‐M., Chem. Eng. J. 2020, 379, 122284;
    2. b) Zhao J., Yan Y., Hu Z.‐T., Jose V., Chen X., Lee J.‐M., Catal. Sci. Technol. 2020, 10, 4179.
    1. a) Bozell J. J., Petersen G. R., Green Chem. 2010, 12, 539;
    2. b) Xu C., Paone E., Rodríguez‐Padrón D., Luque R., Mauriello F., Chem. Soc. Rev. 2020, 49, 4273. - PubMed