

Activation of ChvG-ChvI regulon by cell wall stress confers resistance to β-lactam antibiotics and initiates surface spreading in Agrobacterium tumefaciens
- PMID: 36480495
- PMCID: PMC9731437
- DOI: 10.1371/journal.pgen.1010274
Activation of ChvG-ChvI regulon by cell wall stress confers resistance to β-lactam antibiotics and initiates surface spreading in Agrobacterium tumefaciens
Abstract
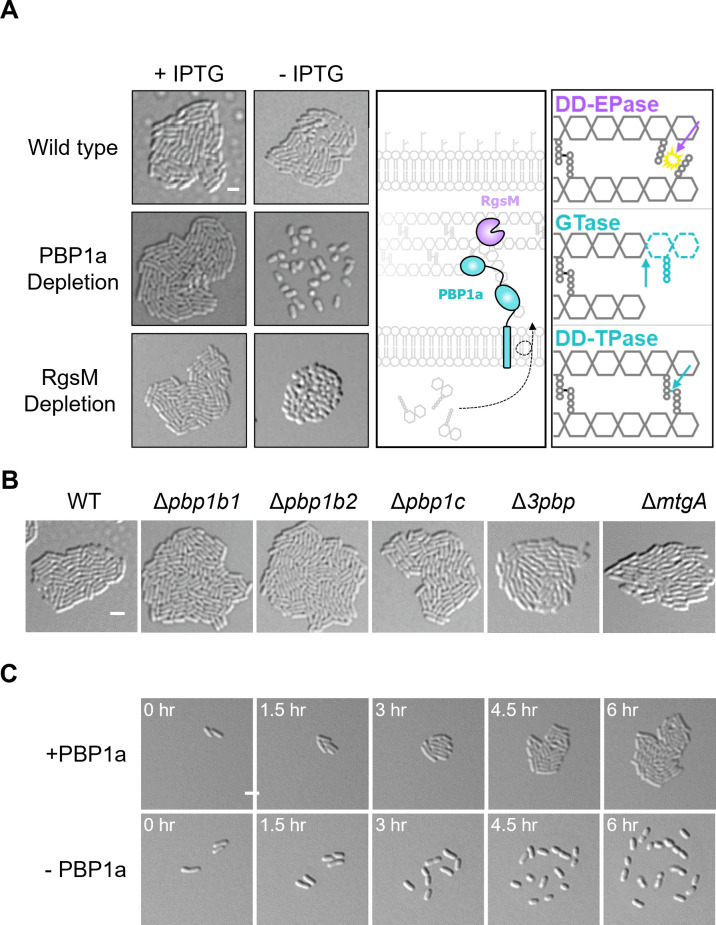
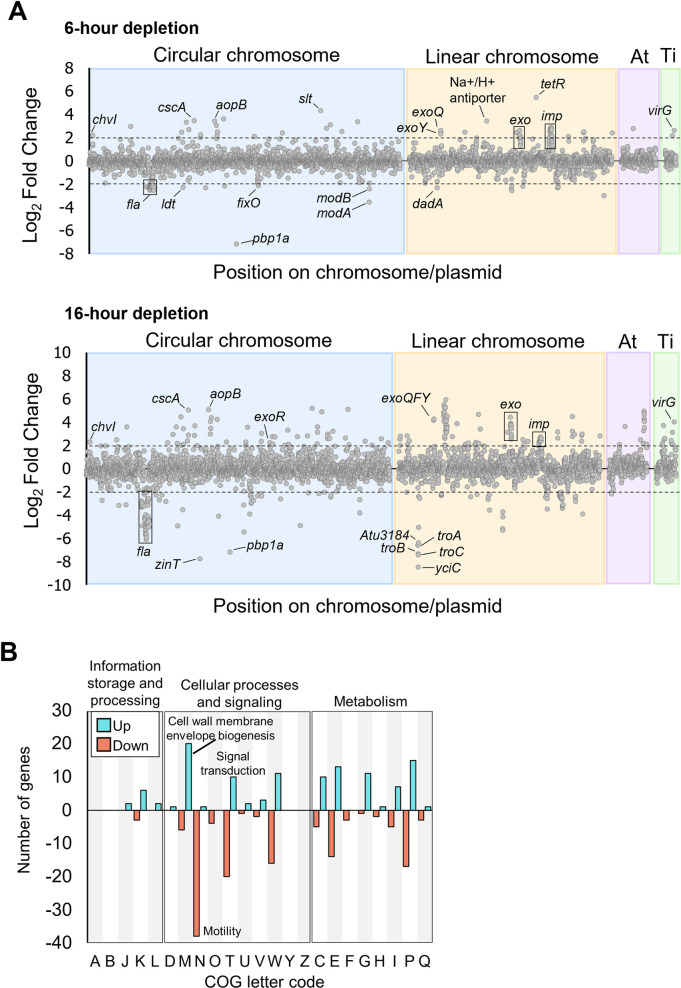
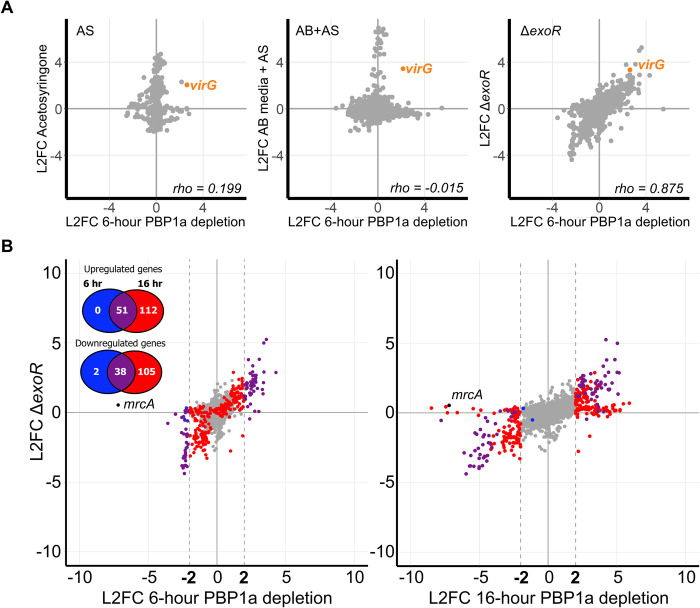
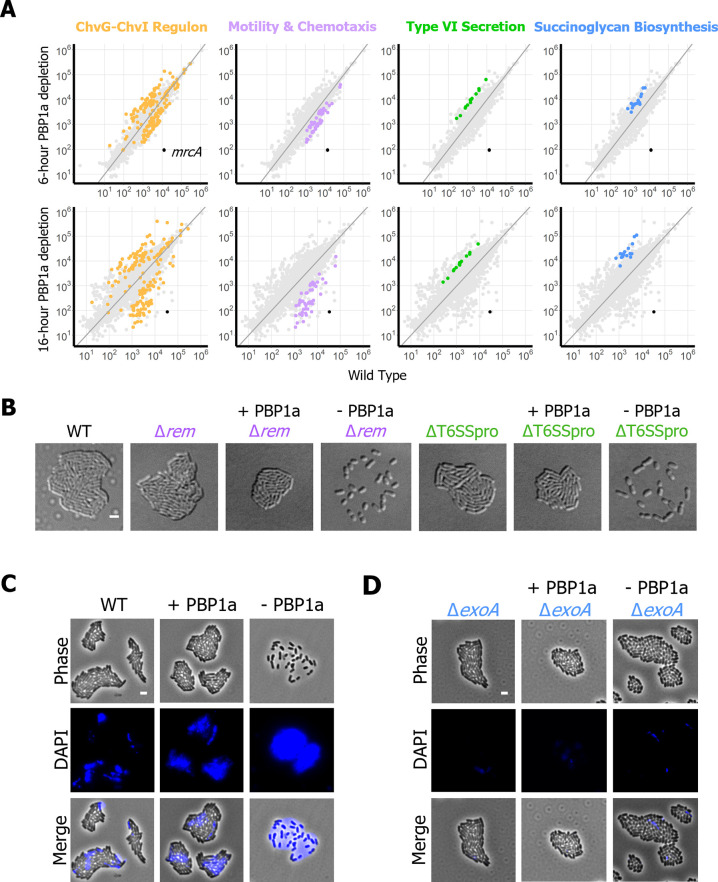
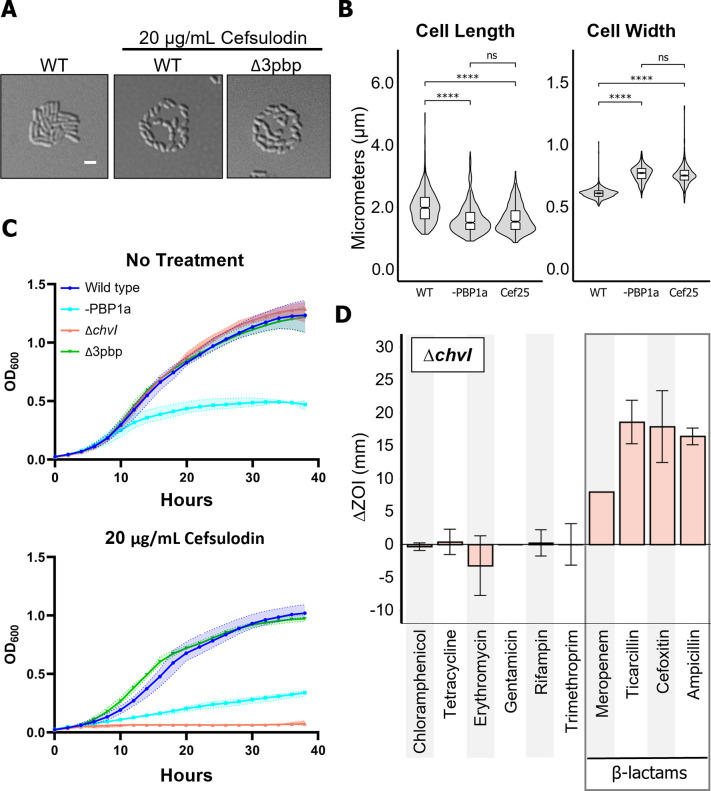
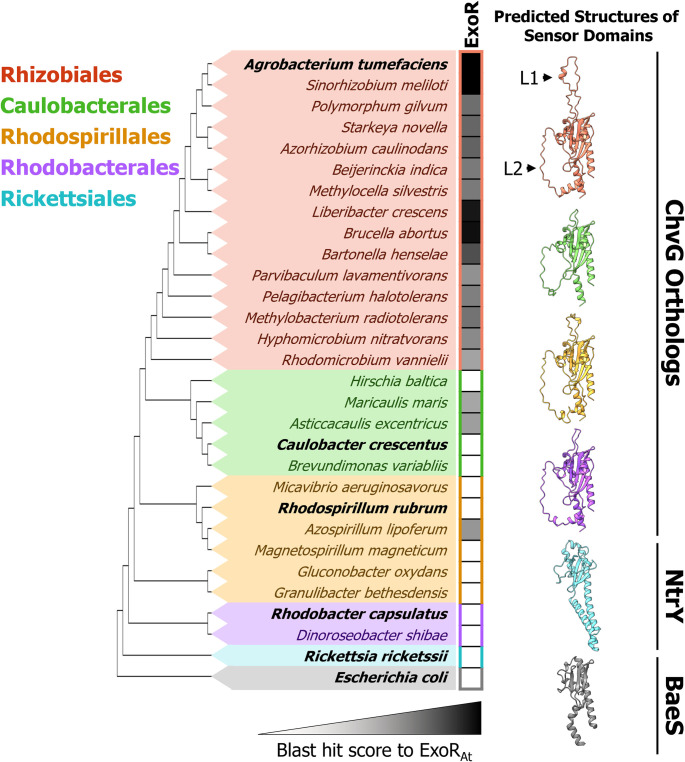
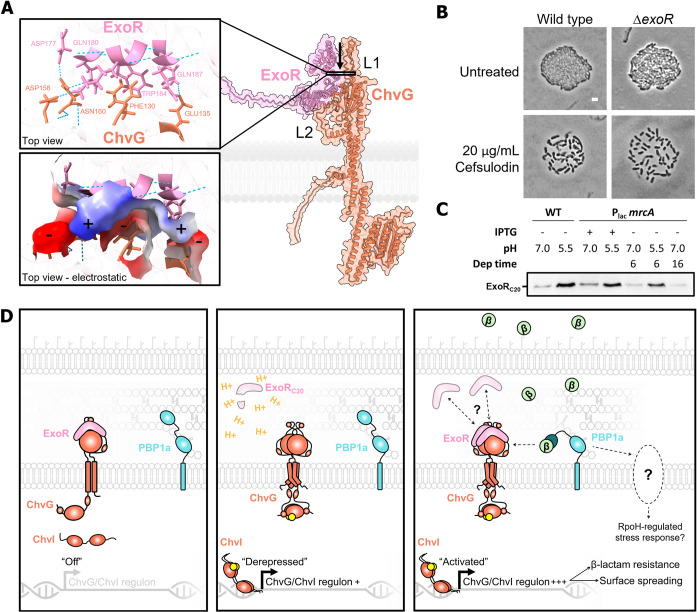
A core component of nearly all bacteria, the cell wall is an ideal target for broad spectrum antibiotics. Many bacteria have evolved strategies to sense and respond to antibiotics targeting cell wall synthesis, especially in the soil where antibiotic-producing bacteria compete with one another. Here we show that cell wall stress caused by both chemical and genetic inhibition of the essential, bifunctional penicillin-binding protein PBP1a prevents microcolony formation and activates the canonical host-invasion two-component system ChvG-ChvI in Agrobacterium tumefaciens. Using RNA-seq, we show that depletion of PBP1a for 6 hours results in a downregulation in transcription of flagellum-dependent motility genes and an upregulation in transcription of type VI secretion and succinoglycan biosynthesis genes, a hallmark of the ChvG-ChvI regulon. Depletion of PBP1a for 16 hours, results in differential expression of many additional genes and may promote a stress response, resembling those of sigma factors in other bacteria. Remarkably, the overproduction of succinoglycan causes cell spreading and deletion of the succinoglycan biosynthesis gene exoA restores microcolony formation. Treatment with cefsulodin phenocopies depletion of PBP1a and we correspondingly find that chvG and chvI mutants are hypersensitive to cefsulodin. This hypersensitivity only occurs in response to treatment with β-lactam antibiotics, suggesting that the ChvG-ChvI pathway may play a key role in resistance to antibiotics targeting cell wall synthesis. Finally, we provide evidence that ChvG-ChvI likely has a conserved role in conferring resistance to cell wall stress within the Alphaproteobacteria that is independent of the ChvG-ChvI repressor ExoR.
Copyright: © 2022 Williams et al. This is an open access article distributed under the terms of the Creative Commons Attribution License, which permits unrestricted use, distribution, and reproduction in any medium, provided the original author and source are credited.
Conflict of interest statement
The authors have declared that no competing interests exist.
Figures
Similar articles
-
Activation of the ChvG-ChvI pathway promotes survival during cell wall stress in Agrobacterium tumefaciens.Mol Biol Cell. 2025 Jul 1;36(7):ar84. doi: 10.1091/mbc.E24-12-0546. Epub 2025 May 15. Mol Biol Cell. 2025. PMID: 40372762
-
The ChvG-ChvI Regulatory Network: A Conserved Global Regulatory Circuit Among the Alphaproteobacteria with Pervasive Impacts on Host Interactions and Diverse Cellular Processes.Annu Rev Microbiol. 2023 Sep 15;77:131-148. doi: 10.1146/annurev-micro-120822-102714. Epub 2023 Apr 11. Annu Rev Microbiol. 2023. PMID: 37040790 Review.
-
Acid-induced type VI secretion system is regulated by ExoR-ChvG/ChvI signaling cascade in Agrobacterium tumefaciens.PLoS Pathog. 2012 Sep;8(9):e1002938. doi: 10.1371/journal.ppat.1002938. Epub 2012 Sep 27. PLoS Pathog. 2012. PMID: 23028331 Free PMC article.
-
Motility control through an anti-activation mechanism in Agrobacterium tumefaciens.Mol Microbiol. 2021 Nov;116(5):1281-1297. doi: 10.1111/mmi.14823. Epub 2021 Oct 19. Mol Microbiol. 2021. PMID: 34581467 Free PMC article.
-
Constructing and deconstructing the bacterial cell wall.Protein Sci. 2020 Mar;29(3):629-646. doi: 10.1002/pro.3737. Epub 2019 Nov 20. Protein Sci. 2020. PMID: 31747090 Free PMC article. Review.
Cited by
-
Transcriptomic response of Sinorhizobium meliloti to the predatory attack of Myxococcus xanthus.Front Microbiol. 2023 Jun 19;14:1213659. doi: 10.3389/fmicb.2023.1213659. eCollection 2023. Front Microbiol. 2023. PMID: 37405170 Free PMC article.
-
The role of CenKR in the coordination of Rhodobacter sphaeroides cell elongation and division.mBio. 2023 Aug 31;14(4):e0063123. doi: 10.1128/mbio.00631-23. Epub 2023 Jun 7. mBio. 2023. PMID: 37283520 Free PMC article.
-
LD-transpeptidation is crucial for fitness and polar growth in Agrobacterium tumefaciens.PLoS Genet. 2024 Oct 21;20(10):e1011449. doi: 10.1371/journal.pgen.1011449. eCollection 2024 Oct. PLoS Genet. 2024. PMID: 39432536 Free PMC article.
-
A protease and a lipoprotein jointly modulate the conserved ExoR-ExoS-ChvI signaling pathway critical in Sinorhizobium meliloti for symbiosis with legume hosts.PLoS Genet. 2023 Oct 23;19(10):e1010776. doi: 10.1371/journal.pgen.1010776. eCollection 2023 Oct. PLoS Genet. 2023. PMID: 37871041 Free PMC article.
References
-
- Yuan Z-C, Haudecoeur E, Faure D, Kerr KF, Nester EW. Comparative transcriptome analysis of Agrobacterium tumefaciens in response to plant signal salicylic acid, indole-3-acetic acid and γ-amino butyric acid reveals signalling cross-talk and Agrobacterium -plant co-evolution. Cell Microbiol. 2008;10: 2339–2354. doi: 10.1111/j.1462-5822.2008.01215.x - DOI - PubMed
Publication types
MeSH terms
Substances
Grants and funding
LinkOut - more resources
Full Text Sources
