. 2022 Dec 8;18(12):e1011022.
doi: 10.1371/journal.ppat.1011022. eCollection 2022 Dec.

Properties of rabies virus phosphoprotein and nucleoprotein biocondensates formed in vitro and in cellulo

Affiliations

Properties of rabies virus phosphoprotein and nucleoprotein biocondensates formed in vitro and in cellulo

Quentin Nevers et al. PLoS Pathog. .

Abstract

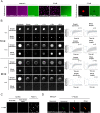
Rabies virus (RABV) transcription and replication take place within viral factories having liquid properties, called Negri bodies (NBs), that are formed by liquid-liquid phase separation (LLPS). The co-expression of RABV nucleoprotein (N) and phosphoprotein (P) in mammalian cells is sufficient to induce the formation of cytoplasmic biocondensates having properties that are like those of NBs. This cellular minimal system was previously used to identify P domains that are essential for biocondensates formation. Here, we constructed fluorescent versions of N and analyzed by FRAP their dynamics inside the biocondensates formed in this minimal system as well as in NBs of RABV-infected cells using FRAP. The behavior of N appears to be different of P as there was no fluorescence recovery of N proteins after photobleaching. We also identified arginine residues as well as two exposed loops of N involved in condensates formation. Corresponding N mutants exhibited distinct phenotypes in infected cells ranging from co-localization with NBs to exclusion from them associated with a dominant-negative effect on infection. We also demonstrated that in vitro, in crowded environments, purified P as well as purified N0-P complex (in which N is RNA-free) form liquid condensates. We identified P domains required for LLPS in this acellular system. P condensates were shown to associate with liposomes, concentrate RNA, and undergo a liquid-gel transition upon ageing. Conversely, N0-P droplets were disrupted upon incubation with RNA. Taken together, our data emphasize the central role of P in NBs formation and reveal some physicochemical features of P and N0-P droplets relevant for explaining NBs properties such as their envelopment by cellular membranes at late stages of infection and nucleocapsids ejections from the viral factories.


Conflict of interest statement

The authors have declared that no competing interests exist.

Figures
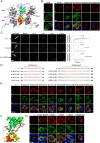
Fig 1
Fig 1. Structural elements of RABV nucleoprotein required for the formation of biomolecular condensates in a cellular minimal system.
A) Ribbon representation of the crystal structure of RABV nucleoprotein (PDB 2GTT). Three protomers are shown in complex with RNA (in magenta). The RNA molecule is located in a groove between N amino-terminal domain (NTD) and carboxyterminal domain (CTD). Both domains are extended by two elongated arms (NTarm and CTarm). The central protomer is rainbow colored from N (blue) to C (red) terminus. The loops L1 and L2, absent in the crystal structure, are represented by dotted lines and their position indicated by arrows. The insertion sites between residues 128–129 and 130–131 are also indicated by arrows. B) BSR-T7/5 cells were co-transfected with pTit plasmids encoding P protein and the indicated fluorescent (GFP-N, N-106GFP107, N-112GFP113, N-128GFP129 and N-130GFP131) or non fluorescent N constructions. Cells were fixed 24 h post transfection and the formation of N-P inclusions was assessed by fluorescence confocal microscopy. P was revealed with a rabbit polyclonal anti-P antibody followed by incubation with Alexa-568 goat anti-rabbit IgG. Scale bar: 10 μm. C) N/P-mCherry inclusions as well as GFP-N/P, and N-128GFP129/P inclusions (observed in BSR-T7/5 cells co-transfected as in B) were photobleached and the recovery of fluorescence was imaged with a Spinning-Disk microscope. Scale bars: 5 μm. For the plots on the right, FRAP data were corrected for background, normalized to the minimum and maximum intensity. The mean is shown with error bars representing the SD. D) Sequence of N mutants in which one or several stretches of amino acids in loops L1 and L2 have been replaced by one or several GGGS linkers (L). E) BSR-T7/5 cells were co-transfected with pTit plasmids encoding the indicated N mutant (mutated in L1 and L2) and the P protein. Cells were fixed 24 h post transfection and the formation of N-P inclusions was assessed by fluorescence confocal microscopy. N was revealed with a mouse monoclonal anti-N antibody followed by incubation with Alexa-488 goat anti-mouse IgG antibody and P was revealed with a rabbit polyclonal anti-P antibody followed by incubation with Alexa-568 donkey anti-rabbit IgG. Scale bar: 10 μm. F) View of the RNA binding groove of the crystal structure of RABV N. Arginines pointing toward the phosphodiester backbone (in sticks representation) are indicated. G) BSR-T7/5 cells were co-transfected with pTit plasmids encoding the indicated N mutant and the P protein. Cells were fixed 24 h post transfection and the formation of N-P inclusions was assessed by fluorescence confocal microscopy. N was revealed with a mouse monoclonal anti-N antibody followed by incubation with Alexa-488 goat anti-mouse IgG and P was revealed with a rabbit polyclonal anti-P antibody followed by incubation with Alexa-568 donkey anti-rabbit IgG. Scale bar: 10 μm.
Fig 2
Fig 2. Characterization of the behavior of chimeras between GFP and N in RABV infected cells.
A-C) BSR-T7/5 cells were infected at an MOI of 0.5 by RABV (CVS strain) and transfected 1h post adsorption with pTit plasmids encoding the indicated N constructs. Cells were fixed 14 h post transfection and the localization of viral proteins and ectopically expressed N mutants was assessed by fluorescence confocal microscopy. A) N protein (either virally encoded or in the GFP-N chimera) was revealed with a mouse monoclonal anti-N antibody followed by incubation with Alexa-488 goat anti-mouse IgG. Scale bars: 10 μm and 2μm for the magnified image. B) Localization of viral P protein (revealed with a rabbit polyclonal anti-P antibody followed by incubation with Alexa-568 donkey anti-rabbit IgG) and GFP-N chimeras in RABV infected cells. Scale bar: 10 μm. C) Effect of GFP-N and N-106GFP107 expression on RABV cell infection. P was revealed with a rabbit polyclonal anti-P antibody followed by incubation with Alexa-568 donkey anti-rabbit IgG. Asterisks indicate cells that are infected and express GFP-N. Note that GFP-N localization is diffuse in the cells that are not infected. Infected cells expressing N-106GFP107 are rare and absent in the displayed field. Scale bar: 10 μm. D) Percentages of infected, transfected, as well as both infected and transfected cells (for GFP-N and N-106GFP107 chimeras) were assessed from experiments such as those presented in Fig 2C. Values are the average of 3 independent experiments ± SD. The total number of cells analyzed was 1555 (353 + 407 + 795) for GFP-N and 1804 (241 + 615 + 948) for N-106GFP107. p-values were calculated using two-tailed Student’s t test. E) NBs containing P-mCherry, GFP-N or N-112GFP113 constructs were photobleached and the recovery of fluorescence was imaged with a spinning disk microscope. Whole NBs as well as NBs’ subvolumes were photobleached. Scale bars: 5 μm. For the plots on the right, FRAP data were corrected for background, normalized to the minimum and maximum intensity. The mean is shown with error bars representing the SD.
Fig 3
Fig 3. Quantification of N and P concentrations in the dilute and dense phases.
A-H) BSR-T7/5 cells were co-transfected with pTit plasmids encoding P-mCherry protein and the indicated fluorescent N constructs (GFP-N, N-128GFP129, N-130GFP131, GFP-N-R168A and GFP-N-R323A). Cells were fixed 24 h post-transfection and the concentrations of ectopically expressed P and N (wild-type and mutants) were determined by measuring fluorescence intensity from confocal images. A) Histogram showing the mean (± SD) areal fluorescence (calculated from 5 different locations for each cell) of both GFP-N and P-mCherry in the dilute phase for 10 random cells. B) Plot of areal fluorescence in dense vs dilute phase of GFP-N (left) or P-mCherry (right) for 10 random cells. C-D) Plot of areal fluorescence of N constructs (GFP-N, N-128GFP129 and N-130GFP131) vs areal fluorescence of P-mCherry in dilute (C) and dense (D) phases. Data points represent 3 independent experiments (10 cells were quantified per independent experiment). Data points from the same experiment are represented by the same symbol (squares, circles and triangles). The dashed lines represent the trend. E) Table giving the mean (± SD) of the average areal fluorescence calculated for the indicated GFP-N constructs and P-mCherry in both dilute and dense phases in each 3 independent experiment. P-values were calculated using a Student t-test. F-G) Plot of areal fluorescence of N constructs (GFP-N, GFP-N-R168A and GFP-N-R323A) vs areal fluorescence of P-mCherry in dilute (F) and dense (G) phases. Data points represent 3 independent experiments (10 cells were quantified per independent experiment). Data points from the same experiment are represented by the same symbol (squares, circles and triangles). The dashed lines represent the trend. H) Table giving the mean (± SD) of the average areal fluorescence calculated for the indicated GFP-N constructs and P-mCherry in both dilute and dense phases in each 3 independent experiment. P-values were calculated using a Student t-test. I-M) BSR-T7/5 cells were infected at an MOI of 0.5 by rCVS-P-mCherry and transfected 1h post adsorption with pTit plasmids encoding the indicated fluorescent N constructions (GFP-N, N-112GFP113 and N-130GFP131). Cells were fixed 14 h post-transfection and the concentrations of fluorescent versions of P and N were determined by measuring fluorescence intensity from confocal images. I) Histogram showing the mean (± SD) areal fluorescence (calculated from 5 different locations for each cell) of both GFP-N and P-mCherry in the dilute phase for 10 random cells. J) Plot of areal fluorescence in dense vs dilute phase of GFP-N (left) or P-mCherry (right) for 10 random cells. K-L) Plot of areal fluorescence of N constructs (GFP-N, N-112GFP113 and N-130GFP131) vs areal fluorescence of P-mCherry in dilute (K) and dense (L) phases. Data points represent 3 independent experiments (10 cells were quantified per independent experiment). Data points from the same experiment are represented by the same symbol (squares, circles and triangles). The dashed lines represent the trend. M) Table giving the mean (± SD) of the average areal fluorescence calculated for the indicated GFP-N constructs and P-mCherry in both dilute and dense phases in each 3 independent experiments. P-values were calculated using a Student t-test.
Fig 4
Fig 4. RABV P alone phase separates in crowded environments.
A) Schematic representation of the organization of RABV P construct used. P contains an N-terminal domain (NTD) that associates with N in the N0-P complex and with the viral polymerase, two intrinsically disordered domains (IDD1 and IDD2), a dimerization domain (DD) and a C-terminal domain (CTD) that binds N associated with RNA. The cysteine at position 261 was replaced by a serine so that the resulting protein has only one cysteine residue in position 297. A StrepTagII was used to purify the protein. B) SDS PAGE analysis of purified P proteins. C) P-Strep protein expressed in E. coli at 10 μM concentration (320 μg/ml) (resp. full-length P protein expressed in Hi-5 cells at 5 μM) was incubated in absence or presence of 5% PEG 8000 in 125 mM NaCl, 20 mM Tris-HCl pH7.5. Droplets were imaged by differential interference contrast (DIC). Scale bar: 10 μm. D) P-Strep droplets were observed by fluorescence microscopy at different P concentrations in absence or presence of different molecular crowders in 50 mM NaCl, 20 mM Tris-HCl pH7.5. The mix contained 25 nM of P protein covalently labelled with Cy3 maleimide probe. Scale bars: 10 μm. E) Box plot representation of P-Strep droplets aspect ratios (formed at 5 μM with 5% PEG8000 as in D). Sample size: n = 936. The cross on the boxplot indicates the mean. F) Left panel: P-Strep droplets were observed by fluorescence microscopy at different concentrations in presence of 5% PEG 8000 and increasing concentrations of NaCl in 20 mM Tris-HCl pH 7.5 buffer. The mix contained 25 nM of P protein covalently labelled with Cy3 maleimide probe. Scale bars: 10 μm. Right panel: phase diagram at various P-Strep concentrations and with increasing concentrations of NaCl in presence of 5% PEG 8000. G) Fusion between P-Strep droplets ([P] = 20 μM in the presence of 3% PEG 8000, 125 mM NaCl, 20 mM Tris-HCl pH 7.5) imaged by time-lapse video-microscopy. Images were extracted from S2 Movie at the indicated times. Scale bar: 2 μm. H) Droplets formed by P-Strep at the concentration of 20 μM (50 nM of fluorescent P protein) in the presence of 5% PEG 8000 in 125 mM NaCl, 20 mM Tris-HCl pH 7.5 buffer were photobleached at different time-points post-mixing (less than 1 h or more than 3 h). Whole droplets as well as droplets subvolumes were photobleached. Images were acquired on a spinning disk microscope. For the plots on the right, FRAP data were background-corrected and normalized to the minimum and maximum intensity. The mean is shown with error bars representing the SD. Scale bars: 5 μm.
Fig 5
Fig 5. Phase separation of RABV P deletion mutants.
A) Schematic representation of the domain organization of RABV P deletion mutants used. The PΔNTD construct is deleted from amino acids 1–52. The PΔCTD construct is deleted from amino acids 195–296. B) SDS PAGE analysis of purified PΔCTD and PΔNTD. C) P deletion mutants droplets were observed by fluorescence microscopy at different concentrations in presence of 5% PEG 8000 in 125 mM NaCl, 20 mM Tris-HCl pH 7.5 buffer. The mix contained 25 nM of fluorescent P deletion mutant. Scale bar: 10 μm. D) Non-fluorescent P at 5 μM was incubated with either fluorescent PΔNTD or fluorescent PΔCTD constructs at 25 nM in presence of 5% PEG 8000 in 50 mM NaCl, 20 mM Tris-HCl pH 7.5 buffer. Presence of droplets was assessed by fluorescence microscopy. Scale bar: 10 μm.
Fig 6
Fig 6. Biologically relevant properties of RABV P droplets.
A) Segregation of RNA-Cy5 (10- or 40-A nucleotides) at the concentration of 100 nM into non-fluorescent P droplets (P at 5 μM in presence of 5% PEG 8000 in 125 mM NaCl, 20 mM Tris-HCl pH 7.5) and exclusion of BSA-FITC at the concentration of 250 μg/ml (3.8 μM) from P droplets. Fluorescent RNA and BSA were added when LLPS was induced. Analysis was performed by fluorescence microscopy. Exclusion of BSA-FITC from P droplets was validated by confocal microscopy (right panel). Scale bars: 10 μm. B) Droplets formed by non-fluorescent P at the concentration of 20 μM in the presence of 5% PEG 8000 and 100 nM Cy5-RNAs in 125 mM NaCl, 20 mM Tris-HCl pH 7.5 were photobleached at different time-points post-mixing (less than 1 h or more than 4 h). Whole droplets as well as droplets subvolumes were photobleached. Images were acquired on a spinning disk confocal microscope. Scale bars: 5 μm. For the plots on the right, FRAP data were corrected for background, normalized to the minimum and maximum intensity. The mean is shown with error bars representing the SD. C) P at 5 μM (25 nM of fluorescent P protein) in 50 mM NaCl, 20 mM Tris-HCl pH 7.5 was incubated with either 5% PEG 8000, or 80 ng/μL (6 μM) of synthetic 40-A nucleotides RNA, or 80 ng/μL of total RNAs extracted from BSR-T7/5 cells. Presence of droplets was assessed by fluorescence microscopy. Scale bar: 10 μm. D) Fluorescent liposomes (PE/PC/PS = 2/2/1 w/w, 100 μg/ml i.e. ~130 μM of lipids containing 0.25% of BODIPY 500/510 C12-HPC) were incubated or not with P at 20 μM concentration (50 nM of fluorescent P protein) in 5% PEG 8000, 125 mM NaCl, 20 mM Tris-HCl pH 7.5 before analysis by confocal microscopy. Scale bars: 10 μm.
Fig 7
Fig 7. Characterization of the behavior of RABV N in acellular minimal systems.
A) Schematic representation of the organization of RABV N and P constructs used. A StrepTagII was amino-terminally fused to the N protein to purify the N0-P complex from insect cells. Domains delimitations are indicated for both proteins. B) SDS PAGE analysis of N0-P complex. C) Purified N0-P complex labelled with NHS-Ester-Atto-488, was incubated at 2 μM concentration in 50 mM NaCl, 20 mM Tris-HCl pH 7.5 in absence or presence of 5% PEG 8000. Presence of N°-P droplets was assessed by fluorescence microscopy. Scale bar: 10 μm. D) Box plot representation of N°-P droplets aspect ratios (formed at 2 μM with 5% PEG 8000 as in C). Sample size: n = 1707. The cross on the boxplot indicates the mean. E) Fluorescent P (resp. fluorescent N0-P) at 25 nM was incubated with 1 μM N0-P (resp 5 μM P) in 50 mM NaCl, 20 mM Tris-HCl pH 7.5 and 5% PEG 8000. Presence of droplets was assessed by fluorescence microscopy. Scale bar: 10 μm. F) Whole droplets formed by N0-P complex at the concentration of 2 μM (25 nM of fluorescent complex) in the presence of 5% PEG 8000 in 50 mM NaCl and 20 mM Tris-HCl pH 7.5 were photobleached. Images were acquired on a spinning disk microscope. Scale bars: 5 μm. For the right plot, FRAP data were corrected for background, normalized to the minimum and maximum intensity. The mean is shown with error bars representing the SD. G) Top: Electron microscopy image of negatively stained viral nucleocapsids (Nuc), purified from RABV-infected BSR cells. Bottom: SDS PAGE analysis of purified nucleocapsids. H) Purified nucleocapsids (500 nM of N protein, 10% fluorescently-labelled), labelled with NHS-Ester-Atto-488 were incubated in absence or presence of increasing concentrations of P (125 mM NaCl, 20 mM Tris-HCl pH 7.5, 5% PEG 8000, 25 nM of fluorescent P). Nucleocapsids and P droplets were observed by fluorescence microscopy. Scale bar: 10 μm. I) Segregation of RNA-Cy5 (40-A nucleotides) at the concentration of 100 nM into non-fluorescent N0-P droplets (P at 2 μM in presence of 5% PEG 8000 in 125 mM NaCl, 20 mM Tris-HCl pH 7.5). Analysis was performed by fluorescence microscopy. Scale bars: 10 μm. J) N°-P droplets (2 μM concentration among which 25 nM of fluorescent complex, 5% PEG 8000, NaCl 50 mM, 20 mM Tris-HCl pH 7.5) in absence of RNA or incubated in presence of 40-A RNA added either 10 min before PEG-induced phase separation, or at the time of PEG 8000 addition, or 10 min after PEG-induced phase separation were observed by fluorescence microscopy. Images were acquired 20, 40, and 60 min after LLPS induction. Scale bars: 10 μm. K) Boxplot analysis of N0-P droplets aspect ratios in absence or presence of RNA added 10 min after LLPS. The time indicated on the left corresponds to the time elapsed since LLPS induction. From left to right, the sample size in each category is n = 536, n = 1065, n = 1087, n = 694, n = 962, n = 882. The cross on each boxplot indicates the mean. P-values were calculated using Kolmogorov-Smirnov test. ** p<2.10−4, *** p<10−6.

Similar articles

Cited by

References

    1. Hampson K, Coudeville L, Lembo T, Sambo M, Kieffer A, Attlan M, et al.. Estimating the global burden of endemic canine rabies. PLoS Negl Trop Dis. 2015;9(4):e0003709. doi: 10.1371/journal.pntd.0003709 - DOI - PMC - PubMed
    1. Albertini AA, Wernimont AK, Muziol T, Ravelli RB, Clapier CR, Schoehn G, et al.. Crystal structure of the rabies virus nucleoprotein-RNA complex. Science. 2006;313(5785):360–3. doi: 10.1126/science.1125280 - DOI - PubMed
    1. Albertini AA, Ruigrok RW, Blondel D. Rabies virus transcription and replication. Adv Virus Res. 2011;79:1–22. doi: 10.1016/B978-0-12-387040-7.00001-9 - DOI - PubMed
    1. Castel G, Chteoui M, Caignard G, Prehaud C, Mehouas S, Real E, et al.. Peptides that mimic the amino-terminal end of the rabies virus phosphoprotein have antiviral activity. J Virol. 2009;83(20):10808–20. doi: 10.1128/JVI.00977-09 - DOI - PMC - PubMed
    1. Mavrakis M, Mehouas S, Real E, Iseni F, Blondel D, Tordo N, et al.. Rabies virus chaperone: identification of the phosphoprotein peptide that keeps nucleoprotein soluble and free from non-specific RNA. Virology. 2006;349(2):422–9. doi: 10.1016/j.virol.2006.01.030 - DOI - PubMed

Publication types