. 2022 Dec 9;378(6624):1097-1104.
doi: 10.1126/science.abl5829. Epub 2022 Dec 8.

IFITM proteins assist cellular uptake of diverse linked chemotypes

Affiliations

IFITM proteins assist cellular uptake of diverse linked chemotypes

Kevin Lou et al. Science. .

Abstract

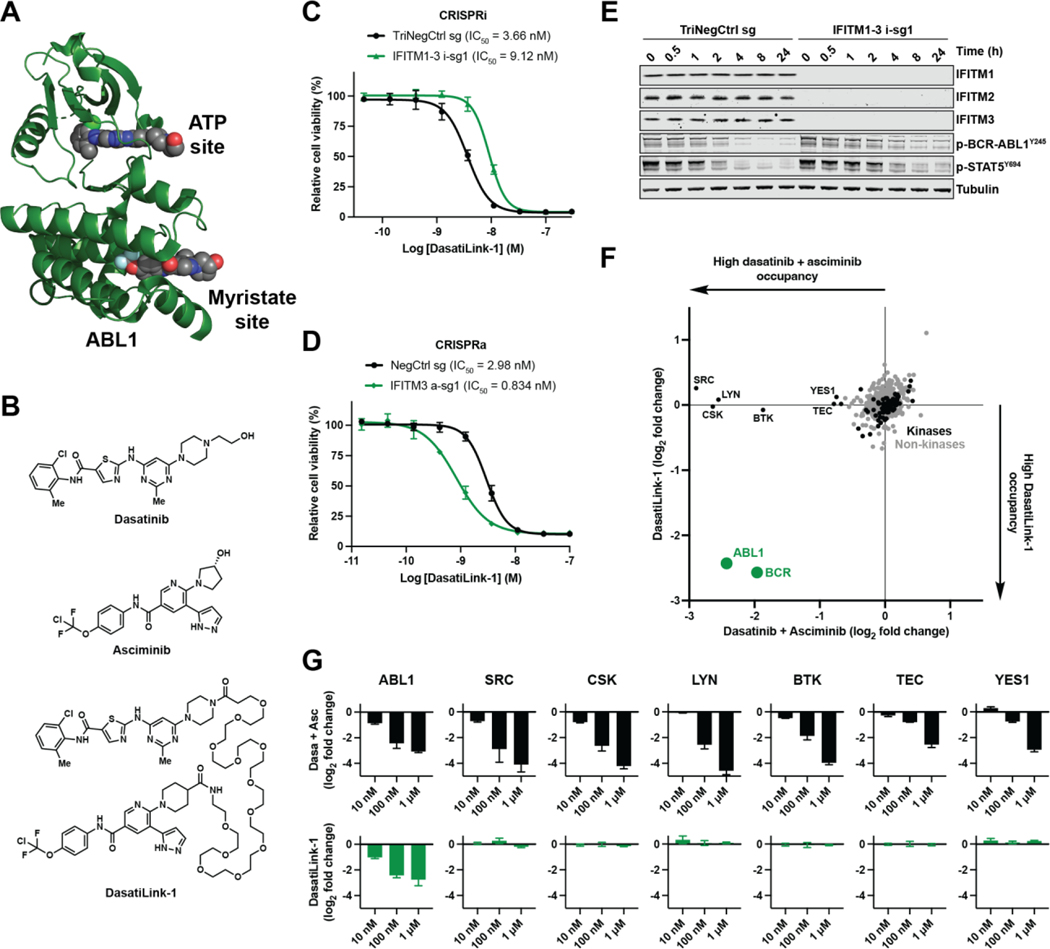
The search for cell-permeable drugs has conventionally focused on low-molecular weight (MW), nonpolar, rigid chemical structures. However, emerging therapeutic strategies break traditional drug design rules by employing flexibly linked chemical entities composed of more than one ligand. Using complementary genome-scale chemical-genetic approaches we identified an endogenous chemical uptake pathway involving interferon-induced transmembrane proteins (IFITMs) that modulates the cell permeability of a prototypical biopic inhibitor of MTOR (RapaLink-1, MW: 1784 g/mol). We devised additional linked inhibitors targeting BCR-ABL1 (DasatiLink-1, MW: 1518 g/mol) and EIF4A1 (BisRoc-1, MW: 1466 g/mol), uptake of which was facilitated by IFITMs. We also found that IFITMs moderately assisted some proteolysis-targeting chimeras and examined the physicochemical requirements for involvement of this uptake pathway.


Figures

Fig. 1.
Fig. 1.. IFITMs promote the cellular activity of a bitopic MTOR inhibitor.
(A) Chemical structures of MTOR inhibitors. (B) Gene phenotypes from genome-scale CRISPRi and CRISPRa screens in K562 cells. Genes involved in MTOR complex 1 (MTOR and RPTOR), a requisite rapamycin inhibitory complex partner (FKBP12), and clade I IFITMs (IFITM1, IFITM2, and IFITM3) are highlighted. Data represent two biological replicates. (C) Spearman correlation coefficients between RapaLink-1 sensitivity, as measured by dose-response data, and transcript abundance, as measured by RNA sequencing (see also fig. S4). Dose-response data are expressed as area under the curve (AUC) and RNA sequencing data are expressed as transcripts per million (TPM). Genes are highlighted as in (B). (D) Immunoblots of K562 CRISPRi cells expressing sgRNAs treated with RapaLink-1 (3 nM) for the times indicated. (E and F) Viability of K562 CRISPRi (E) or CRISPRa (F) cells expressing sgRNAs treated with RapaLink-1. Data represent means of three biological replicates; error bars denote SD.
Fig. 2.
Fig. 2.. IFITMs promote the cellular uptake of linked chemotypes.
(A) Chemical structures of fluorescent RapaLink-1 analogs. (B) Measurement of fluorescent molecule uptake in K562 CRISPRi cells expressing sgRNAs (sgRNA+). Cells were incubated with TAMRA-N3 (10 nM), TAMRA-PEG8-N3 (1 μM), or RapaTAMRA-PEG8 (1 nM) for 24 h. Uptake modulation by sgRNAs was quantified by internal normalization to non-transduced cells (sgRNA-) present within the mixture (i.e. relative cellular uptake). Data representative of three biological replicates. (C) Changes in uptake of fluorescent molecules by sgRNAs targeting IFITM1–3 as in (B and fig. S6A). Relative cellular uptake < 1 indicates decreased uptake and > 1 indicates increased uptake. Data represent means of three biological replicates. (D) Confocal microscopy images of RPE-1 CRISPRi cells expressing indicated sgRNAs (blue) and treated for 24 h with RapaTAMRA-PEG8 (magenta) and LysoTracker (green). sgRNA+ cells are traced with dotted outlines (yellow) in left two columns for clarity. Scale bar denotes 20 μm.
Fig. 3.
Fig. 3.. Design and characterization of an IFITM-assisted bitopic BCR-ABL1 inhibitor.
(A) Molecular model of ABL1 kinase domain. The model was constructed by aligning two crystal structures: one bound to dasatinib (PDB, 2GQG) and one bound to asciminib (PDB, 5MO4). (B) Chemical structures of BCR-ABL1 inhibitors. (C and D) Viability of K562 CRISPRi (C) or CRISPRa (D) cells expressing sgRNAs treated with DasatiLink-1. Data represent means of three biological replicates; error bars denote SD. (E) Immunoblots of K562 CRISPRi cells expressing sgRNAs treated with DasatiLink-1 (5 nM) for the times indicated (F) In-cell kinase occupancy profiling of DasatiLink-1 and an unlinked control (a 1:1 mixture of dasatinib and asciminib) at equimolar concentration (100 nM). Data represent means of three biological replicates. (G) As in (F) for kinases occupied following 10 nM, 100 nM, and 1 μM inhibitor treatments; error bars denote SD.
Fig. 4.
Fig. 4.. IFITMs assist the cellular activity of diverse linked chemotypes.
(A) Heavy atom skeletons of compounds assessed for IFITM assistance (see also fig. S10 for chemical structures). Compounds were categorized as non-linked chemotypes (compounds 1–8, black), linked chemotypes with short linkers (compounds 9–14, gray), or linked chemotypes with long linkers (compounds 15–17, green). (B) Chemical-genetic interaction map of inhibitors in (A) with IFITM1, IFTM2, and IFITM3. Potency, as measured by dose-response IC50 in a cell viability assay (see also Fig. 1F, Fig. 3D, or fig. S9D for example source data), was normalized to that of non-sgRNA-expressing K562 CRISPRi or CRISPRa cells. Physicochemical properties, including molecular weight (MW) and number of rotatable bonds, with their respective traditional thresholds for drug-likeness are indicated (right). Data represent means of three biological replicates. (C) Map of chemical space populated by 304 kinase inhibitors in clinical development (black), 3270 PROTACs reported in the literature (gray), and 3 linked chemotypes described herein (green). Boundaries represent traditional guidelines for drug-likeness.

Comment in

References

    1. Lipinski CA, Lombardo F, Dominy BW, Feeney PJ, Experimental and computational approaches to estimate solubility and permeability in drug discovery and development settings. Adv Drug Deliver Rev. 23, 3–25 (1997). - PubMed
    1. Veber DF, Johnson SR, Cheng H-Y, Smith BR, Ward KW, Kopple KD, Molecular Properties That Influence the Oral Bioavailability of Drug Candidates. J Med Chem. 45, 2615–2623 (2002). - PubMed
    1. Ghose AK, Viswanadhan VN, Wendoloski JJ, A Knowledge-Based Approach in Designing Combinatorial or Medicinal Chemistry Libraries for Drug Discovery. 1. A Qualitative and Quantitative Characterization of Known Drug Databases. J Comb Chem. 1, 55–68 (1999). - PubMed
    1. Erez M, Takemori AE, Portoghese PS, Narcotic antagonistic potency of bivalent ligands which contain .beta.-naltrexamine. Evidence for simultaneous occupation of proximal recognition sites. J Med Chem. 25, 847–849 (1982). - PubMed
    1. Spencer D, Wandless T, Schreiber S, Crabtree G, Controlling signal transduction with synthetic ligands. Science. 262, 1019–1024 (1993). - PubMed