. 2022 Dec 9;378(6624):eabk2066.
doi: 10.1126/science.abk2066. Epub 2022 Dec 9.

Principles of gene regulation quantitatively connect DNA to RNA and proteins in bacteria

Affiliations

Principles of gene regulation quantitatively connect DNA to RNA and proteins in bacteria

Rohan Balakrishnan et al. Science. .

Abstract

Protein concentrations are set by a complex interplay between gene-specific regulatory processes and systemic factors, including cell volume and shared gene expression machineries. Elucidating this interplay is crucial for discerning and designing gene regulatory systems. We quantitatively characterized gene-specific and systemic factors that affect transcription and translation genome-wide for Escherichia coli across many conditions. The results revealed two design principles that make regulation of gene expression insulated from concentrations of shared machineries: RNA polymerase activity is fine-tuned to match translational output, and translational characteristics are similar across most messenger RNAs (mRNAs). Consequently, in bacteria, protein concentration is set primarily at the promoter level. A simple mathematical formula relates promoter activities and protein concentrations across growth conditions, enabling quantitative inference of gene regulation from omics data.


Conflict of interest statement

COMPETING INTERESTS

The authors declare no competing interests.

Figures

Figure 1.
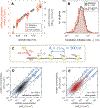
Figure 1.. Genome-wide mRNA and protein comparison.
(A) Schematic illustration of the basic processes determining mRNA and protein concentrations in exponentially growing bacteria. The rate of each process can potentially vary across both genes and conditions; the symbols used throughout the study are described alongside the respective cellular processes (see also Fig. S1). (B) For E. coli K-12 strain NCM3722 growing exponentially in glucose minimal medium (reference condition, growth rate 0.91/h), the fractional number abundances of proteins (ψp,i, obtained from DIA/SWATH mass spectrometry(10) and of mRNAs (ψm,i, obtained from RNA-sequencing; see Methods) for each gene i are shown as scatter plot (number of genes and Pearson correlation coefficient in figure). The red line represents the diagonal, ψp,i=ψm,i. (C) The ratios of protein and mRNA fractions, ψp,i/ψm,i, are distributed around 1 for exponentially growing cultures under all growth conditions studied (Fig. S3E–S). These include the reference condition (black), as well as conditions of reduced growth, achieved by limiting carbon catabolism (red), anabolism (blue), or inhibiting translation (green); see SI Methods. Boxes and the whiskers represent 50% and 90% of the genes, respectively; x-axis values give the corresponding growth rates. See Tables S1 and S2 for list of strains and conditions in this study, and Table S3–4 for transcriptomics and proteomics data. (D) Distributions of the ratios ψp,i/ψm,i obtained in reference condition and the slowest-growing of each of the three types of limitations; same color code as (C). The same plots also give the distributions of the relative translational initiation rate, αp,i/α¯p; see text. (E) The fold-changes in protein and mRNA fractions for each gene i between the reference condition and the slowest growth condition, FC(ψp,i) and FC(ψm,i), were computed as described in Fig. S4 for each one of the three growth limitations; the distribution of their ratio FC(ψp,i)/FC(ψm,i) is shown using the same color code as (C). The histograms are narrowly distributed around 1, with more than half of the genes within 35% from the median. See Table S5 for the fold changes in translation efficiency for each gene.
Figure 2.
Figure 2.. Coordination of mRNA and ribosome abundances.
(A) Left axis (red symbols): total concentration of mRNA is plotted against the growth rate. Total mRNA abundance and associated standard deviations based on 3 measurements obtained as described in Fig. S5 and Methods. The measurements were performed for a range of growth conditions, including reference, glucose uptake titration (Pu-ptsG, see Table S1) and a host of poor carbon sources. Right axis (grey symbols): concentration of active ribosomes in nutrient-limited conditions, converted from the data in Ref.(7) (reported per culture volume) using the total cellular volume shown in Fig. S2C–E. (B) Translation initiation rates, αp,i=α¯p·(ψp,i/ψm,i), in reference (black) and carbon-limited (red) growth. (C) The spacing between consecutive translating ribosomes on an mRNA is given by the ratio between the ribosome elongation rate (similar across mRNAs, Fig. S6 and Ref.(7)) and the translation initiation rate αp,i, which is also narrowly distributed (see panel B). Our data give an average ribosome spacing of d ≈ 200 nt; see Fig. S6D. (D) Absolute mRNA and protein concentration for each gene in reference condition, computed by combining the fractional abundances ψm,i and ψp,i with total mRNA abundances (panel A), total protein abundances and cell volume (see Fig. S2 and Note S1). Blue lines indicate the corresponding values of inter-ribosome spacing d, calculated from the known elongation rates (~15.3 aa/s). (E) Same as panel (D), but for slow growth in the most C-limiting condition (growth rate ~ 0.35/h, elongation rate ~12.4 aa/s (7)).
Figure 3.
Figure 3.. mRNA degradation and synthesis.
(A-C) Degradation of mRNA transcribed from the long nuo operon (A) in reference condition (B) and carbon-limited condition (C). The abundance of mRNA was measured by RNA-seq over the course of 11 minutes following the blockage of transcription initiation by rifampicin (SI Methods, Fig. S7). While the abundance of the mRNA of genes proximal to the promoter (nuoA, orange) drops immediately after rifampicin treatment (at time t = 0), a lag is observed for genes progressively more distant from the promoter (from orange to blue). The lag time corresponds to the time elapsed between the transcription of the proximal and distant genes by RNAPs which initiated transcription before the application of rifampicin (Fig. S7D). (D) Histogram of fold-change of the mRNA degradation rates, FC(δi), between carbon limited medium and reference condition for N = 2550 genes. Half of the fold changes are within 25% from unity, and 90% of the fold changes are in the range 0.50 to 1.57, implying that the degradation rates for most mRNAs do not change significantly between the reference and carbon-limited growth conditions. (E) Distribution of the mRNA degradation fluxes, δi[mRi], computed from the mRNA concentration and degradation rates. These quantities should equate the mRNA synthesis fluxes, αm,i[Gi], in steady state conditions. Dashed lines indicate the median fluxes, 0.194/μm3/min in reference condition and 0.108/μm3/min at slow growth. (F) Left axis (red symbols): total mRNA synthesis flux JmR = ∑i αm,i [Gi] (transcripts synthesized per cell volume per unit time), for a variety of growth conditions as indicated (see Table S2 for growth conditions). The slope of radiolabel incorporated into mRNA over time was used to obtain the mRNA synthesis flux while the error bars represent the standard deviation from 6 measurements at different time-points following the label addition (Fig. S10). The orange crosses indicate the total mRNA synthesis flux obtained from summing δi · [mRi] using the data in (E). Right axis (black symbols): absolute mRNA abundances (same data as Fig. 2A). (G) Left axis (red symbols): total RNA synthesis flux vs. growth rate (same data as in panel (F)). Right axis (grey symbols): concentration of active ribosomes (same data as Fig. 2A).
Figure 4.
Figure 4.. Quantitative relations between promoter on-rates and mRNA, protein abundances.
(A) Growth rate dependence of gene concentration [Gi] at various distances x from the origin of replication Ori (solid lines). These are computed as the product of the Ori concentration [Ori] (orange circles, shown in Fig. S9C with raw data and standard errors from Ref.(24)) and the gene dose gi = [Gi]/[Ori] (Fig. S9B); see Fig. S9 for details. (B) Distribution of transcription initiation rates αm,i in reference condition (black) and slow growth (red), computed using the available mRNA abundances and degradation rates (see SI Note S3 for details). Dashed lines indicate the median initiation rates in the two conditions (2.64/min for reference condition, 0.87/min for slow growth). (C) Fold change of the transcription initiation rates FC(αm,i) between reference condition and slow growth. The data shows a generalized decrease of initiation rates, with a median reduction of 0.29 (dashed line) at slow growth (λ = 0.3/h) compared to the reference condition (λ = 0.91/h). (D) Illustration of a canonical model of transcriptional regulation(28, 29), with the transcription initiation rate for gene i, αm,i, depending on the promoter on-rate ki, which is modulated by transcription factors (TF1, TF2, …), as well as on the cellular concentration of available RNA polymerases ([RNAP]av), as described by Eq. (8). (E) Cartoon illustrating the dependence of mRNA and protein abundances on the promoter on-rates, as described by Eq. (12). Consider two genes with promoter on-rates k1 (orange) and k2 (blue) and identical gene concentration [G1] = [G2] ≡ [G]; the corresponding mRNA and protein fractions (ψm,1 = ψp,1ψ1 and ψm,2 = ψp,2ψ2, respectively) depend on both promoter on-rates via the total regulatory activity 𝒦=(k1+k2)[G] (in red). Three possible scenarios are illustrated. Top: If k2 increases, while k1 remains constant, then 𝒦 increases, resulting in the reduction of protein and mRNA abundances for the orange gene despite it not being downregulated at the transcriptional level. Bottom: If only k1 decreases while k2 remains constant (bottom), then the proteins and mRNAs for the blue gene increase despite the lack of change at its promoter level. Middle: If 𝒦 is unchanged (due to compensating changes in k1 and k2 in this case), then the changes in protein and mRNA fractions would reflect changes at the regulatory level. (F) E. coli strains harboring constitutive expression of lacZ at various locations near oriC (orange) and near terC (blue; loci listed in the legend) were grown in carbon-limited conditions (see Tables S1–S2 for strains and conditions). LacZ protein abundance per culture volume (OD·mL), obtained from the slopes of β-gal activity versus OD600 (Miller units), is shown; error bars indicate standard errors from 4 measurements (Methods). (G) The relative change in the total regulatory activity 𝒦 across growth rates was estimated from the relative change in LacZ abundance using the data in panel (F) and Eq. (14) in the text. To do so, the LacZ abundance per culture volume was converted to protein fraction by dividing by total protein mass per culture volume (Fig. S2F). The result shows a linear dependence of the total regulatory activity on the growth rate (red line). The absolute scale 𝒦 was set for the reference condition using Eq. (10) with the values for the total mRNA synthesis flux JmR. obtained from Fig. 3F, the oriC concentration from Fig. 4A, and the available RNAP concentration estimated as described in SI Note S5.
Figure 5.
Figure 5.. Gene expression is primarily determined by the promoter on-rates.
(A) Distribution of promoter on-rates ki in the reference and slow growth condition, obtained from the distribution of the translation initiation rate and the concentrations of available RNAP, ki = αm,i/[RNAP]av (see Eq. (8)), as described in SI Note S4. The median promoter-on rate (vertical dashed lines) shifts from 1.63 · 10−4 μm3 in reference condition (λ ~ 0.9/h) to 1.07 · 10−4 μm3/min in slow growth (λ ~ 0.3/h). This change is much less than the ~3-fold change in both the growth rate and the median transcription initiation rates (Fig. 4BC). (B) For 71 operons containing at least 3 genes as annotated in Ecocyc(53), we computed the coefficient of variation (CV) in the promoter on-rates ki or in the protein concentrations [Pi] for genes within each operon in reference condition. The average intra-operon CVs for the promoter on-rates are significantly smaller than that computed for the protein concentrations [Pi] (p< 7 · 10−7, unpaired t-test); see also Fig. S10A. As a control, we randomly shuffled the genes across the operons 50 times, leading to sets of 3550 CVs (grey-filled boxes), and considered the CVs computed using all available genes (lines on the right). The CV for the promoter on-rates are also significantly smaller than all the other distributions (p < 3 · 10−35 when comparing to the randomized cases) and the genome-wide CVs. Boxes and whiskers indicate 50% and 90% intervals, respectively; median CVs are indicated by the central lines within the boxes. (C) Promoter on-rates ki, translation initiation rates αp,i, mRNA degradation rates δi and gene concentrations [Gi] are the four molecular parameters determining cellular concentration of a protein in a given growth condition (Fig. 1A, with the transcription initiation rate αm,i given by ki via Eq. (8)). These four molecular parameters are plotted against the protein concentrations [Pi] in reference condition, binned according to the observed protein concentrations. Boxes and whiskers indicate 50% and 90% central intervals for the binned data; the solid lines represent moving averages. (D) Same as panel (C), but for the fold changes (FC) of each quantity across growth conditions (slow growth compared to reference). All molecular parameters and concentrations shown in panels A-D are listed in Table S6. (E) The sum of promoter on-rates weighted by gene dose, 𝒦=ikigi (red line; same as in Fig. 4G) is partitioned between the contribution from ribosomal proteins and translation elongation factors (green) and the rest of genes (grey area). Symbols indicate the partitioning obtained from the computed ki across growth rates. The growth rate dependence of 𝒦 largely stems from that of the promoter on-rates of the translational genes. (F) Growth rate dependence of promoter on-rates summed over different groups of genes: ribosomal proteins, elongation factors (encoded by fusA, tufAB and tsf), and the rRNA operons. The activity of the rRNA operons was estimated from the synthesis flux of stable RNA (SI Methods and Fig. S14).
Figure 6.
Figure 6.. The role of the anti-sigma factor Rsd in global regulation of mRNA synthesis.
(A) Value of 𝒦·[Ori] across growth rates, obtained from the values (data and standard errors) of the total regulatory activity 𝒦 shown in Fig. 4G, multiplied by the interpolated values for [Ori] at the same growth rates (Fig. 4A). For comparison, the dashed line shows direct proportionality to the growth rate. (B) Concentration of available RNA polymerases (red symbols, left axis), estimated from the ratio between the measured mRNA synthesis flux (data and errors in Fig. 3G) and 𝒦·[Ori] (using the interpolated curves in Fig. 4A and 4G). Note that this quantity shows a stronger dependence on the growth rate compared to 𝒦·[Ori] in panel (A) and has the same growth-rate dependence as the concentration of active ribosomes (grey symbols, right axis). (C) The concentrations of various components of the transcription machinery in carbon-limited conditions is plotted against the growth rate. Components of the core enzyme, RpoABC, and the major sigma factor σ70 are shown as squares. Known modulators of σ70, Rsd and 6S RNA are shown as triangles. The protein concentrations are determined from mass spectrometry(10), while the concentration of 6S RNA is determined from RNA-sequencing and the concentration of total mRNA concentration (Fig. S4). (D) Cartoon illustrating the control of RNA polymerase (RNAP) availability through the known σ70-sequestration function of Rsd(33, 54). (E) Comparison of mRNA synthesis fluxes between wild type (open symbols) and Δrsd strain (filled symbols). Left axis: total mRNA synthesis flux of Δrsd strain (red filled circles) and wild type (red open circles); standard errors are computed as in Fig. 3F. Right axis: concentration of active ribosomes computed from the measured total RNA for the two strains and the fraction of active ribosomes observed in carbon limited growth(7). (F) The growth defect of Δrsd strain, defined as % reduction in growth rate compared to wild type cells in the same growth condition (black circles, left axis), is plotted against the growth rate of wild type cells for the range of carbon-limited growth conditions. The observed growth reduction matches Rsd expression of wild type cells in the same conditions (red triangles, right axis; same data as in panel C).

References

    1. Goldberg AL, St John AC, Intracellular protein degradation in mammalian and bacterial cells: Part 2. Annu. Rev. Biochem. 45, 747–803 (1976). - PubMed
    1. Nath K, Koch AL, Protein degradation in Escherichia coli. II. Strain differences in the degradation of protein and nucleic acid resulting from starvation. J. Biol. Chem. 246, 6956–6967 (1971). - PubMed
    1. Paulsson J, Models of stochastic gene expression. Phys. Life Rev. 2, 157–175 (2005).
    1. Klumpp S, Zhang Z, Hwa T, Growth Rate-Dependent Global Effects on Gene Expression in Bacteria. Cell. 139, 1366–1375 (2009). - PMC - PubMed
    1. Lin J, Amir A, Homeostasis of protein and mRNA concentrations in growing cells. Nat. Commun. 9 (2018), doi:10.1038/s41467-018-06714-z. - DOI - PMC - PubMed

MeSH terms