. 2023 Jan 1;61(1):49-62.
doi: 10.1097/AIA.0000000000000389. Epub 2022 Dec 8.

Geospatial analysis of patients' social determinants of health for health systems science and disparity research

Affiliations

Geospatial analysis of patients' social determinants of health for health systems science and disparity research

John Pearson et al. Int Anesthesiol Clin. .

Abstract

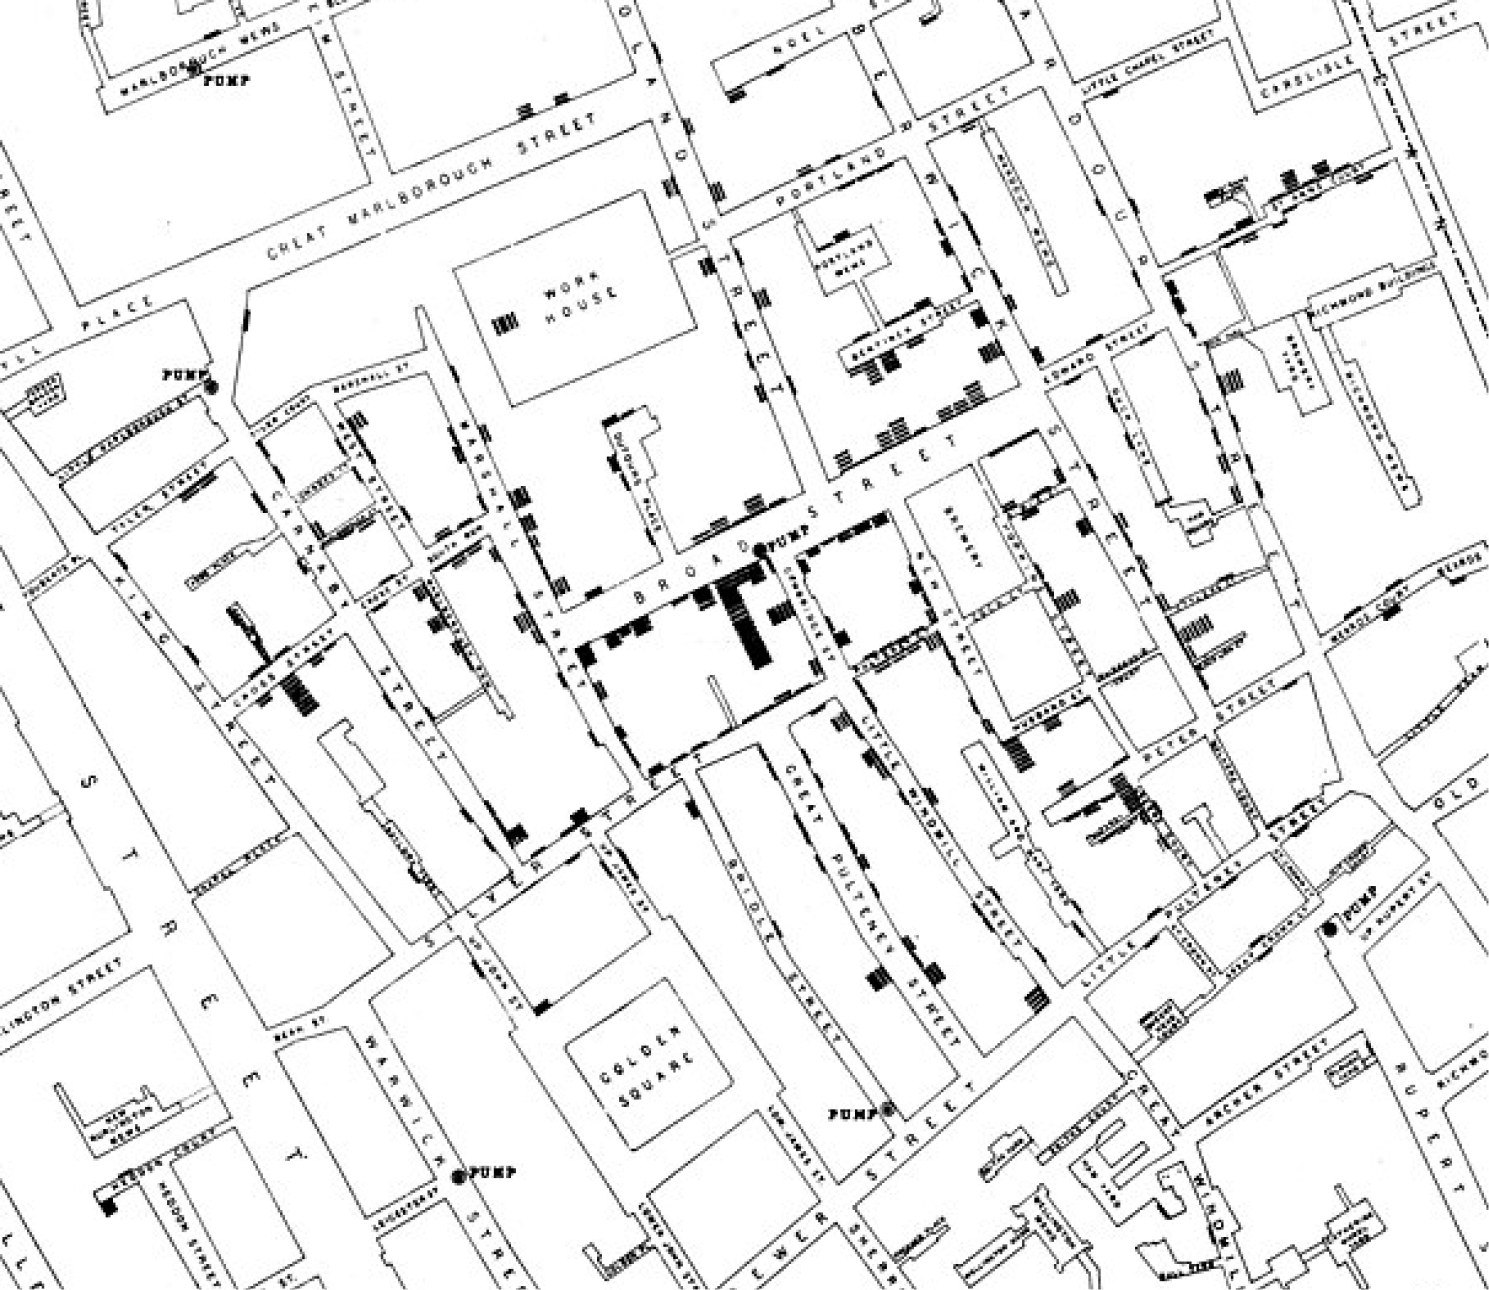
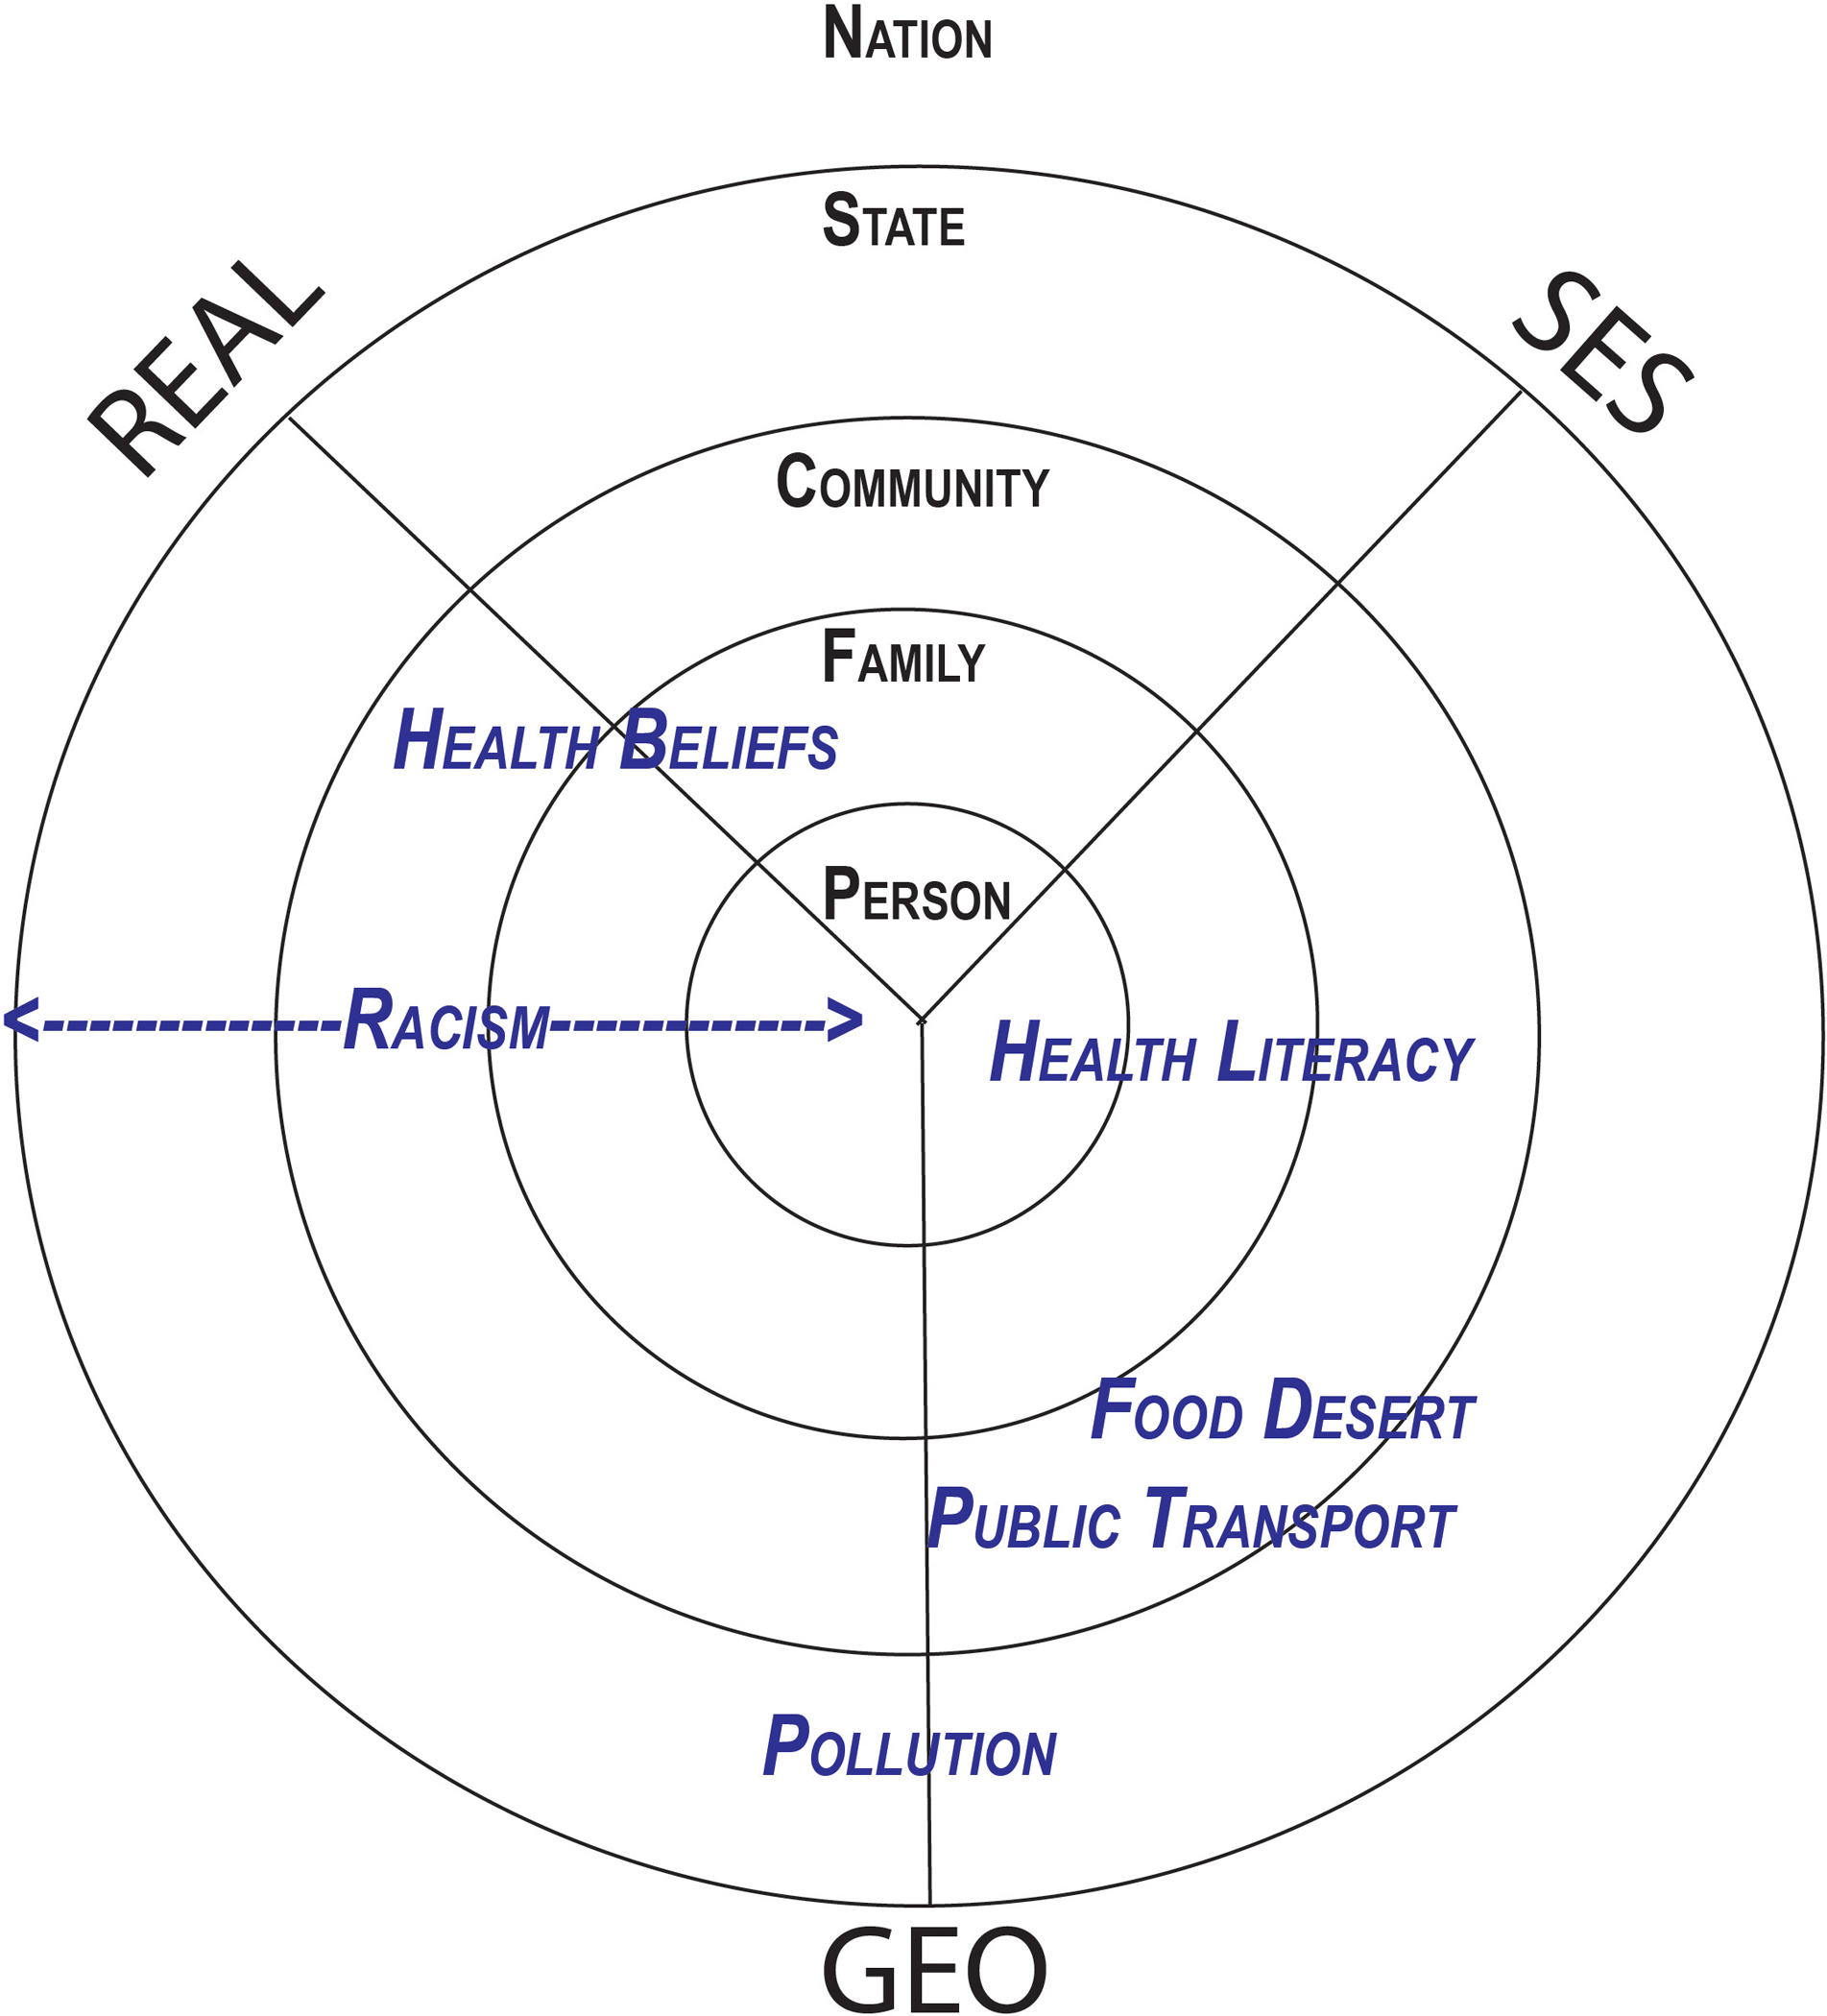
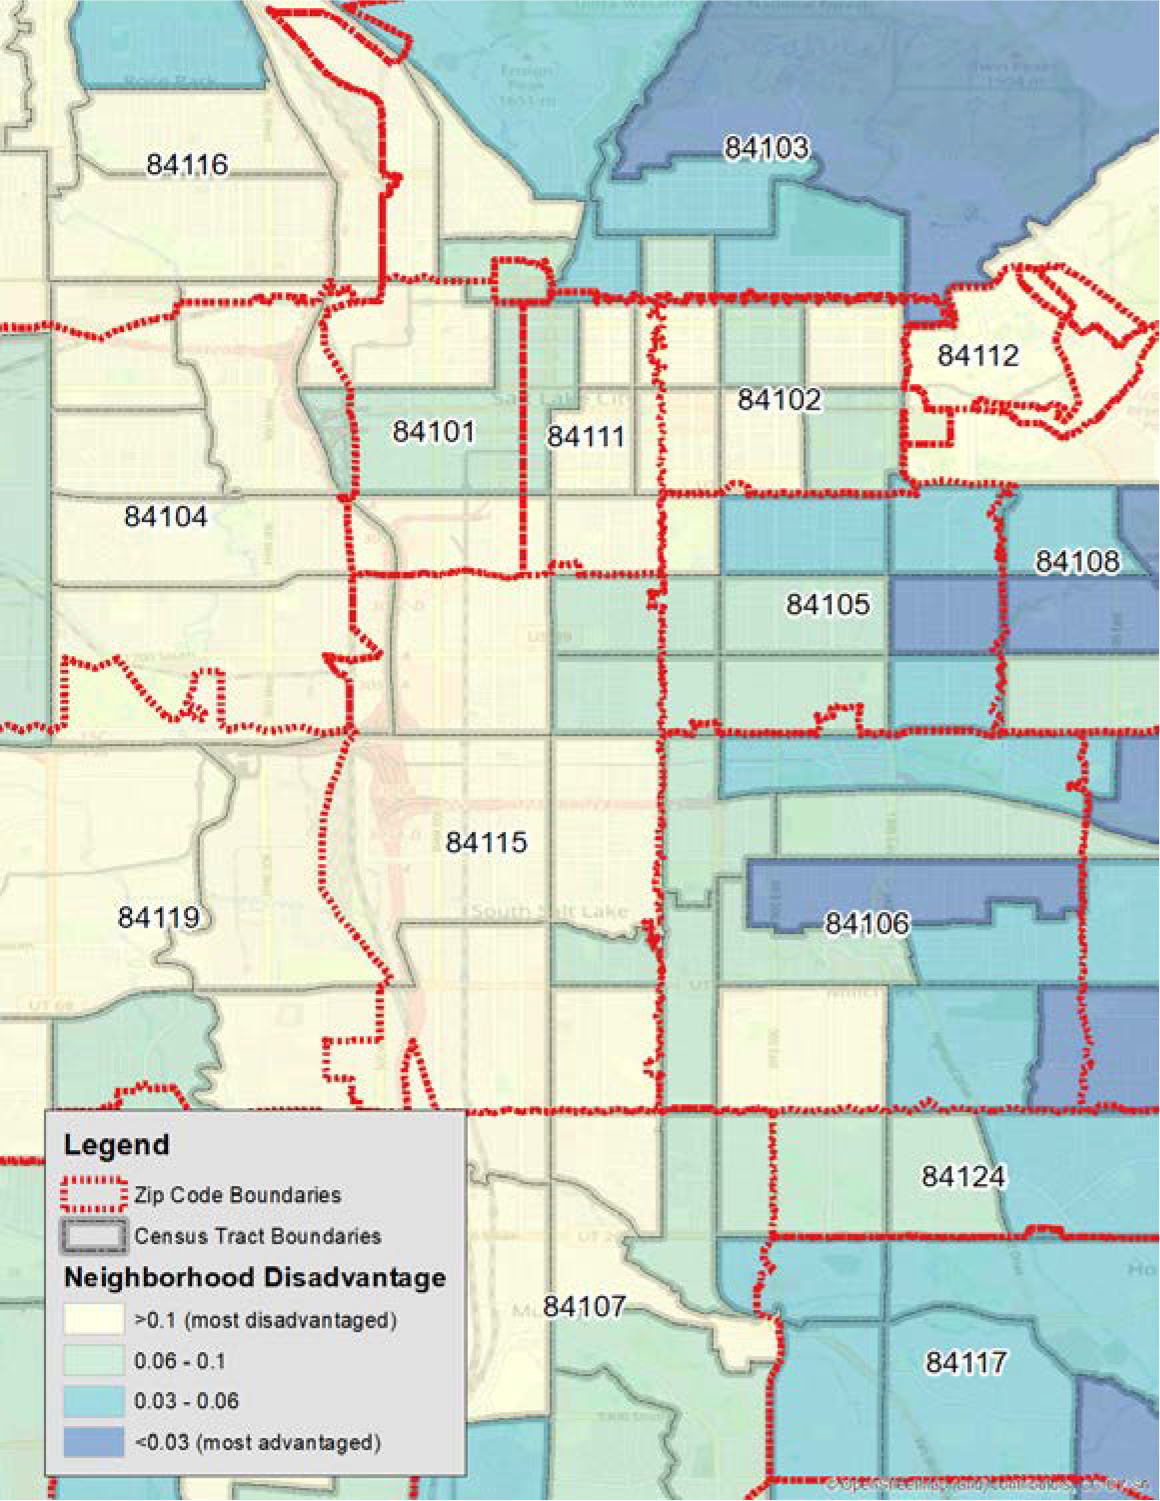
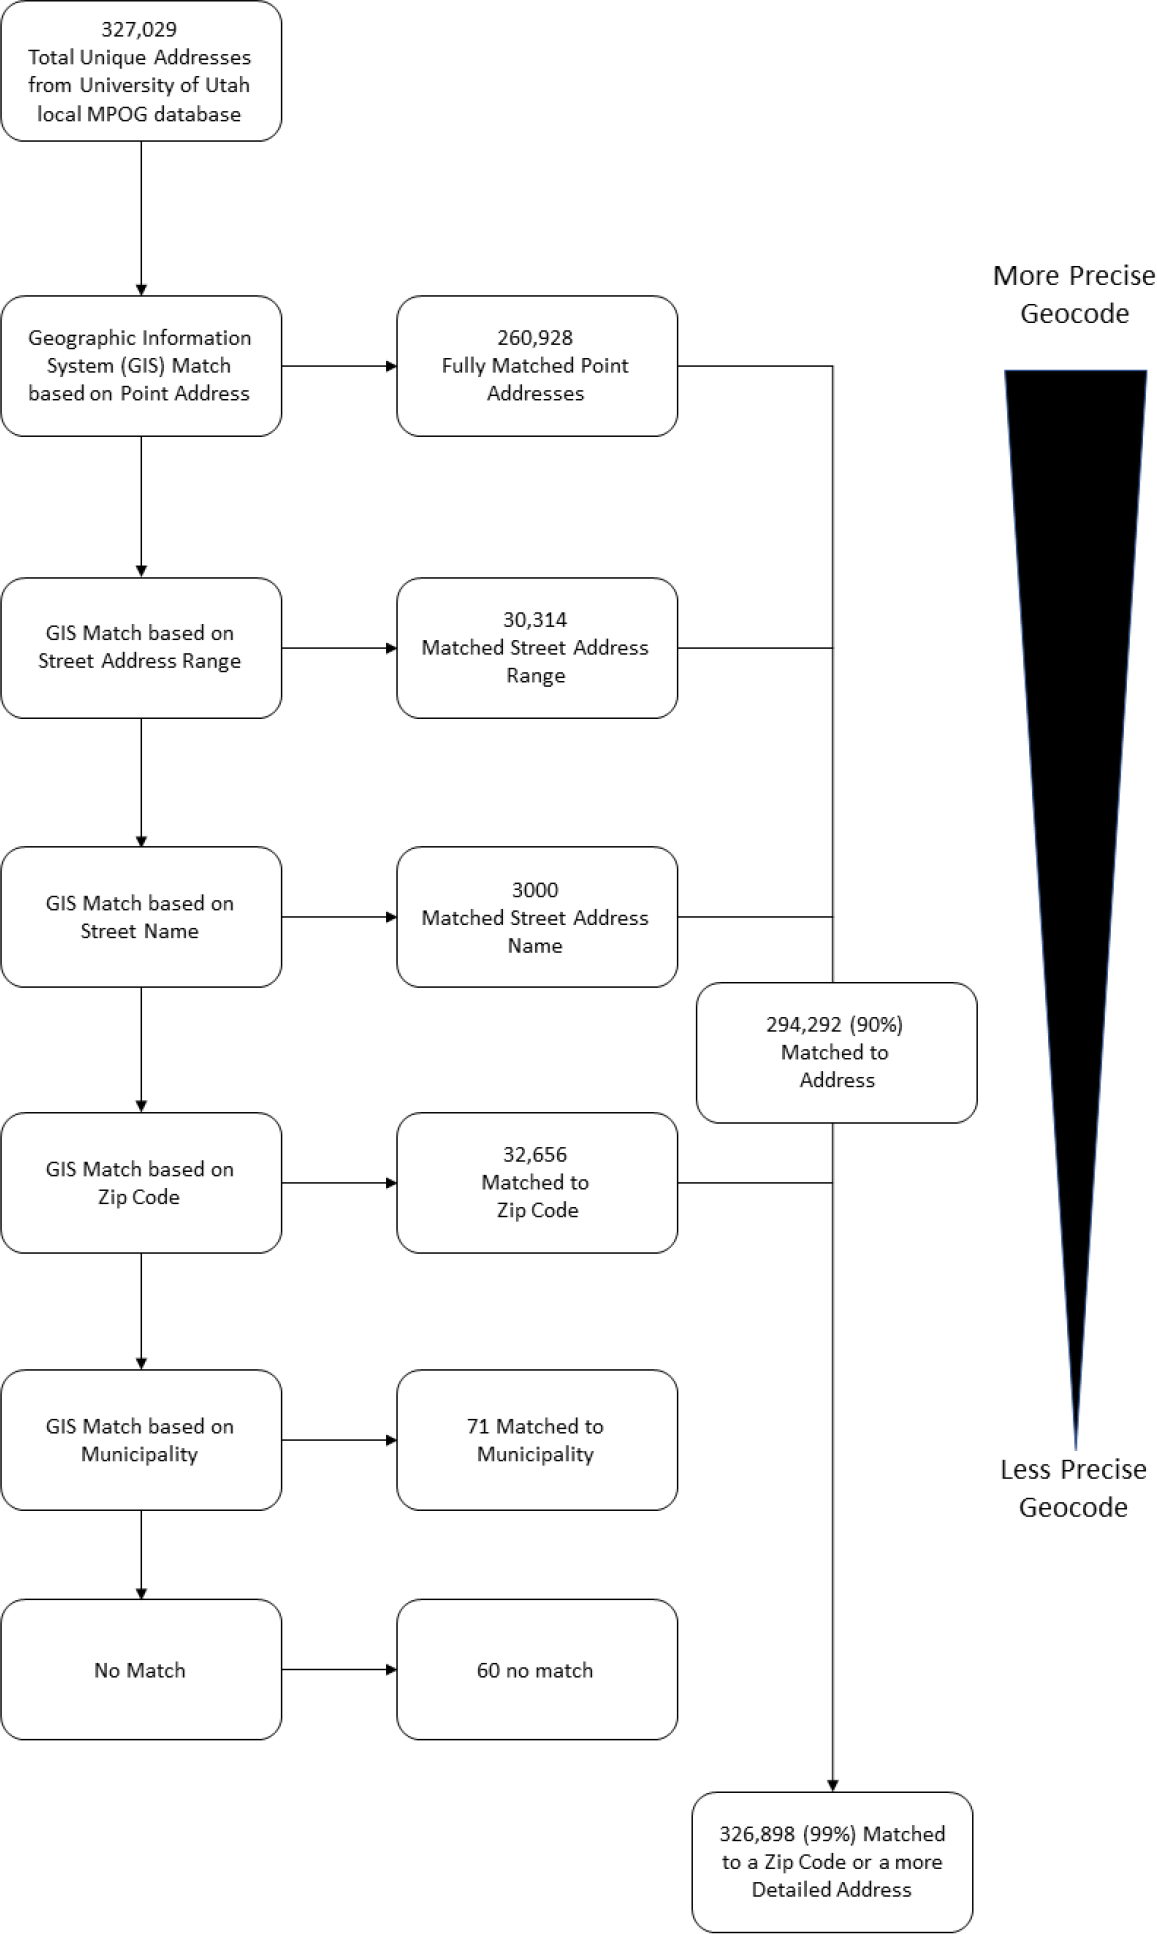
Social context matters for health, healthcare processes/quality and patient outcomes. The social status and circumstances we are born into, grow up in and live under, are called social determinants of health; they drive our health, and how we access and experience care; they are the fundamental causes of disease outcomes. Such circumstances are influenced heavily by our location through neighborhood context, which relates to support networks. Geography can influence proximity to resources and is an important dimension of social determinants of health, which also encompass race/ethnicity, language, health literacy, gender identity, social capital, wealth and income. Beginning with an explanation of social determinants, we explore the use of Geospatial Analysis methods and geocoding, including the importance of collaborating with geography experts, the pitfalls of geocoding, and how geographic analysis can help us to understand patient populations within the context of Social Determinants of Health. We then explain mechanisms and methods of geospatial analysis with two examples: (1) Bayesian hierarchical regression with crossed random effects and (2) discontinuity regression i.e., change point analysis. We leveraged the local University of Utah and Yale cohorts of the Multicenter Perioperative Outcomes Group (MPOG.org), a perioperative electronic health registry; we enriched the Utah cohort with US-census tract level social determinants of health after geocoding patient addresses and extracting social determinants of health from the National Neighborhood Database (NaNDA). We explain how to investigate the impact of US-census tract level community deprivation indices and racial/ethnic composition on (1) individual clinicians’ administration of risk-adjusted perioperative antiemetic prophylaxis, (2) patients’ decisions to defer cataract surgery at the cusp of Medicare eligibility and finally (3) methods to further characterize patient populations at risk through publicly available datasets in the context of public transit access. Our examples are not rigorous analyses, and our preliminary inferences should not be taken at face value, but rather seen as illustration of geospatial analysis processes and methods. Our worked examples show the potential utility of geospatial analysis, and in particular the power of geocoding patient addresses to extract US-census level social determinants of health from publicly available databases to enrich electronic health registries for healthcare disparity research and targeted health system level countermeasures.


Conflict of interest statement

Conflict of interests

Dr. Schonberger reports owning stock in Johnson & Johnson unrelated to the present work. Dr. Schonberger reports that his organization receives funding from Merck, Inc. for a study in which he is co-investigator unrelated to the present work. Dr. Andreae is part of a study funded by Merck unrelated to the present work. No other author has any conflicts to declare.

Figures

Figure 1:
Figure 1:
John Snow Map on mode of communication of cholera This figure is taken from the map of the book “On the Mode of Communication of Cholera” by John Snow, published in 1854 C.F. Cheffins, Lith, Southampton. Use is in public domain. This is the first example in the literature of a dot map used to display density of cases in a geographic context and is a foundational map of medical geography and epidemiology.
Figure 2:
Figure 2:
Polar dimensions of social determinants of health We organize social determinants of health (SDOH) in this figure by spatial level and in three axis. SDOH concern (1) identity: REAL (Race, Ethnicity, Affinity and Language), (2) socioeconomic status: SES (income, social capital, health literacy, etc.), and (2) the geographic domain: GEO (geographic factors, e.g., food desert, availability of public transport, spatial accessibility of medical services). SDOH can act at different spatial levels, pertaining to the individual, their family, community, neighborhood, county, state, and nation. Individual mechanisms can be placed in a polar diagram to illustrate intersectionality and interaction between mechanisms leading to perioperative process and outcome disparities. Pollution is an example for a geographic SDOH acting at the state or community level. The impact of health literacy (SES factor) may span the personal, family and community level. Racism (REAL factor) may act at different spatial scales by different mechanisms: interpersonal racism drives disparities at the person-level, e.g., when a clinician neglects a Black patient; structural racism may act at the state or community level, e.g., through apartheid. Food desert or poor Public Transport are SDOH somewhere between the GEO and SES axis, acting more at the community than the personal level.
Figure 3:
Figure 3:
Comparison of Zip Code and Census tract boundaries This figure overlays Zip Code Tabulation Area (ZCTA) boundaries on top of Census Tract boundaries. Underlying this is Neighborhood Socioeconomic Disadvantage (NSD) which is detailed later in the text, showing red as most disadvantaged and blue as least disadvantaged. Note the different boundaries, as the ZCTA aggregates and, had that been used as the geography boundary, would have obscured heterogeneity that is evident in the Census Tracts. At the top of the figure, Zip Code 84103 is an example of this, with areas of high social disadvantage mixed together with areas of very low (blue) disadvantage within the same Zip Code.
Figure 4:
Figure 4:
Overview of geocoding workflow with example data from the University of Utah local MPOG database Data taken from University of Utah cohort detailing number of matches by level of geography. The data is taken from the local MPOG database at the University of Utah. As noted, approximately 90% of matches were at the street address level, meaning the geographic information system(GIS) was able to take a text address from the database and find the same address in the geospatial database with a corresponding latitude and longitude. Additionally, 9.9% were matches based on Zip Code alone, meaning they were matched to the center of the Zip Code in the GIS which is considered less accurate than based on a street address. A small proportion, less than 1%, were unable to be matched.
Figure 5:
Figure 5:
Neighborhood disadvantage and access to public transport The hatched area represents a less than 15-minute walking distance to frequent transit lines, which is overlayed on the NSD score. Notably, the use of transit frequency is better able to elucidate neighborhood stress and obstacles to care compared with a raw count of transit stops available. Gaps in coverage can be seen on the western side of Salt Lake County as well as central areas bordering highways.

References

    1. Holzman RS. John Snow: Anesthesiologist, Epidemiologist, Scientist, and Hero. Anesth Analg. 2021;133(6):1642–50. doi: 10.1213/ANE.0000000000005586. - DOI - PubMed
    1. Gavrilova ML. Generalized Voronoi diagram : a geometry-based approach to computational intelligence. Berlin; London: Springer; 2008. xxi, 312 p. p.
    1. McLeod KS. Our sense of Snow: the myth of John Snow in medical geography. Soc Sci Med. 2000;50(7–8):923–35. doi: 10.1016/s0277-9536(99)00345-7. - DOI - PubMed
    1. Walford NS. Demographic and social context of deaths during the 1854 cholera outbreak in Soho, London: a reappraisal of Dr John Snow’s investigation. Health Place. 2020;65:102402. Epub 20200818. doi: 10.1016/j.healthplace.2020.102402. - DOI - PMC - PubMed
    1. Miller CE, Vasan RS. The southern rural health and mortality penalty: A review of regional health inequities in the United States. Soc Sci Med. 2021;268:113443. Epub 20201023. doi: 10.1016/j.socscimed.2020.113443. - DOI - PMC - PubMed

Publication types