. 2023 Feb;53(2):e2250190.
doi: 10.1002/eji.202250190. Epub 2022 Dec 25.

Clonal composition and persistence of antigen-specific circulating T follicular helper cells

Affiliations

Clonal composition and persistence of antigen-specific circulating T follicular helper cells

Mengyun Hu et al. Eur J Immunol. 2023 Feb.

Abstract

T follicular helper (TFH ) cells play an essential role in promoting B cell responses and antibody affinity maturation in germinal centers (GC). A subset of memory CD4+ T cells expressing the chemokine receptor CXCR5 has been described in human blood as phenotypically and clonally related to GC TFH cells. However, the antigen specificity and relationship of these circulating TFH (cTFH ) cells with other memory CD4+ T cells remain poorly defined. Combining antigenic stimulation and T cell receptor (TCR) Vβ sequencing, we found T cells specific to tetanus toxoid (TT), influenza vaccine (Flu), or Candida albicans (C.alb) in both cTFH and non-cTFH subsets, although with different frequencies and effector functions. Interestingly, cTFH and non-cTFH cells specific for C.alb or TT had a largely overlapping TCR Vβ repertoire while the repertoire of Flu-specific cTFH and non-cTFH cells was distinct. Furthermore, Flu-specific but not C.alb-specific PD-1+ cTFH cells had a "GC TFH -like" phenotype, with overexpression of IL21, CXCL13, and BCL6. Longitudinal analysis of serial blood donations showed that Flu-specific cTFH and non-cTFH cells persisted as stable repertoires for years. Collectively, our study provides insights on the relationship of cTFH with non-cTFH cells and on the heterogeneity and persistence of antigen-specific human cTFH cells.

Keywords: Candida albicans; T follicular helper cells; TCR Vβ sequencing; influenza vaccine; tetanus toxoid.


Conflict of interest statement

The authors declare no commercial or financial conflict of interests.

Figures

Figure 1
Figure 1
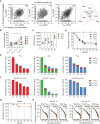
Variable TCR Vβ repertoire overlap between cTFH and non‐cTFH cells specific for different microbial antigens. (A) Flow cytometry analysis on a representative donor showing the expression of CXCR5 and CCR6 on CD4+ memory T cells. (B) Four memory T cell subsets were FACS‐sorted according to CXCR5 and CCR6 differential expression, labeled with CFSE, and stimulated with influenza vaccine (Flu), tetanus toxoid (TT) or C. albicans (C.alb) in the presence of autologous monocytes. Shown are the percentages of proliferating CFSElow cells at 6–7 days post stimulation. In all conditions, 85%‐98% of CFSElow cells expressed the activation markers CD25 and/or ICOS. Each symbol indicates a different healthy donor (n = 5 donors for Flu, n = 3 for TT, and n = 4 for C.alb). * p‐value < 0.05, ** p‐value < 0.01, *** p‐value < 0.001, **** p‐value < 0.0001, as determined by two‐tailed paired t test. (C) Flu‐, TT‐ and C.alb‐specific CFSElow T cells from each subset were FACS‐sorted and their repertoire was analyzed by next generation TCR Vβ sequencing. Shown are the cytoscape clonal networks of TCR Vβ repertoire of antigen‐specific T cells isolated from CXCR5+CCR6+ (purple), CXCR5CCR6+ (blue), CXCR5+CCR6 (pink), and CXCR5CCR6 (green) T cell subsets. Numbers of total (colored) and shared (black) TCR Vβ clonotypes are indicated. Clonotypes shared among two or three subsets are shown as black dots and clonotypes shared among all four subsets are shown as red dots. Data are from three representative donors (one for each antigen condition, indicated in panel B with blue symbols) out of six donors analyzed. (D) Shown is the fraction of unique and shared TCR Vβ clonotypes in each sample reported in panel C. Only the major responder T cell subsets for each type of antigen are reported. (E) Dendrogram plots of repertoire similarity among the four subsets based on the Morisita‐Horn similarity index between pairs of TCR Vβ repertoires. (F) Pairwise comparisons of TCR Vβ clonotype frequency distribution in antigen‐specific CFSElow T cell lines isolated from cTFH and non‐cTFH cells reported in panel C. Frequencies are reported as a percentage of productive templates. The total number of clonotypes is indicated in the x‐ and y‐axes. The number of clonotypes shared between two samples are reported in the upper right corner. (G) Shown is the cumulative frequency of unique and shared TCR Vβ clonotypes in each sample reported in panel C. Only the major responder T cell subsets for each type of antigen are reported.
Figure 2
Figure 2
Flu‐specific cells are enriched in PD‐1+ cTFH and have a distinct repertoire. (A) Percentages of proliferating CFSElow cells measured at day 6–7 post stimulation of T cell subsets with Flu or C. al C.alb) in the presence of autologous monocytes. Each symbol indicates a different healthy donor (n = 7 for Flu, and n = 7 for C.alb). * p‐value < 0.05, ** p‐value < 0.01, as determined by two‐tailed paired t test. (B) The TCR Vβ repertoire of Flu‐ and C.alb‐specific CFSElow T cells from each subset was determined by next generation sequencing. The numbers of TCR Vβ clonotypes detected from each antigen‐specific PD‐1+ cTFH, PD‐1 cTFH and CXCR5 subsets and technical replicates are reported in the black cells of the table. The numbers of clonotypes shared between technical replicates are shown in the grey cells. The numbers of clonotypes shared between any pair of two different subsets are reported in the white cells. Data are from two representative donors (one for each antigen condition, indicated in panel A with blue symbols) out of three donors analyzed. (C) Percentages of unique and shared clonotypes between technical replicates and between different subsets, determined by the Jaccard index calculated on the samples reported in panel B. (D) Cumulative frequencies of unique and shared clonotypes between technical replicates and between different subsets, determined as the average of the cumulative frequencies of the shared clonotypes in each of the two subsets calculated on the samples reported in panel B. (E) Normalized TCR overlap score between pairs of TCR Vβ repertoires of antigen‐specific PD‐1+ cTFH, PD‐1 cTFH and non‐cTFH cells, calculated by Chao‐Jaccard similarity index normalized on technical replicates. Data are multiple pairwise comparisons of the samples reported in panel B. * p‐value < 0.05, ** p‐value < 0.01, *** p‐value < 0.001, **** p‐value < 0.0001, as determined by one‐way ANOVA with Tukey multiple comparisons test. (F) Heat map reporting the frequencies of the top 5% most expanded TCR Vβ clonotypes in the samples reported in panel B (433 Flu‐specific and 201 C.alb‐specific clonotypes, respectively) ranked by the sum frequency of each clone. Dendrograms are based on the Morisita‐Horn similarity index between pairs of TCR Vβ repertoires.
Figure 3
Figure 3
Flu‐specific PD‐1+ cTFH cells phenotypically resemble GC TFH cells. (A) Heat map of the mRNA expression level of selected genes from antigen‐specific PD‐1+ cTFH, PD‐1 cTFH, and non‐cTFH cells. TFH‐related and Th1‐related genes are shown for Flu‐specific cells (upper panels). TFH and Th17‐related genes are shown for C. albicans‐specific cells (lower panels). Gene expression is normalized based on the average mRNA counts of each gene from the three T cell subsets. Data from n = 4 healthy donors (HD1‐4) are shown. (B) Shortlist of GC TFH‐related genes ranked based on the gene expression ratio of PD‐1+ cTFH to PD‐1 cTFH specific for influenza (left panel) or C. albicans (right panel). Ratios falling into the range of 0.67‐1.5 were considered not significant. (C) Concentrations of CXCL13 in the day 6–7 culture supernatants of T cell subsets stimulated with Flu or C.alb, as measured by ELISA. For each antigen condition, shown are the experimental replicates (n = 4‐10) from one representative donor out of n = 3 donors analysed. Background cytokine production measured in T cells cultured with monocytes in the absence of the antigen is shown as dashed lines. * p‐value < 0.05, ** p‐value < 0.01, **** p‐value < 0.0001, as determined by two‐tailed unpaired t test. (D) Concentrations of IL‐21 in the day 6–7 culture supernatants of T cell subsets stimulated with Flu or C.alb, as measured by ELISA. For each antigen condition, shown are the experimental replicates (n = 6‐20) from one representative donor out of n = 3 donors analyzed. Background cytokine production measured in T cells cultured with monocytes in the absence of the antigen is shown as dashed lines. ** p‐value < 0.01, as determined by two‐tailed unpaired t test.
Figure 4
Figure 4
Flu‐specific cTFH and TEM cells induced by infection or vaccination are persistent and phenotypically stable. (A) Serial blood donations from a Flu vaccinated individual were collected and next generation TCR Vβ sequencing was performed on CFSElow proliferating T cells isolated from Flu‐stimulated cTFH, TCM, and TEM subsets (initial input 5×10⁵ cells per subset) at each time‐point. Shown is the pairwise comparison of TCR Vβ clonotype frequency distribution in Flu‐specific cTFH, TCM, and TEM subsets at the initial time‐point of analysis (t1: May 2014). Frequencies are shown as percentage of productive templates. The total number of clonotypes is indicated in the x‐ and y‐axes. Values in the upper right corner represent the number of clonotypes shared between two samples. The Venn diagrams show the number of unique and shared Flu‐specific TCR Vβ clonotypes between cTFH, TCM and TEM subsets. (B) Sample overlap between pairs of Flu‐specific TCR Vβ repertoires was calculated using the Chao–Jaccard similarity index. The bar histograms show the Chao‐Jaccard index between pairs of Flu‐specific cTFH, TCM, and TEM TCR Vβ repertoires obtained from serial blood donations of a healthy donor (t1: May 2014, t2: Feb 2015, t3: Sep 2015, t4: Jan 2016, t5: Nov 2017). *p < 0.05 as determined by two‐tailed paired t test. (C) Number of productive TCR Vβ clonotypes detected by next generation sequencing of Flu‐specific cTFH (red circles), TCM (green squares), and TEM (blue triangles) cells at each time‐point of the longitudinal analysis. (D and E) The Flu‐specific TCR Vβ clonotypes found at the initial time‐point (t1) in CFSElow cultures from cTFH (3529 clonotypes), TCM (2900 clonotypes), and TEM (3090 clonotypes) were followed in a longitudinal analysis of serial blood donations. The fraction of TCR Vβ clonotypes detected in CFSElow cultures at each subsequent time‐point is reported in (D) as percentage of start for cTFH (red circles), TCM (green squares), and TEM (blue triangles). Dates of seasonal Flu vaccination are reported as dashed lines. The stacked barplots in (E) show a longitudinal analysis of the phenotype distribution of Influenza‐specific clonotypes originally detected at the initial time‐point (t1) in CFSElow cultures from T cell subsets (cTFH plotted on the left, TCM in the center, TEM on the right). Each sector reports the percentage of TCR Vβ clonotypes that are found within the original subset (cTFH, TCM and TEM for the plots on the left, center and right, respectively) or transitioned to other subsets at each time‐point. Data are expressed as percentage of start, and subsets are color‐coded (cTFH in red, TCM in green, and TEM in blue). (F) Within the Flu‐specific TCR Vβ clonotypes found at the initial time‐point (t1) only in CFSElow cultures from cTFH (cTFH‐only: 2541 clonotypes), TCM (TCM‐only: 1743 clonotypes), or TEM (TEM‐only: 1819 clonotypes), the top 5% clonotypes were shortlisted (top 5% cTFH‐only: 127 clonotypes, top 5% TCM‐only: 87 clonotypes, top 5% TEM‐only: 91 clonotypes) and followed in CFSElow cultures from subsequent time‐points. The stacked barplots report a longitudinal analysis of the phenotype distribution of the shortlisted TCR Vβ clonotypes detected at each subsequent time‐point (top 5% cTFH‐only plotted on the left, top 5% TCM‐only in the center, top 5% TEM‐only on the right). Each sector reports the percentage of TCR Vβ clonotypes that are found within the original subset (cTFH, TCM and TEM for the plots on the left, center and right, respectively) or transitioned to other subsets at each time‐point. Data are expressed as percentage of start, and subsets are color‐coded (cTFH in red, TCM in green, and TEM in blue). (G and H). The Flu‐specific TCR Vβ clonotypes found at the initial time‐point (t1) shared among CFSElow cultures from cTFH, TCM and TEM were shortlisted (318 clonotypes) and followed in subsequent time‐points. The fraction of TCR Vβ clonotypes detected at each subsequent time‐point is reported in (G) as percentage of start. Dates of seasonal Flu vaccination are reported as dashed lines. Panel (H) shows the frequency distribution of TCR Vβ clonotypes from total cTFH, TCM, and TEM subsets sequenced directly after ex vivo isolation from the same individual at t1 (May 2014, plots on the left) and t5 (Nov 2017, plots on the right). Frequencies are shown as percentage of productive templates. Colored circles mark the TCR Vβ clonotypes belonging to the shortlist of 318 shared clonotypes. The total number of TCR Vβ clonotypes and the number of retrieved clonotypes from the group of 318 shared clonotypes are reported on top of each graph in black and orange, respectively. Dotted lines in the graphs indicate the frequency threshold of the top 5% expanded clonotypes.

References

    1. Breitfeld, D. , Ohl, L. , Kremmer, E. , Ellwart, J. , Sallusto, F. , Lipp, M. , Förster, R. et al., Follicular B helper T cells express CXC chemokine receptor 5, localize to B cell follicles, and support immunoglobulin production. J. Exp. Med. 2000;192(11):1545–52. - PMC - PubMed
    1. Schaerli, P. , Willimann, K. , Lang, A. B. , Lipp, M. , Loetscher, P. and Moser, B. , CXC chemokine receptor 5 expression defines follicular homing T cells with B cell helper function. J. Exp. Med. 2000;192(11):1553–62. - PMC - PubMed
    1. Gitlin, A. D. , Shulman, Z. , Nussenzweig, M. C. , Clonal selection in the germinal centre by regulated proliferation and hypermutation. Nature. 2014;509(7502):637–40. - PMC - PubMed
    1. Victora, G. D. , Schwickert, T. A. , Fooksman, D. R. , Kamphorst, A. O. , Meyer‐Hermann, M. , Dustin, M. L. and Nussenzweig, M. C. , Germinal center dynamics revealed by multiphoton microscopy with a photoactivatable fluorescent reporter. Cell. 2010;143(4):592–605. - PMC - PubMed
    1. Fazilleau, N. , Eisenbraun, M. D. , Malherbe, L. , Ebright, J. N. , Pogue‐Caley, R. R. , McHeyzer‐Williams, L. J. and McHeyzer‐Williams, M. G. , Lymphoid reservoirs of antigen‐specific memory T helper cells. Nat. Immunol. 2007;8(7):753–61. - PubMed

Publication types

Substances