. 2022 Dec 15;29(12):1729-1738.e8.
doi: 10.1016/j.chembiol.2022.11.007. Epub 2022 Dec 7.

A photocaged orexin-B for spatiotemporally precise control of orexin signaling

Affiliations

A photocaged orexin-B for spatiotemporally precise control of orexin signaling

Loïc Duffet et al. Cell Chem Biol. .

Abstract

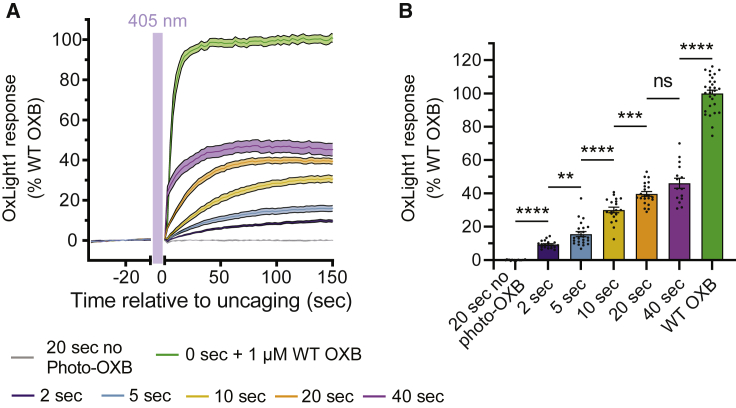
Orexin neuropeptides carry out important neuromodulatory functions in the brain, yet tools to precisely control the activation of endogenous orexin signaling are lacking. Here, we developed a photocaged orexin-B (photo-OXB) through a C-terminal photocaging strategy. We show that photo-OXB is unable to activate its cognate receptors in the dark but releases functionally active native orexin-B upon uncaging by illumination with UV-visible (UV-vis) light (370-405 nm). We established an all-optical assay combining photo-OXB with a genetically encoded orexin biosensor and used it to characterize the efficiency and spatial profile of photo-OXB uncaging. Finally, we demonstrated that photo-OXB enables optical control over orexin signaling with fine temporal precision both in vitro and ex vivo. Thus, our photocaging strategy and photo-OXB advance the chemical biological toolkit by introducing a method for the optical control of peptide signaling and physiological function.

Keywords: G protein-coupled receptor; biosensor; genetically encoded sensor; neuropeptides; orexin-B; photocage.


Conflict of interest statement

Declaration of interests The authors filed a patent application on the photo-OXB compound.

Figures

None
Graphical abstract
Figure 1
Figure 1
Development and characterization of photo-OXB (A) Amino acid sequence of all synthesized OXB derivatives and their basal activity relative to (wild type [WT]) OXB measured in (B). Photocaged positions are indicated with stars along with their molecular structures. (B) Graph showing normalized fluorescence intensity quantified from the 10 frames before addition of WT OXB. Mean ± SEM. n = 14, 18, 14, 24, 20, and 22 cells from 3 independent experiments for R13K, R10K, R10K/R13K, R13KNPE, OXB29K, and photo-OXB respectively. (C) Mean fluorescence responses of OxLight1-expressing HEK293T cells upon bath application of 1 μM OXB derivatives (light gray shade), normalized to maximal response obtained with 10 μM WT OXB (dark gray shade). (D) UV-vis absorbance spectrum for photo-OXB and native WT OXB peptide measured at 80 μM. The dotted vertical lines represent the wavelengths used for uncaging in this study. See also Figure S1.
Figure 2
Figure 2
Efficacy of photo-OXB uncaging (A) Quantification of OxLight1 fluorescent responses in HEK293T cells before and after uncaging normalized to the maximal activation of OxLight1 with 1 μM WT OXB (Sigma) in the absence of uncaging (green trace). Cells were pre-incubated with 1 μM photo-OXB 1 min prior to imaging. Optical uncaging (405 nm laser light) is indicated by the vertical purple shaded area. Uncaging in the absence of photo-OXB on the cells is shown as gray line. Fluorescent signals were quantified approximately 20–80 μm around the uncaging area (n = 15–23 cells from 3 independent experiments). (B) Quantification of the normalized average fluorescence signal from (A) between t = 100 and 150 s after uncaging or application of 1 μM WT OXB. All data are displayed as mean ± SEM. One-way Welch’s ANOVA followed by Dunnett’s T3 multiple comparison test. p values: ns = 0.3336; ∗∗p = 0.0027; ∗∗∗p = 0.0005; ∗∗∗∗p < 0.0001.
Figure 3
Figure 3
Spatial profile of photo-OXB uncaging in vitro (A) Representative SNR heatmaps of OxLight1 responses at different time intervals before and after uncaging (uncaging duration, 20 s). Cells were pre-incubated with 1 μM photo-OXB for 1 min before acquisition. Uncaging area is shown as a white square. The concentric bands around it represent the area considered for analysis of sensor fluorescence response (10 μm increments). (B) Normalized fluorescence of OxLight1 over time measured within each band surrounding the uncaging area. The mean values for each band are displayed as dotted lines and the corresponding curve fit as solid line. Optical uncaging (405 nm laser light) is represented by the vertical purple shaded area. (C) Mean ± SEM values of time constants (τ) calculated from the curve fits from (B) for each condition. Linear regression is shown with a red line, with its 95% confidence interval displayed as dotted black line and the goodness of fit as R2. All data are from 3 independent experiments. Scale bar, 20 μm.
Figure 4
Figure 4
Dark activity and functional effect of photo-OXB uncaging in vitro (A and B) Dose-response curves of miniGq-LgBit complementation assay upon addition of Photo-OXB and WT OXB onto OX2R-SmBit- (A) or OX1R-SmBit-expressing (B) HEK cells. The data were normalized to the maximum signal obtained from WT OXB for each receptor and fitted using a four parameters non-linear regression. The data point corresponding to 100 μM (10−4) photo-OXB on OX2R-smBit was not considered during curve fitting due to the Hook effect and is displayed as an empty circle. All data were obtained from 3 independent experiments and are shown as mean ± SEM. (C–F) Heatmaps of calcium signals over time for HEK293T cells expressing either OX1R and jRGECO1a (D and F) or OX2R and jRGECO1a (C and E). Signals from calcium-responsive cells were normalized to the maximal fluorescence intensity obtained by addition of ionomycin (10 μM). Each row represents a single cell, and a representative calcium trace from one cell is shown above for each panel in purple. The timepoints and concentrations of photo-OXB, WT OXB (Sigma), and ionomycin bath application are indicated above the heatmaps as lines. The time point of optical uncaging (405 nm laser light) is indicated by an arrow and a white vertical line on the heatmaps. n = 18, 25, 23, and 18 cells from 3 independent experiments for (C) to (F), respectively). (G) Representative images from HEK cells coexpressing jRGECO1a and OX1R or OX2R after Alexa 647-coupled anti-FLAG antibody labeling. Uncaging areas shown as white squares. All scale bars, 20 μm. (H) Quantification of the total normalized area under the curve after addition of photo-OXB and uncaging or addition of OXB WT without uncaging from (C)–(F) and Figure S2A (adjusted p values: ∗∗∗p = 0.0003; ∗∗∗∗p < 0.0001; one-way Welch’s ANOVA followed by Dunnett’s T3 multiple comparison test). Shown are mean ± SEM. See also Figure S2.
Figure 5
Figure 5
Functional effect of photo-OXB uncaging in acute brain slices (A) Schematic of the experiment. Whole-cell patch clamp recordings were performed in the nucleus accumbens (NAc). (B) Putative cell identity was defined by recording of the electrophysiological signature of morphologically identified medium spiny neurons in response to current injections (Figure S3; for details, see STAR Methods). (C) Effect of uncaging of photo-OXB (300 nM) on the membrane potential in putative D1-MSNs (left) and putative D2-MSNs (right). Number of recorded neurons; putative D1-MSNs: control/photo-OXB/suvorexant 14/17/5; putative D2-MSNs: control/photo-OXB/suvorexant 9/1⅝. UV light (385 nm, 2 mW/mm2) was applied for 2 continuous seconds to uncage photo-OXB. (D) Area under the curve (AUC) of the change of the membrane potential. AUC of putative D2-MSNs upon uncaging in the presence of photo-OXB was significantly larger than the other conditions. That effect was abolished by the application of suvorexant (1 μM). One-way ANOVA; F(5,62) = 12.08, p < 0.0001. Post hoc comparison with Bonferroni test yielded p < 0.0001 for D1-MSN control versus D2-MSN photo-OXB; p < 0.0001 for D1-MSN photo-OXB versus D2-MSN photo-OXB; p < 0.0001 for D2-MSN control versus D2-MSN photo-OXB; p < 0.001 for D1-MSN suvorexant versus D2-MSN photo-OXB; p < 0.001 for D2-MSN suvorexant versus D2-MSN photo-OXB. ∗∗∗∗p < 0.0001, ∗∗∗p < 0.001. D1-MSN control, n = 9 neurons; D1-MSN photo-OXB, n = 17 neurons; D1-MSN photo-OXB with suvorexant, n = 5 neurons; D2-MSN control, n = 9 neurons; D2-MSN photo-OXB, n = 15 neurons; D2-MSN photo-OXB with suvorexant, n = 8 neurons. (E) Uncaging of photo-OXB increased firing rate in putative D2-MSNs but not D1-MSNs. Two-way ANOVA; D1-MSNs; F(1,6) = 4.85, p = 0.0698; D2-MSNs; F(1,6) = 8.04, p = 0.0297. Example traces show current injection-induced spike firing (100 pA) before and after uncaging of photo-OXB. Scale bars: 200 ms, 20 mV. (F) The amplitude of depolarization induced by bath application of WT OXB (300 nM) was not significantly different from uncaging of photo OXB. Representative trace (left) and group data. D2-MSN photo-OXB, n = 15 neurons; D2-MSN WT OXB, n = 11 neurons. Unpaired t test; t = 1.291, df = 24, p = 0.2090. Error bars, mean ± SEM. See also Figure S3.
None

References

    1. Sakurai T., Amemiya A., Ishii M., Matsuzaki I., Chemelli R.M., Tanaka H., Williams S.C., Richardson J.A., Kozlowski G.P., Wilson S., et al. Orexins and orexin receptors: a family of hypothalamic neuropeptides and G protein-coupled receptors that regulate feeding behavior. Cell. 1998;92:573–585. doi: 10.1016/S0092-8674(00)80949-6. - DOI - PubMed
    1. de Lecea L., Kilduff T.S., Peyron C., Gao X., Foye P.E., Danielson P.E., Fukuhara C., Battenberg E.L., Gautvik V.T., Bartlett F.S., et al. The hypocretins: hypothalamus-specific peptides with neuroexcitatory activity. Proc. Natl. Acad. Sci. USA. 1998;95:322–327. doi: 10.1073/pnas.95.1.322. - DOI - PMC - PubMed
    1. Sakurai T. The role of orexin in motivated behaviours. Nat. Rev. Neurosci. 2014;15:719–731. doi: 10.1038/nrn3837. - DOI - PubMed
    1. Marcus J.N., Elmquist J.K. In: The Orexin/Hypocretin System: Physiology and Pathophysiology Contemporary Clinical Neuroscience. Nishino S., Sakurai T., editors. Humana Press; 2005. Orexin projections and localization of orexin receptors; pp. 21–43.
    1. Lin L., Faraco J., Li R., Kadotani H., Rogers W., Lin X., Qiu X., de Jong P.J., Nishino S., Mignot E. The sleep disorder canine narcolepsy is caused by a mutation in the hypocretin (orexin) receptor 2 gene. Cell. 1999;98:365–376. doi: 10.1016/S0092-8674(00)81965-0. - DOI - PubMed

Publication types

LinkOut - more resources