

The Association of Alcohol Consumption with Glaucoma and Related Traits: Findings from the UK Biobank
- PMID: 36481453
- PMCID: PMC10239785
- DOI: 10.1016/j.ogla.2022.11.008
The Association of Alcohol Consumption with Glaucoma and Related Traits: Findings from the UK Biobank
Abstract
Purpose: To examine the associations of alcohol consumption with glaucoma and related traits, to assess whether a genetic predisposition to glaucoma modified these associations, and to perform Mendelian randomization (MR) experiments to probe causal effects.
Design: Cross-sectional observational and gene-environment interaction analyses in the UK Biobank. Two-sample MR experiments using summary statistics from large genetic consortia.
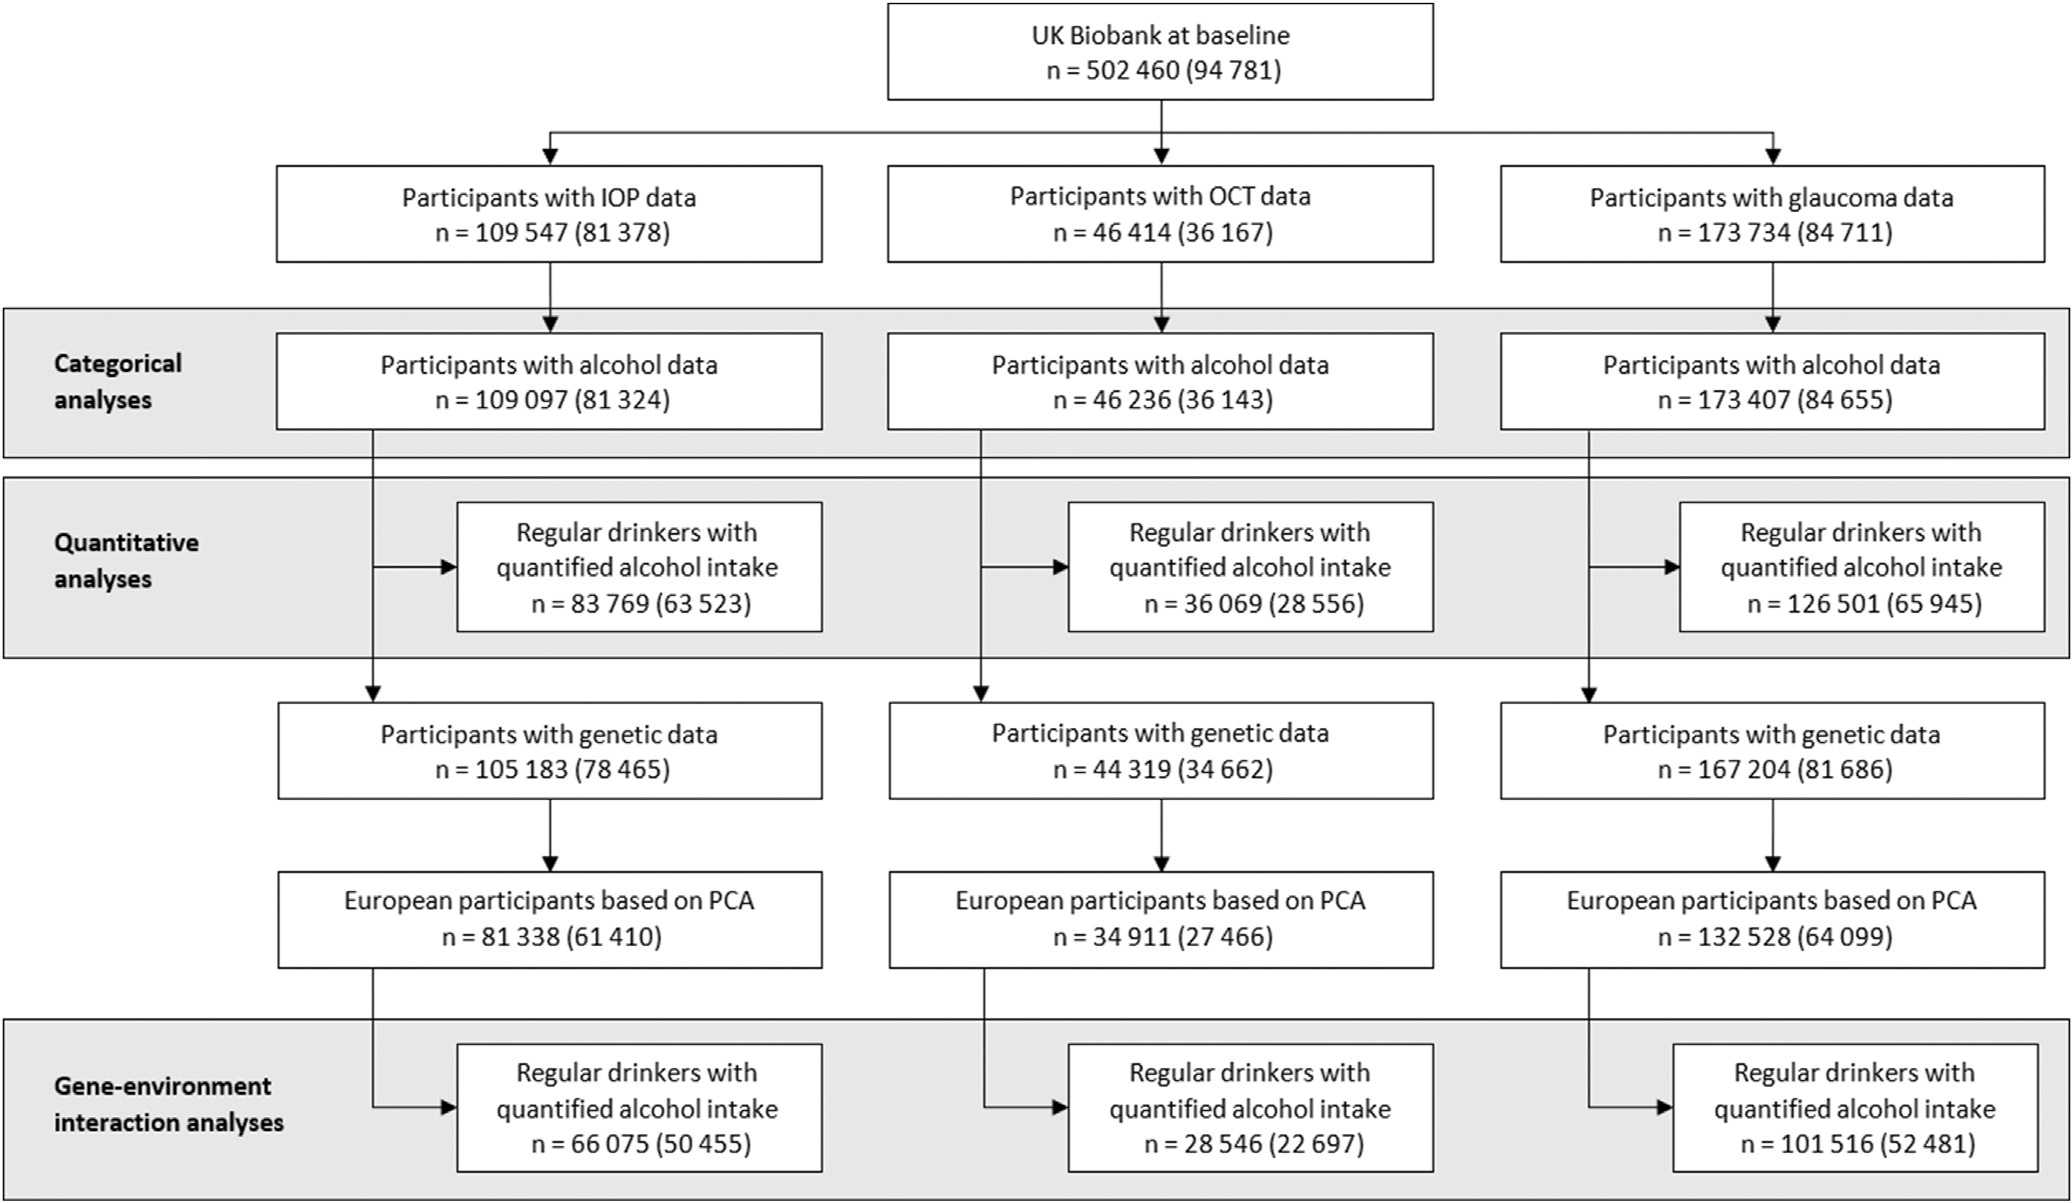
Participants: UK Biobank participants with data on intraocular pressure (IOP) (n = 109 097), OCT-derived macular inner retinal layer thickness measures (n = 46 236) and glaucoma status (n = 173 407).
Methods: Participants were categorized according to self-reported drinking behaviors. Quantitative estimates of alcohol intake were derived from touchscreen questionnaires and food composition tables. We performed a 2-step analysis, first comparing categories of alcohol consumption (never, infrequent, regular, and former drinkers) before assessing for a dose-response effect in regular drinkers only. Multivariable linear, logistic, and restricted cubic spline regression, adjusted for key sociodemographic, medical, anthropometric, and lifestyle factors, were used to examine associations. We assessed whether any association was modified by a multitrait glaucoma polygenic risk score. The inverse-variance weighted method was used for the main MR analyses.
Main outcome measures: Intraocular pressure, macular retinal nerve fiber layer (mRNFL) thickness, macular ganglion cell-inner plexiform layer (mGCIPL) thickness, and prevalent glaucoma.
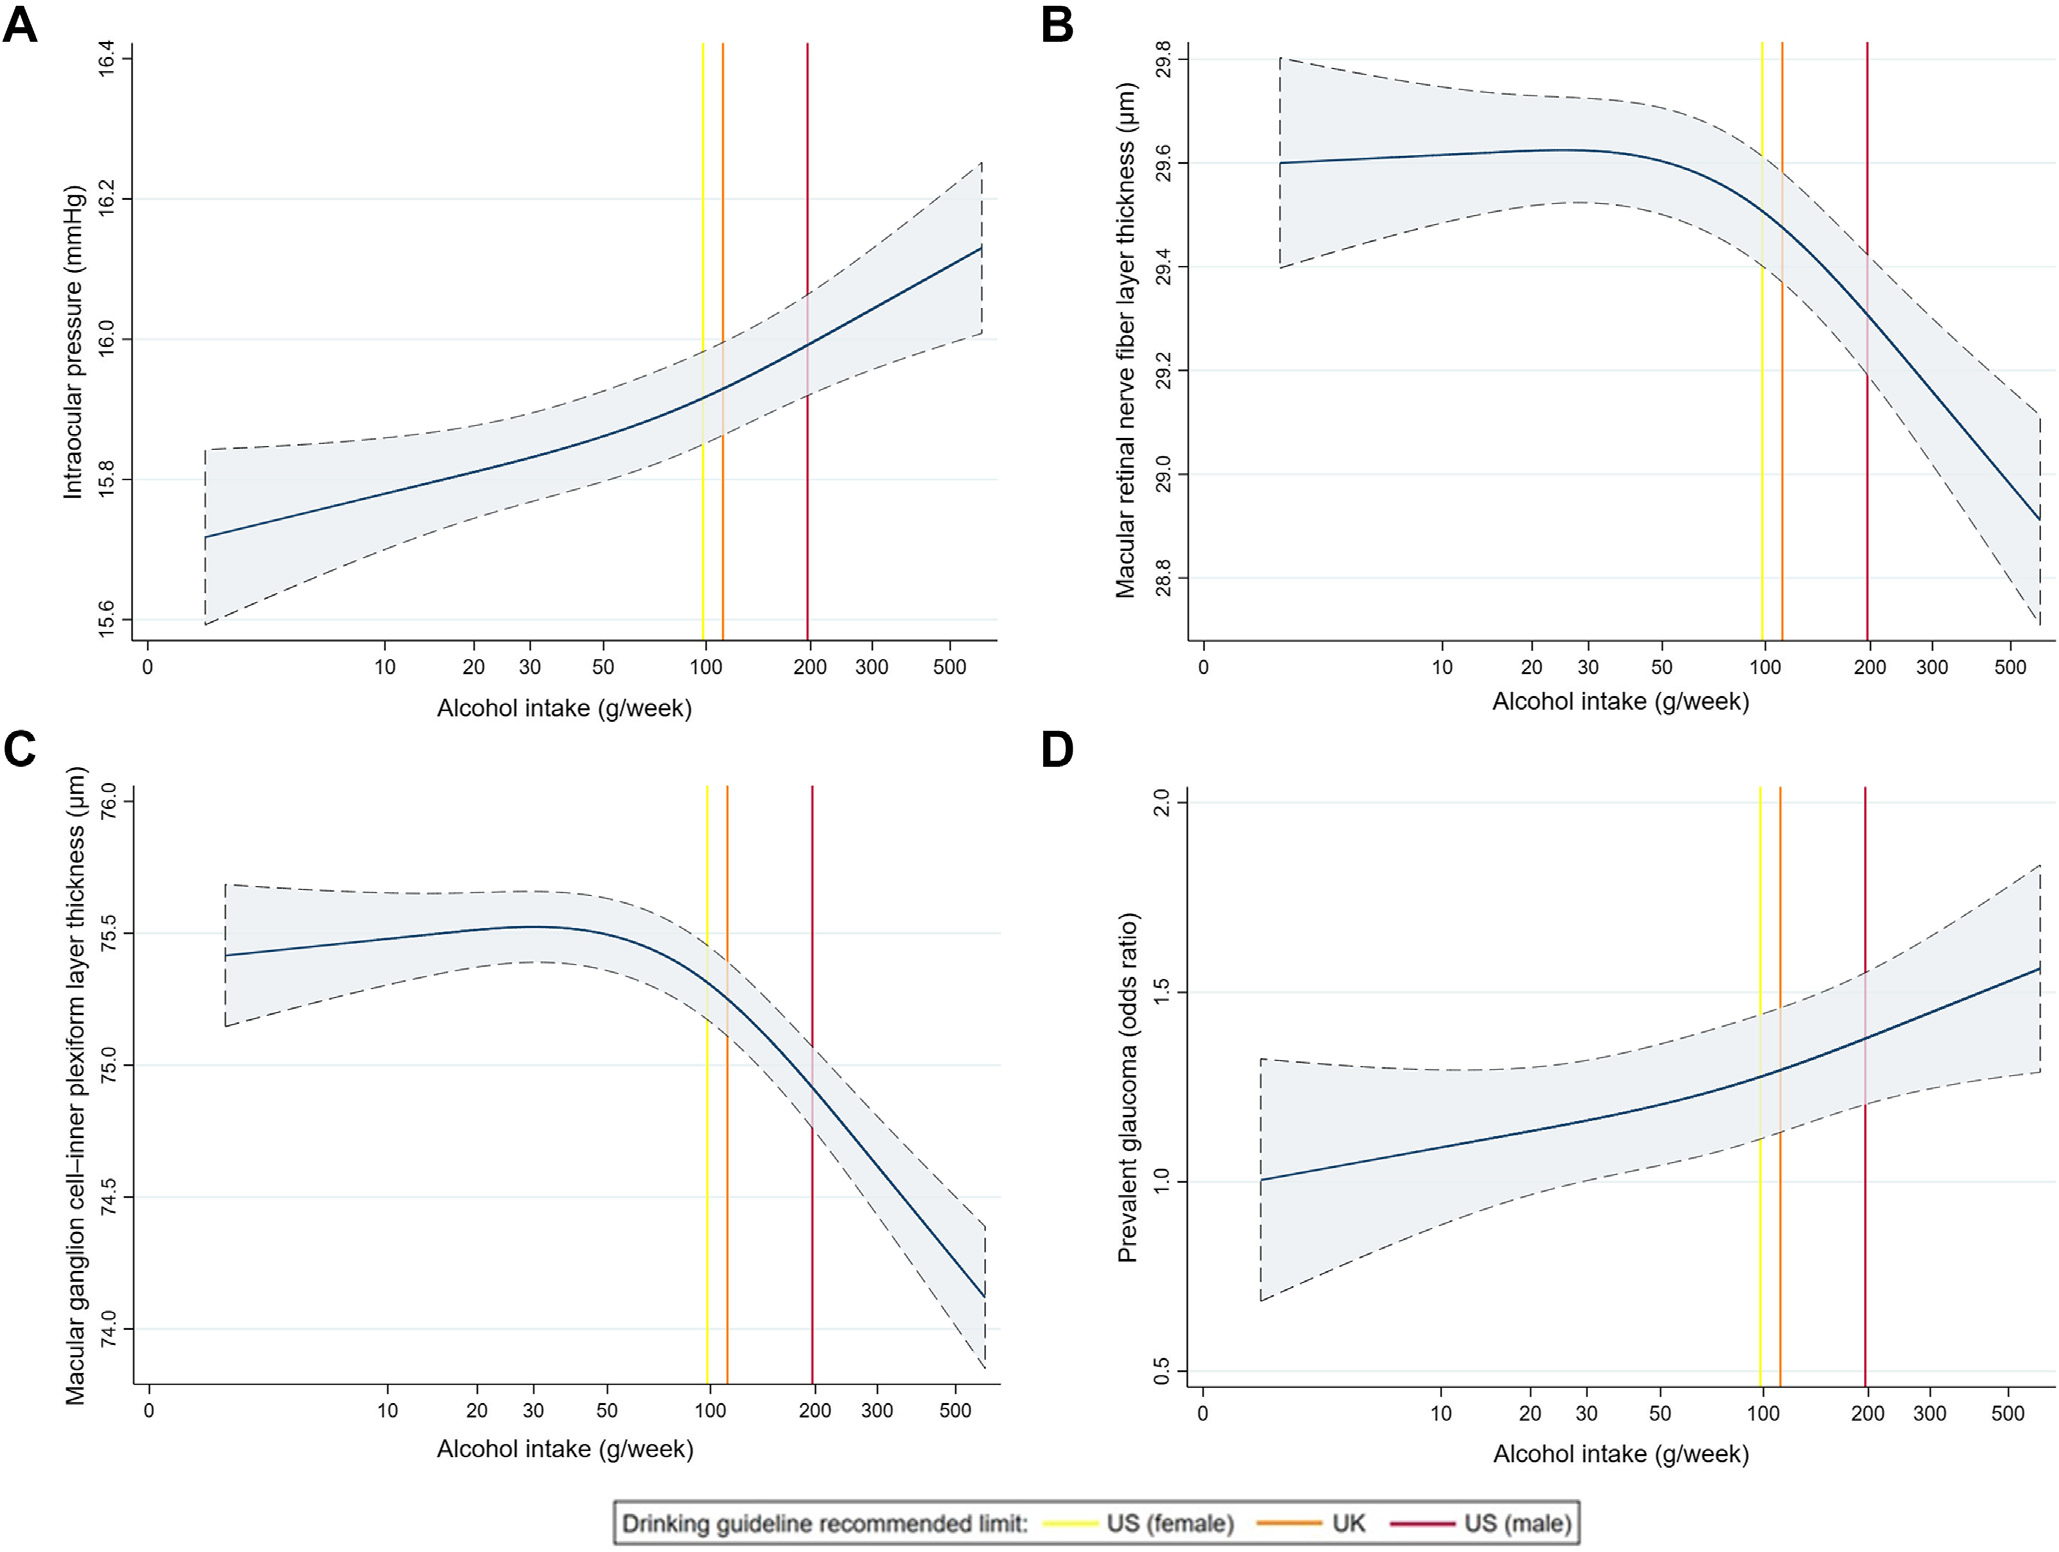
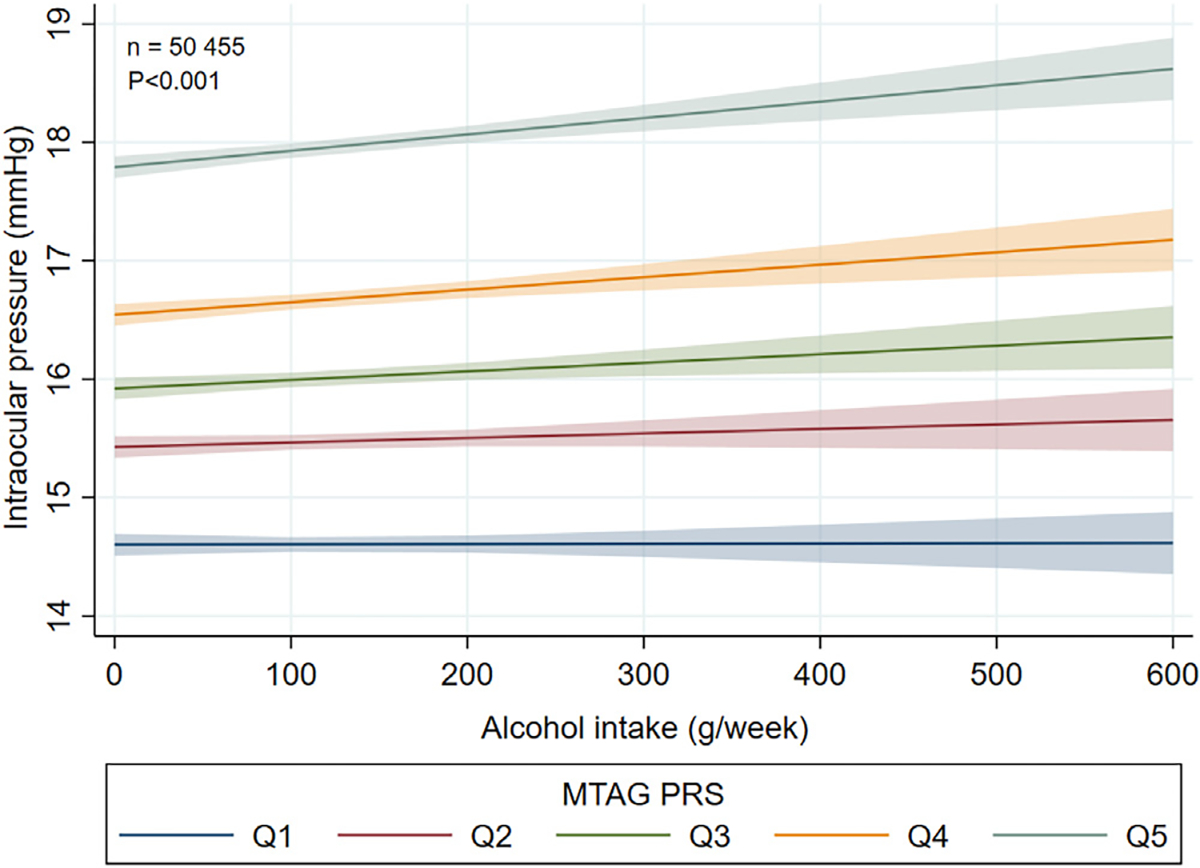
Results: Compared with infrequent drinkers, regular drinkers had higher IOP (+0.17 mmHg; P < 0.001) and thinner mGCIPL (-0.17 μm; P = 0.049), whereas former drinkers had a higher prevalence of glaucoma (odds ratio, 1.53; P = 0.002). In regular drinkers, alcohol intake was adversely associated with all outcomes in a dose-dependent manner (all P < 0.001). Restricted cubic spline regression analyses suggested nonlinear associations, with apparent threshold effects at approximately 50 g (∼6 UK or 4 US alcoholic units)/week for mRNFL and mGCIPL thickness. Significantly stronger alcohol-IOP associations were observed in participants at higher genetic susceptibility to glaucoma (Pinteraction < 0.001). Mendelian randomization analyses provided evidence for a causal association with mGCIPL thickness.
Conclusions: Alcohol intake was consistently and adversely associated with glaucoma and related traits, and at levels below current United Kingdom (< 112 g/week) and United States (women, < 98 g/week; men, < 196 g/week) guidelines. Although we cannot infer causality definitively, these results will be of interest to people with or at risk of glaucoma and their advising physicians.
Financial disclosure(s): Proprietary or commercial disclosure may be found after the references.
Keywords: Alcohol; Glaucoma; Intraocular pressure; OCT; UK Biobank.
Copyright © 2022 American Academy of Ophthalmology. Published by Elsevier Inc. All rights reserved.
Figures
References
-
- World Health Organization. Global status report on alcohol and health 2018. Geneva, Switzerland: World Health Organization; 2018.
-
- Buckingham T, Young R. The rise and fall of intra-ocular pressure: the influence of physiological factors. Ophthalmic Physiol Opt. 1986;6:95–99. - PubMed
-
- Kojima S, Sugiyama T, Kojima M, et al. Effect of the consumption of ethanol on the microcirculation of the human optic nerve head in the acute phase. Jpn J Ophthalmol. 2000;44:318–319. - PubMed
Grants and funding
- MR/T040912/1/MRC_/Medical Research Council/United Kingdom
- MR/T033371/1/MRC_/Medical Research Council/United Kingdom
- MC_QA137853/MRC_/Medical Research Council/United Kingdom
- R01 EY020928/EY/NEI NIH HHS/United States
- R01 EY022305/EY/NEI NIH HHS/United States
- R01 EY015473/EY/NEI NIH HHS/United States
- R01 EY031820/EY/NEI NIH HHS/United States
- WT_/Wellcome Trust/United Kingdom
- R01 EY032559/EY/NEI NIH HHS/United States
- MR/T019050/1/MRC_/Medical Research Council/United Kingdom
- R01 EY027129/EY/NEI NIH HHS/United States
- P30 EY014104/EY/NEI NIH HHS/United States
- MC_PC_17228/MRC_/Medical Research Council/United Kingdom
LinkOut - more resources
Full Text Sources
