. 2023 Feb:84:102680.
doi: 10.1016/j.media.2022.102680. Epub 2022 Nov 17.

The Liver Tumor Segmentation Benchmark (LiTS)

Patrick Bilic  1 Patrick Christ  1 Hongwei Bran Li  2 Eugene Vorontsov  3 Avi Ben-Cohen  4 Georgios Kaissis  5 Adi Szeskin  6 Colin Jacobs  7 Gabriel Efrain Humpire Mamani  7 Gabriel Chartrand  8 Fabian Lohöfer  9 Julian Walter Holch  10 Wieland Sommer  11 Felix Hofmann  12 Alexandre Hostettler  13 Naama Lev-Cohain  14 Michal Drozdzal  15 Michal Marianne Amitai  16 Refael Vivanti  17 Jacob Sosna  14 Ivan Ezhov  1 Anjany Sekuboyina  18 Fernando Navarro  19 Florian Kofler  20 Johannes C Paetzold  21 Suprosanna Shit  1 Xiaobin Hu  1 Jana Lipková  22 Markus Rempfler  1 Marie Piraud  23 Jan Kirschke  24 Benedikt Wiestler  24 Zhiheng Zhang  25 Christian Hülsemeyer  1 Marcel Beetz  1 Florian Ettlinger  1 Michela Antonelli  26 Woong Bae  27 Míriam Bellver  28 Lei Bi  29 Hao Chen  30 Grzegorz Chlebus  31 Erik B Dam  32 Qi Dou  33 Chi-Wing Fu  33 Bogdan Georgescu  34 Xavier Giró-I-Nieto  35 Felix Gruen  36 Xu Han  37 Pheng-Ann Heng  33 Jürgen Hesser  38 Jan Hendrik Moltz  39 Christian Igel  32 Fabian Isensee  40 Paul Jäger  40 Fucang Jia  41 Krishna Chaitanya Kaluva  42 Mahendra Khened  42 Ildoo Kim  27 Jae-Hun Kim  43 Sungwoong Kim  27 Simon Kohl  44 Tomasz Konopczynski  45 Avinash Kori  42 Ganapathy Krishnamurthi  42 Fan Li  46 Hongchao Li  47 Junbo Li  48 Xiaomeng Li  49 John Lowengrub  50 Jun Ma  51 Klaus Maier-Hein  52 Kevis-Kokitsi Maninis  53 Hans Meine  54 Dorit Merhof  55 Akshay Pai  32 Mathias Perslev  32 Jens Petersen  44 Jordi Pont-Tuset  53 Jin Qi  56 Xiaojuan Qi  49 Oliver Rippel  55 Karsten Roth  57 Ignacio Sarasua  58 Andrea Schenk  59 Zengming Shen  60 Jordi Torres  61 Christian Wachinger  62 Chunliang Wang  63 Leon Weninger  55 Jianrong Wu  64 Daguang Xu  65 Xiaoping Yang  66 Simon Chun-Ho Yu  67 Yading Yuan  68 Miao Yue  69 Liping Zhang  67 Jorge Cardoso  26 Spyridon Bakas  70 Rickmer Braren  71 Volker Heinemann  72 Christopher Pal  3 An Tang  73 Samuel Kadoury  3 Luc Soler  13 Bram van Ginneken  7 Hayit Greenspan  4 Leo Joskowicz  6 Bjoern Menze  18
Affiliations

The Liver Tumor Segmentation Benchmark (LiTS)

Patrick Bilic et al. Med Image Anal. 2023 Feb.

Abstract

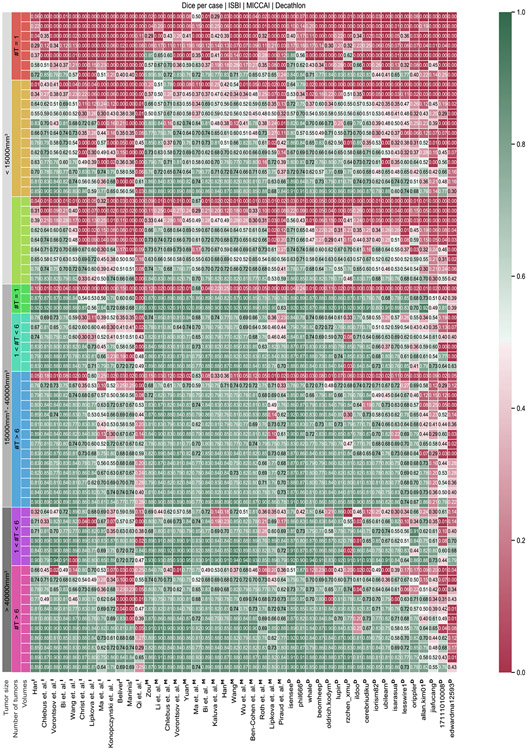
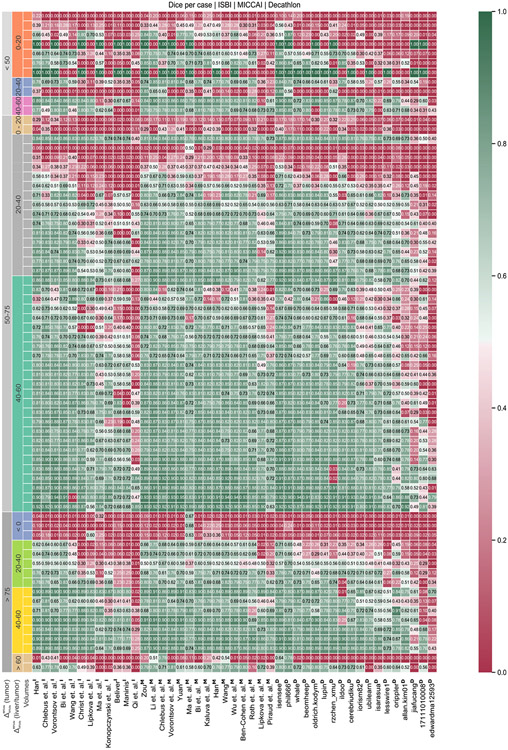
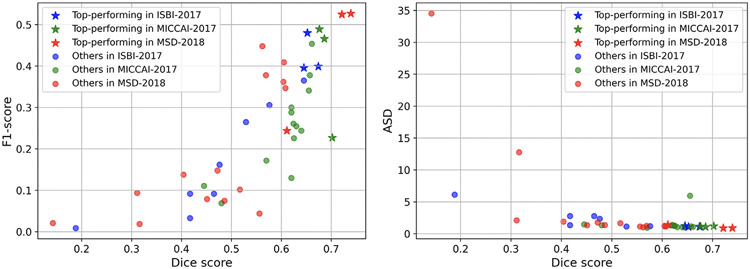
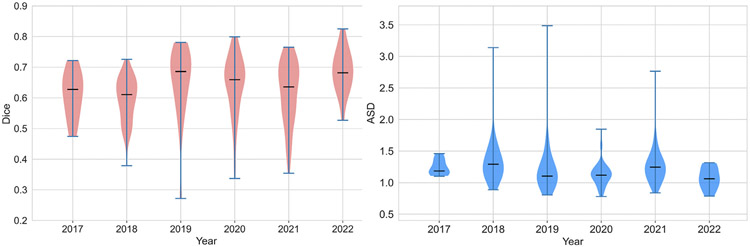
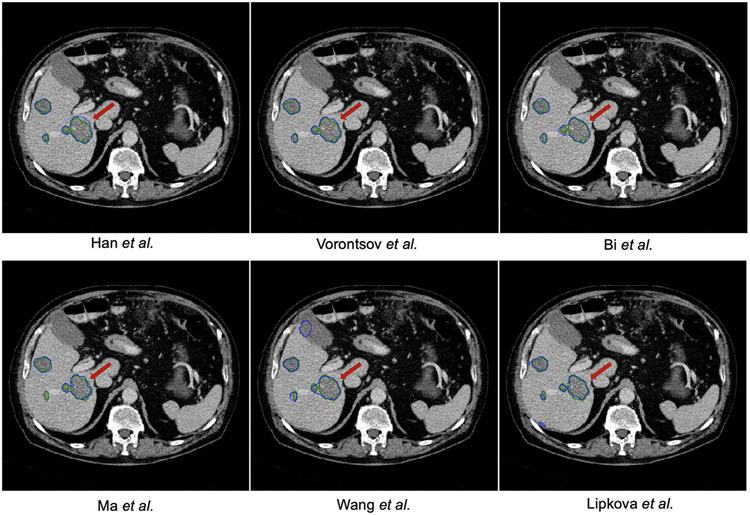
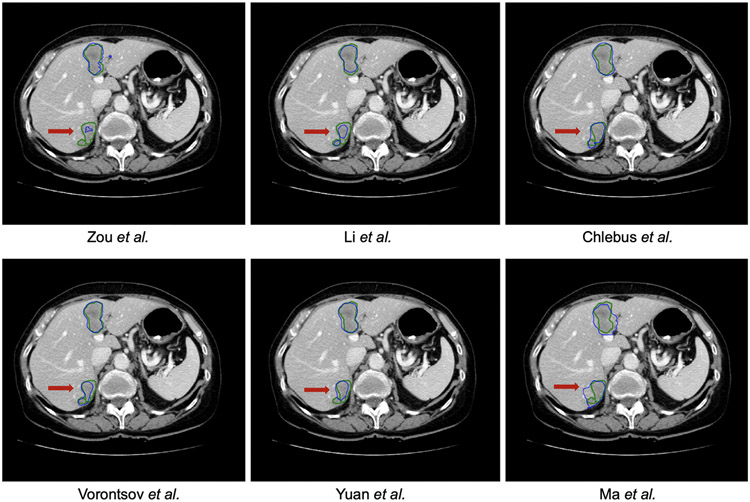
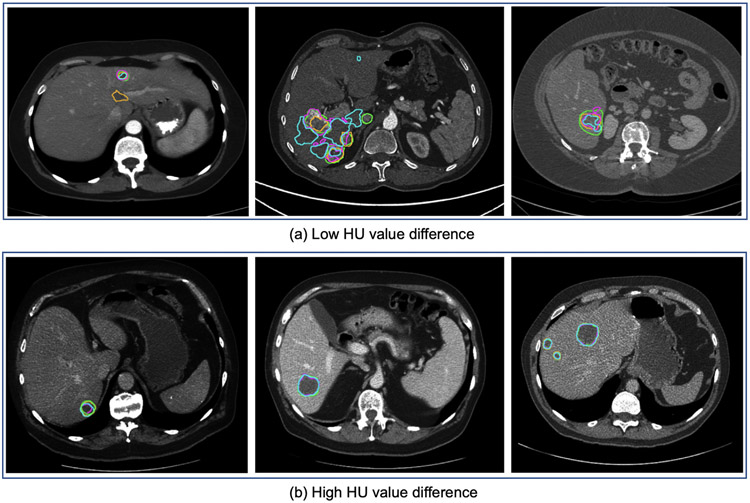
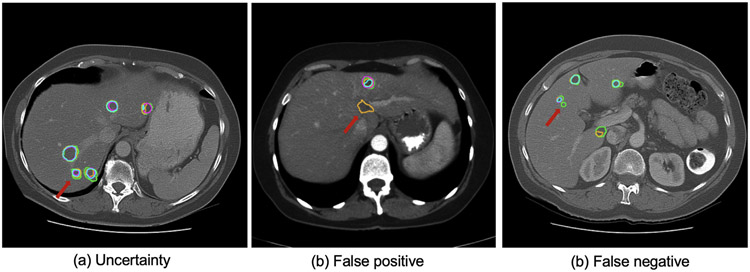
In this work, we report the set-up and results of the Liver Tumor Segmentation Benchmark (LiTS), which was organized in conjunction with the IEEE International Symposium on Biomedical Imaging (ISBI) 2017 and the International Conferences on Medical Image Computing and Computer-Assisted Intervention (MICCAI) 2017 and 2018. The image dataset is diverse and contains primary and secondary tumors with varied sizes and appearances with various lesion-to-background levels (hyper-/hypo-dense), created in collaboration with seven hospitals and research institutions. Seventy-five submitted liver and liver tumor segmentation algorithms were trained on a set of 131 computed tomography (CT) volumes and were tested on 70 unseen test images acquired from different patients. We found that not a single algorithm performed best for both liver and liver tumors in the three events. The best liver segmentation algorithm achieved a Dice score of 0.963, whereas, for tumor segmentation, the best algorithms achieved Dices scores of 0.674 (ISBI 2017), 0.702 (MICCAI 2017), and 0.739 (MICCAI 2018). Retrospectively, we performed additional analysis on liver tumor detection and revealed that not all top-performing segmentation algorithms worked well for tumor detection. The best liver tumor detection method achieved a lesion-wise recall of 0.458 (ISBI 2017), 0.515 (MICCAI 2017), and 0.554 (MICCAI 2018), indicating the need for further research. LiTS remains an active benchmark and resource for research, e.g., contributing the liver-related segmentation tasks in http://medicaldecathlon.com/. In addition, both data and online evaluation are accessible via https://competitions.codalab.org/competitions/17094.

Keywords: Benchmark; CT; Deep learning; Liver; Liver tumor; Segmentation.


Conflict of interest statement

Declaration of Competing Interest The authors declare that they have no known competing financial interests or personal relationships that could have appeared to influence the work reported in this paper.

Figures

Fig. A.10.
Fig. A.10.
Performance w.r.t tumor size and number of tumors. The test dataset is clustered by the number of tumors (#T) and size of the largest tumor per volume. Overall, participating methods perform well on volumes with large tumors and worse for volumes with small tumors. Worst results are achieved in chase where single small tumors (<15 mm3) occur. Best results are achieved when volumes show less than 6 tumors with an overall tumor volume above 40 mm3.
Fig. B.11.
Fig. B.11.
Performance w.r.t HU value difference between tumor and non-tumor liver tissue. Two robust metrics are calculated to cluster the results on the test set. First, the HU value difference between liver and tumor is calculated using both regions’ robust median absolute deviation per volume. Further, the clusters are split up by the tumor HU value difference calculated by the difference of the 90th percentile and 10th percentile. Participating methods perform best for volumes showing higher contrast between liver and tumor. Especially in the case of the liver, HU values are 40–60 points higher than the liver. Worst results are achieved in cases where the contrast is below 20 HU value, including tumors having a lower HU value than the liver.
Fig. C.12.
Fig. C.12.
Split and merge errors where a prediction splits a reference lesion into more than one connected component or merges multiple reference components into one, respectively. Reference connected components are shown with a solid color and predicted as regions with a dashed boundary and hatched interior. One-to-one correspondence is shown in green. One-to-two (a), two-to-one (b), and two-to-three (c) correspondence in orange. False negative in gray.
Fig. C.13.
Fig. C.13.
Two examples (top and bottom) of the process to establish a correspondence between connected components in the reference and prediction masks. Reference: solid color; prediction: dashed boundary and hatched interior. Left: reference components merged if the same predicted component overlaps them. Right: predicted components are merged together if the same merged reference component overlaps them. Corresponding reference and predicted components share the same color (green, orange). An undetected reference component is shown in solid gray. During the merge of reference components (left), predicted components that do not have the most significant overlap with a reference component are left unmatched (gray, dashed, and hatched). Their mapping is completed during the merge of predicted components (right).
Fig. 1.
Fig. 1.
Example from the LiTS dataset depicting a variety of shapes of on contrast-enhanced abdominal CT scans acquired. While most exams in the dataset contain only one lesion, a large group of patients with some (2–7) or many (10–12) lesions, as shown in the histogram calculated over the whole dataset.
Fig. 2.
Fig. 2.
Scatter plots of methods’ performances considering: (a) both segmentation and detection, (b) both distance- and overlap-based metrics for three challenge events. We observe that not all the top-performing methods in three LiTS challenges achieved good scores on tumor detection. The behavior of distance- and overlap-based metrics is similar.
Fig. 3.
Fig. 3.
Inter-rater agreement between the existing annotation and new annotation sets. R1 represented the rater for the existing consensus annotation of the LiTS dataset. R2 re-annotated 15 CT scans from scratch. R3 and R4 are board-certified radiologists who checked and corrected the annotations. Specifically, one board-certified radiologist (R3) reviewed and corrected existing annotations. R4 re-evaluated R3’s final annotations and corrected them. The inter-rater agreement was calculated by the Dice score per case between the pairs of two raters.
Fig. 4.
Fig. 4.
Dice and ASD scores of three top-performing teams over the three events.
Fig. 5.
Fig. 5.
Distribution of mean Dice and ASD scores of all submissions in the CodaLab platform from the year 2017 to the year 2022.
Fig. 6.
Fig. 6.
Tumor segmentation results of the ISBI–LiTS 2017 challenge. The reference annotation is marked with green contour, while the prediction is with blue contour. One could observe that the boundary of liver lesion is rather ambiguous.
Fig. 7.
Fig. 7.
Tumor segmentation results of the MICCAI–LiTS 2017 challenge. The reference annotation is marked with green contour, while the prediction is with blue contour. One could observe that it is highly challenging to segment the liver lesion with poor contrast.
Fig. 8.
Fig. 8.
Tumor segmentation results with selected cases of the tumor segmentation analysis regarding low (<20) and high (40–60) HU value difference. Compared are reference annotation (green), best-performing teams from ISBI 2017 (purple), MICCAI 2017 (orange), and MICCAI 2018 (blue). We can observe that a low HU value difference (<20) between tumor and liver tissue poses a challenge for tumor segmentation.
Fig. 9.
Fig. 9.
Samples of segmentation and detection results for small liver tumor. Compared are reference annotation (green), best-performing teams from ISBI 2017 (purple), MICCAI 2017 (orange), and MICCAI 2018 (blue).

References

    1. Abdel-massieh NH, Hadhoud MM, Amin KM, 2010. Fully automatic liver tumor segmentation from abdominal CT scans. In: Computer Engineering and Systems (ICCES), 2010 International Conference on. IEEE, pp. 197–202.
    1. Albain KS, Swann RS, Rusch VW, Turrisi AT, Shepherd FA, Smith C, Chen Y, Livingston RB, Feins RH, Gandara DR, et al., 2009. Radiotherapy plus chemotherapy with or without surgical resection for stage III non-small-cell lung cancer: A phase III randomised controlled trial. Lancet 374 (9687), 379–386. - PMC - PubMed
    1. Amiranashvili T, Lüdke D, Li H, Zachow S, et al., 2021. Learning shape reconstruction from sparse measurements with neural implicit functions. In: Medical Imaging with Deep Learning.
    1. Antonelli M, Reinke A, Bakas S, Farahani K, Kopp-Schneider A, Landman BA, Litjens G, Menze B, Ronneberger O, Summers RM, et al., 2022. The medical segmentation decathlon. Nature Commun. 13 (1), 1–13. - PMC - PubMed
    1. Bauknecht H-C, Romano VC, Rogalla P, Klingebiel R, Wolf C, Bornemann L, Hamm B, Hein PA, 2010. Intra-and interobserver variability of linear and volumetric measurements of brain metastases using contrast-enhanced magnetic resonance imaging. Invest. Radiol 45 (1), 49–56. - PubMed

Publication types