. 2022 Dec 8;13(1):7578.
doi: 10.1038/s41467-022-35334-x.

Intracellular galectin-3 is a lipopolysaccharide sensor that promotes glycolysis through mTORC1 activation

Affiliations

Intracellular galectin-3 is a lipopolysaccharide sensor that promotes glycolysis through mTORC1 activation

Xing Chen et al. Nat Commun. .

Abstract

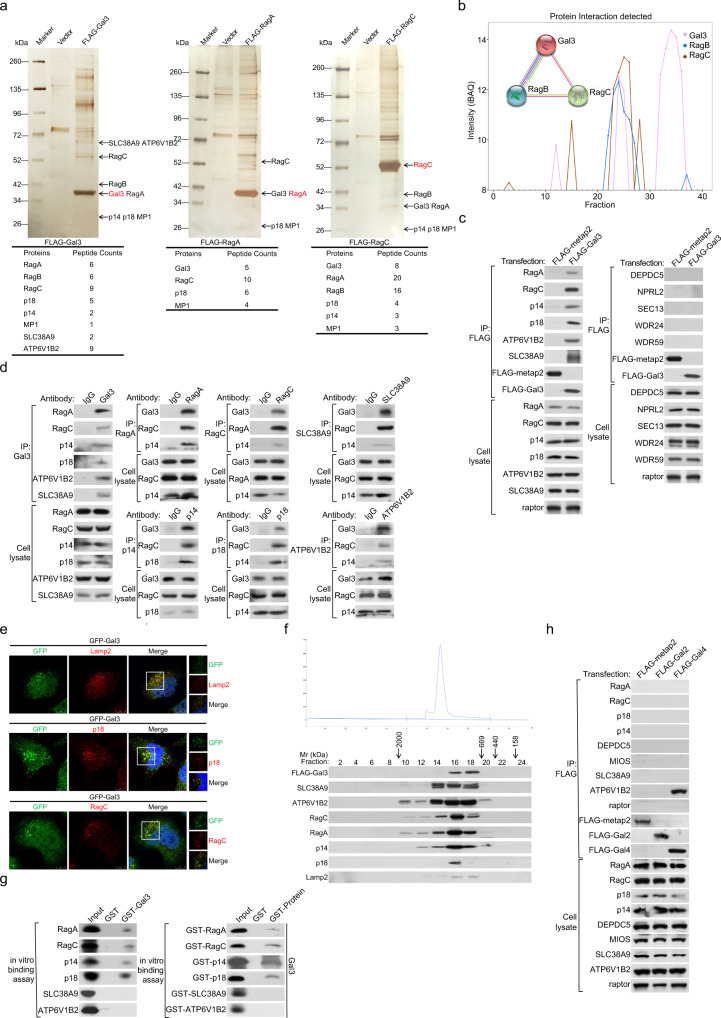
How the carbohydrate binding protein galectin-3 might act as a diabetogenic and tumorogenic factor remains to be investigated. Here we report that intracellular galectin-3 interacts with Rag GTPases and Ragulator on lysosomes. We show that galectin-3 senses lipopolysaccharide (LPS) to facilitate the interaction of Rag GTPases and Ragulator, leading to the activation of mTORC1. We find that the lipopolysaccharide/galectin-3-Rag GTPases/Ragulator-mTORC1 axis regulates a cohort of genes including GLUT1, and HK2, and PKM2 that are critically involved in glucose uptake and glycolysis. Indeed, galectin-3 deficiency severely compromises LPS-promoted glycolysis. Importantly, the expression of HK2 is significantly reduced in diabetes patients. In multiple types of cancer including hepatocellular carcinoma (HCC), galectin-3 is highly expressed, and its level of expression is positively correlated with that of HK2 and PKM2 and negatively correlated with the prognosis of HCC patients. Our study unravels that galectin-3 is a sensor of LPS, an important modulator of the mTORC1 signaling, and a critical regulator of glucose metabolism.


Conflict of interest statement

The authors declare no competing interests.

Figures

Fig. 1
Fig. 1. Galectin-3 interacts with the components of the mTORC1 signaling machinery on lysosomal surface.
a Immunopurification and mass spectrometry analysis of Gal3-, RagA-, or RagC-associated proteins in HEK-293T cells. Cellular extracts from HEK-293T cells expressing FLAG-Gal3, FLAG-RagA, or FLAG-RagC were subjected to affinity purification with an anti-FLAG affinity column and eluted with excess FLAG peptides. The eluates were resolved by SDS-PAGE and silver-stained. The protein bands were retrieved and analyzed by mass spectrometry. b Galectin-3 is co-immunoprecipitated with RagB and RagC. The schematics were from the BioPlex, STRING, and CF-MS explorer databases. c HEK-293T cells were transfected with FLAG-Gal3 or FLAG-metap2. Cellular lysates were immunoprecipitated with anti-FLAG followed by immunoblotting with antibodies against the indicated proteins. Each experiment was repeated three times with similar results. d Co-immunoprecipitation in HEK-293T cells with anti-galectin-3 followed by immunoblotting with antibodies against the indicated proteins, or immunoprecipitation with antibodies against the indicated proteins followed by immunoblotting with antibodies against galectin-3 or against the components of the mTORC1 signaling. Each experiment was repeated three times with similar results. e HEK-293T cells were transfected with GFP-Gal3 followed by immunofluorescent staining for Lamp2 (red), p18 (red), or RagC (red). Scale bar: 10 μm. Each experiment was repeated three times with similar results. f FPLC analysis of FLAG affinity eluates in HEK-293T cells stably expressing FLAG-Gal3. Chromatographic elution profiles and immunoblotting analysis of the chromatographic fractions are shown. Equal volume from each fraction was analyzed, and the elution position of calibration proteins with known molecular masses (kDa) are indicated. Western blotting of galectin-3-containing complex fractionated by Superose 6 gel filtration is shown. g GST pull-down assays with GST-fused galectin-3, RagA, RagC, p14, p18, SLC38A9, or ATP6V1B2 and in vitro transcribed/translated proteins as indicated. Each experiment was repeated three times with similar results. h Co-immunoprecipitation in HEK-293T cells transfected with FLAG-Gal2 or FLAG-Gal4 with anti-FLAG followed by immunoblotting with antibodies against the indicated proteins. Each experiment was repeated three times with similar results.
Fig. 2
Fig. 2. Galectin-3 facilitates the interaction of Rag GTPases and Ragulator to stimulate the mTORC1 signaling.
a HEK-293T cells were transfected with the indicated plasmids for co-immunoprecipitation with anti-FLAG followed by immunoblotting with antibodies against the indicated proteins. b HEK-293T cells were infected with lentiviruses carrying shGFP or shGal3 and transfected with FLAG-metap2, FLAG-RagA, or FLAG-RagC. Cellular lysates were immunoprecipitated with anti-FLAG followed by immunoblotting with antibodies against the indicated proteins. Each experiment was repeated three times with similar results. c HEK-293T cells were infected with lentiviruses carrying shGFP or shGal3, or HA-Vector or HA-Gal3 with or without the treatment with the mTOR inhibitor Torin1 (250 nM) for western blotting analysis of the level or phosphorylation of the indicated proteins. Each experiment was repeated three times with similar results. d MEFs cells were treated with galectin-3 siRNA, starved of amino acids and glucose for 1 h, and stimulated with LPS (1 μg/ml) for 5 h for western blotting analysis of the level or phosphorylation of the indicated proteins. e Galectin-3-deficient HEK-293T cells were co-transfected with FLAG-S6K1 and HA-metap2 or increasing amounts of HA-Gal3. Cellular lysates were immunoprecipitated with anti-FLAG followed by immunoblotting with antibodies against the indicated proteins. Each experiment was repeated three times with similar results. f HEK-293T (upper) and MEFs (lower) were treated with different concentrations of GB1107 for western blotting analysis of the level or phosphorylation of the indicated proteins. Each experiment was repeated three times with similar results. g HEK-293T cells were treated with siRNAs against galectin-2 or galectin-4 or transfected with FLAG-Gal2 or FLAG-Gal4, starved of amino acids and glucose for 1 h, and stimulated with LPS (1 μg/ml) for 5 h for western blotting analysis of the level or phosphorylation of the indicated proteins. Each experiment was repeated three times with similar results.
Fig. 3
Fig. 3. Galectin-3 senses LPS to activate mTORC1.
a HEK-293T cells were infected with lentiviruses carrying shGFP or shGal3, starved of amino acids for 50 min, and replenished with amino acids for 10 min for western blotting analysis of the level or phosphorylation of the indicated proteins. Each experiment was repeated three times with similar results. b HEK-293T cells were starved of amino acids and glucose for 1 h followed by stimulation with LPS (1 μg/ml) for 5 h in the presence or absence of the mTOR inhibitor Torin1 (250 nM) or galectin-3 inhibitor GB1107 (5 μM) for western blotting analysis of the level or phosphorylation of the indicated proteins. Each experiment was repeated three times with similar results. c HEK-293T cells were infected with lentiviruses carrying shGFP or shGal3, or HA-Vector or HA-Gal3 treated with or without GB1107 (5 μM) or Torin1 (250 nM), and starved of amino acids and glucose for 1 h followed by stimulation with LPS (1 μg/ml) for 5 h for western blotting analysis of the level or phosphorylation of the indicated proteins. Each experiment was repeated three times with similar results. d HEK-293T cells were transfected with the indicated plasmids, starved of amino acids and glucose for 1 h, and stimulated with LPS (1 μg/ml) for 5 h. Cellular lysates were immunoprecipitated with anti-FLAG followed by immunoblotting with antibodies against the indicated proteins. Each experiment was repeated three times with similar results.
Fig. 4
Fig. 4. Galectin-3 binds LPS to promote the activation of Rag GTPases and the targeting of mTOR to lysosomal surface.
a HEK-293T cells were stimulated with LPS (1 μg/ml) for 6 h followed by immunofluorescent staining for LPS (green) and Lamp2 (red) or galectin-3 (red). Scale bar: 10 μm. Each experiment was repeated three times with similar results. b In vitro purified RagA or RagC, p14 or p18, or galectin-3 was incubated with biotinylated LPS and mixed with streptavidin beads. The bound proteins were eluted for immunoblotting analysis with antibodies against the indicated proteins. Each experiment was repeated three times with similar results. c Prediction of the binding pose of LPS to galectin-3. d HEK-293T cells were transfected with FLAG-Gal3 or FLAG-metap2, starved of amino acids and glucose for 1 h, and stimulated with LPS (1 μg/ml) for 5 h. Cellular lysates were immunoprecipitated with anti-FLAG followed by immunoblotting with antibodies against the indicated proteins. Each experiment was repeated three times with similar results. e The Rag GTPases mutants with different nucleotide states. f HEK-293T cells were co-transfected with the indicated plasmids and treated with LPS (1 μg/ml) for 6 h. Cellular lysates were immunoprecipitated with anti-FLAG followed by immunoblotting with antibodies against the indicated proteins. Each experiment was repeated three times with similar results. g HEK-293T cells were co-transfected with the indicated plasmids and RagA or RagC with different nucleotide states treated with LPS (1 μg/ml) for 6 h. Cellular lysates were immunoprecipitated with anti-FLAG followed by immunoblotting with antibodies against the indicated proteins. Each experiment was repeated three times with similar results. h HEK-293T cells were infected with lentiviruses carrying shGFP or shGal3, starved of amino acids and glucose for 1 h, and stimulated with LPS (1 μg/ml) for 5 h followed by immunofluorescent staining for mTOR (green) and Lamp2 (red). Scale bar: 10 μm. Each experiment was repeated three times with similar results. i HEK-293T cells were treated with siRNAs targeting TSC2 or TSC2 plus galectin-3, starved of amino acid and glucose for 1 h, and stimulated with LPS (1 μg/ml) for 5 h for western blotting analysis of the level or phosphorylation of the indicated proteins. Each experiment was repeated three times with similar results.
Fig. 5
Fig. 5. Galectin-3 promotes glycolysis through activating the mTORC1 signaling.
a LGALS3 homologues in vertebrates and invertebrates. Amino-acid positions were colored in white to blue. b HEK-293T cells were treated with siGal3 or Torin1 (250 nM). Total RNAs were extracted for RNA-seq. The volcano plots delineate up- and down-regulated genes analyzed with P < 0.05 and absolute log 2 (fold change) > 1. P values attained by the two-sided Wald test are corrected for multiple testing using the Benjamini and Hochberg method, and shown as q values. c The Venn diagram depicts the genes cross-analyzed from the two sets of RNA-seq experiments. d qPCR measurement of the expression of the indicated genes selected from RNA-seq results in HEK-293T cells treated with siGal3 or Torin1 (250 nM). Each bar represents the mean ± SD for biological triplicate experiments. P values were calculated by two-tailed unpaired Student’s t test (**P < 0.01, ***P < 0.001). e HEK-293T cells were infected with lentiviruses carrying shGFP or shGal3, or HA-Vector or HA-Gal3 for western blotting analysis of the level of the indicated proteins. Each experiment was repeated three times with similar results. f HEK-293T cells were starved of amino acids and glucose for 1 h followed by stimulation with LPS (1 μg/ml) for 5 h in the presence or absence of Torin1 (250 nM) or GB1107 (5 μM) for western blotting analysis of the level of the indicated proteins. g HEK-293T cells deficient of galectin-3 were transfected with FLAG-Gal3 and stimulated with LPS in the presence or absence of GB1107 or Torin1 for the measurement of glucose uptake and lactate production. Each bar represents the mean ± SD for biological triplicate experiments. P values were calculated by one-way ANOVA (***P < 0.001). h Bioinformatics analysis of the public datasets of diabetes patient skeletal muscle samples and normal tissues. P value was calculated by two-tailed unpaired Student’s t test (**P < 0.01). Error bars represent 95% confidence intervals.
Fig. 6
Fig. 6. Galectin-3 is overexpressed in HCC to activate mTORC1 and promote glycolysis.
a Analysis of the expression of galectin-3 in different human tissues. b Analysis of the Cancer Genome Atlas datasets in Oncomine for the expression of galectin-3 between tumor and normal tissues. Each bar represents the mean ± SD for biological triplicate experiments. Data are presented with box plots (***P < 0.001, by unpaired, two-tailed Student’s t test). The minima, maxima, center of the box plots are defined as the 75%, 25% and 50% percentile, the whiskers are defined as the interquartile range times 1.5. c Analysis of the expression of galectin-3 in liver cancer samples and corresponding adjacent samples in TCGA HCC. Each bar represents the mean ± SD for biological triplicate experiments. Data are presented with box plots (***P < 0.001, two-sided Mann-Whitney U test). The minima, maxima, center of the box plots are defined as the 75%, 25% and 50% percentile, the whiskers are defined as the interquartile range times 1.5. d Analysis of the Human Pathology Atlas database for the expression of galectin-3 by immunohistochemistry in HCC samples. e HepG2 cells were transfected with FLAG-Gal3 or FLAG-metap2. Cellular lysates were immunoprecipitated with anti-FLAG followed by immunoblotting with antibodies against the indicated proteins. Each experiment was repeated three times with similar results. f HepG2 cells were infected with lentiviruses carrying shGFP or shGal3, or HA-Vector or HA-Gal3, starved of amino acids and glucose for 1 h, and stimulated with LPS (1 μg/ml) for 5 h for western blotting analysis of the level or phosphorylation of the indicated proteins. Each experiment was repeated three times with similar results. g HepG2 cells were infected with lentiviruses carrying shGFP or shGal3 for western blotting analysis of the level of the indicated proteins. Each experiment was repeated three times with similar results. h HepG2 cells were starved of amino acids and glucose for 1 h and stimulated with LPS (1 μg/ml) for 5 h in the presence or absence of Torin1 (250 nM) or GB1107 (5 μM) for western blotting analysis of the level or phosphorylation of the indicated proteins. Each experiment was repeated three times with similar results. i HepG2 cells were treated with LPS, LPS and siGal3, LPS and GB1107, or LPS and Torin1 to detect glucose uptake and lactate production. Each bar represents the mean ± SD for biological triplicate experiments. P values were calculated by one-way ANOVA (***P < 0.001).
Fig. 7
Fig. 7. Galectin-3 is implicated in hepatocarcinogenesis.
a CCK-8 assays for the proliferation of HepG2 cells were treated with LPS or LPS and GB1107, or infected with lentiviruses carrying shGFP or shGal3 and transfected with FLAG-metap2 or FLAG-RagAGTP/RagCGDP. Each bar represents the mean ± SD for biological triplicate experiments. P values were calculated by two-way ANOVA (***P < 0.001). b HepG2 cells were treated with LPS, LPS and Torin1, or LPS and GB1107, or infected with lentiviruses carrying shGFP or shGal3 and transfected with FLAG-RagAGTP/RagCGDP in the presence or absence of Torin1 and cultured for 10 days before staining with crystal violet for colony formation assays. Representative images from biological triplicate experiments are shown. c Kaplan–Meier analysis for the correlation between survival time and galectin-3 signatures in HCC. P values were calculated by log-rank test. d Transcriptomes of TCGA primary tumor samples and GTEX normal tissue samples obtained from UCSD Xena for correlation analysis of the expression between galectin-3 and HK2 or PKM. Spearman correlation coefficients and P values were calculated by two-sided permutation test. e Kaplan-Meier analysis for the correlation between survival time and the expression levels of galectin-3 and HK2 or galectin-3 and PKM in HCC. P values were calculated by log-rank test.

References

    1. Arthur CM, Baruffi MD, Cummings RD, Stowell SR. Evolving mechanistic insights into galectin functions. Methods Mol. Biol. 2015;1207:1–35. doi: 10.1007/978-1-4939-1396-1_1. - DOI - PMC - PubMed
    1. Byrd JC, Bresalier RS. Mucins and mucin binding proteins in colorectal cancer. Cancer Metastasis Rev. 2004;23:77–99. doi: 10.1023/A:1025815113599. - DOI - PubMed
    1. Zuberi RI, Frigeri LG, Liu FT. Activation of rat basophilic leukemia cells by epsilon BP, an IgE-binding endogenous lectin. Cell Immunol. 1994;156:1–12. doi: 10.1006/cimm.1994.1148. - DOI - PubMed
    1. Funasaka T, Raz A, Nangia-Makker P. Galectin-3 in angiogenesis and metastasis. Glycobiology. 2014;24:886–891. doi: 10.1093/glycob/cwu086. - DOI - PMC - PubMed
    1. Hughes RC. Galectins as modulators of cell adhesion. Biochimie. 2001;83:667–676. doi: 10.1016/S0300-9084(01)01289-5. - DOI - PubMed

Publication types

MeSH terms

Substances