

Whole genome sequencing identifies structural variants contributing to hematologic traits in the NHLBI TOPMed program
- PMID: 36481753
- PMCID: PMC9732337
- DOI: 10.1038/s41467-022-35354-7
Whole genome sequencing identifies structural variants contributing to hematologic traits in the NHLBI TOPMed program
Abstract
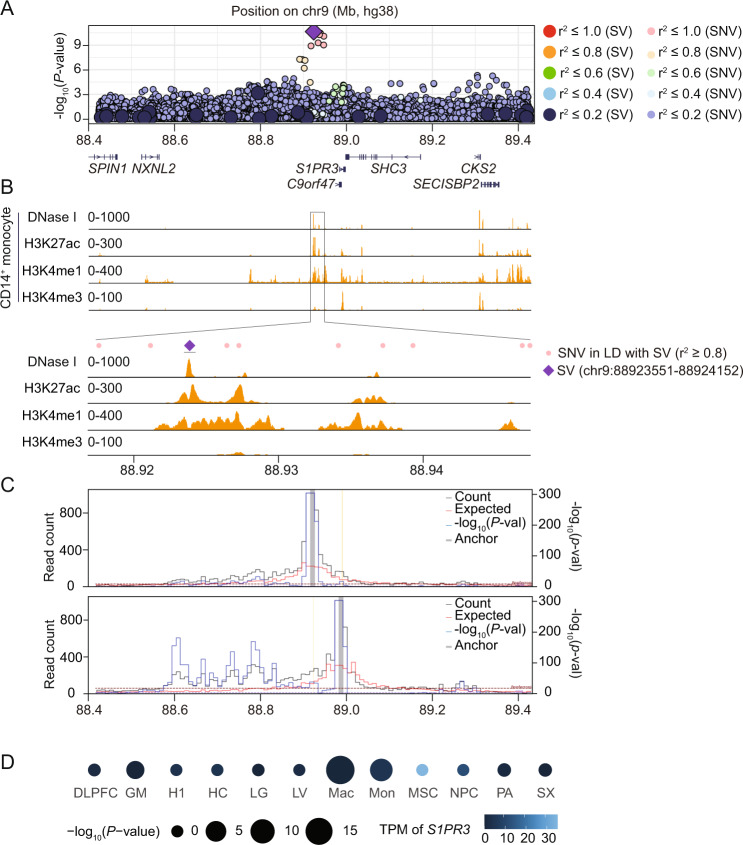
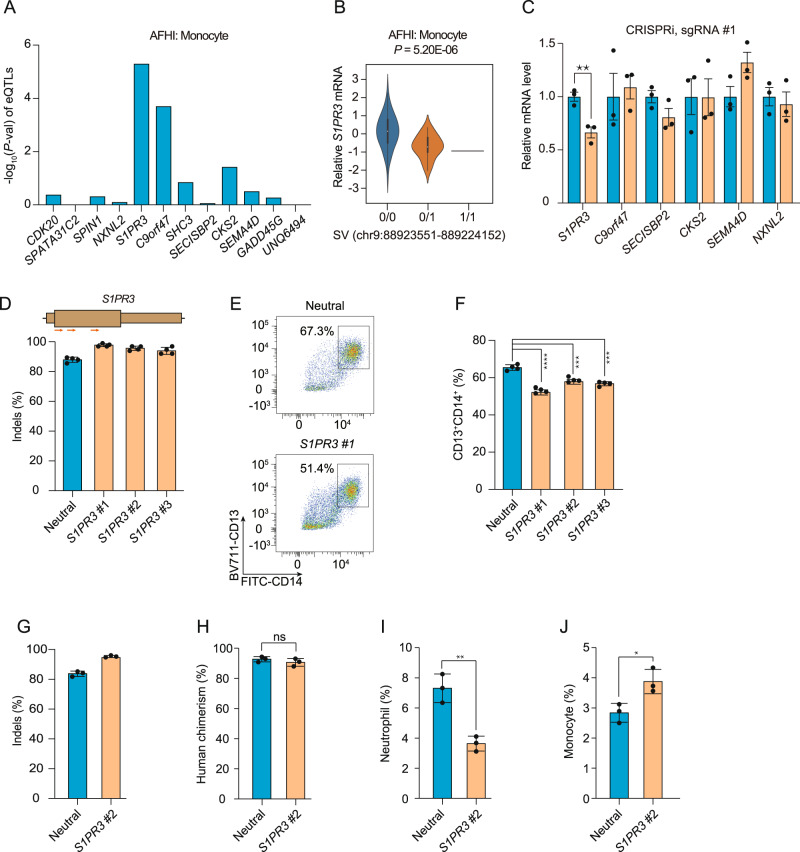
Genome-wide association studies have identified thousands of single nucleotide variants and small indels that contribute to variation in hematologic traits. While structural variants are known to cause rare blood or hematopoietic disorders, the genome-wide contribution of structural variants to quantitative blood cell trait variation is unknown. Here we utilized whole genome sequencing data in ancestrally diverse participants of the NHLBI Trans Omics for Precision Medicine program (N = 50,675) to detect structural variants associated with hematologic traits. Using single variant tests, we assessed the association of common and rare structural variants with red cell-, white cell-, and platelet-related quantitative traits and observed 21 independent signals (12 common and 9 rare) reaching genome-wide significance. The majority of these associations (N = 18) replicated in independent datasets. In genome-editing experiments, we provide evidence that a deletion associated with lower monocyte counts leads to disruption of an S1PR3 monocyte enhancer and decreased S1PR3 expression.
© 2022. The Author(s).
Conflict of interest statement
G.R.A. is an employee of Regeneron Pharmaceuticals; he owns stock and stock option for Regeneron Pharmaceuticals. L.M.R. is a consultant for the TOPMed Administrative Coordinating Center (through WeStat). The remaining authors declare no competing interests.
Figures
References
Publication types
MeSH terms
Substances
Grants and funding
- HHSN268201800003I/HL/NHLBI NIH HHS/United States
- U01 HG007417/HG/NHGRI NIH HHS/United States
- OT3 HL142478/HL/NHLBI NIH HHS/United States
- R01 HL112064/HL/NHLBI NIH HHS/United States
- 75N92020D00002/HL/NHLBI NIH HHS/United States
- HHSN268201300005C/HL/NHLBI NIH HHS/United States
- N01 HC085080/HL/NHLBI NIH HHS/United States
- R01 HL150553/HL/NHLBI NIH HHS/United States
- 75N92021D00002/HL/NHLBI NIH HHS/United States
- HHSN268201500003C/HL/NHLBI NIH HHS/United States
- HHSN268201300004C/HL/NHLBI NIH HHS/United States
- 75N92020D00005/HL/NHLBI NIH HHS/United States
- R01 HL130733/HL/NHLBI NIH HHS/United States
- N01 HC095161/HL/NHLBI NIH HHS/United States
- N01 HC095168/HL/NHLBI NIH HHS/United States
- R01 HL120393/HL/NHLBI NIH HHS/United States
- R01 HL087698/HL/NHLBI NIH HHS/United States
- U54 HG003067/HG/NHGRI NIH HHS/United States
- 75N92021D00005/WH/WHI NIH HHS/United States
- R01 HL121007/HL/NHLBI NIH HHS/United States
- HHSN268201300001C/HL/NHLBI NIH HHS/United States
- HHSN268201300003I/HL/NHLBI NIH HHS/United States
- HHSN268201800004I/HL/NHLBI NIH HHS/United States
- U01 HL080295/HL/NHLBI NIH HHS/United States
- HHSN268201500001C/HL/NHLBI NIH HHS/United States
- UL1 TR001079/TR/NCATS NIH HHS/United States
- DP2 HL137300/HL/NHLBI NIH HHS/United States
- N01 HC095169/HL/NHLBI NIH HHS/United States
- N01 HC085082/HL/NHLBI NIH HHS/United States
- N01 HC065233/HL/NHLBI NIH HHS/United States
- R01 HL092577/HL/NHLBI NIH HHS/United States
- T32 ES007018/ES/NIEHS NIH HHS/United States
- N01 HC065236/HL/NHLBI NIH HHS/United States
- R01 HL059367/HL/NHLBI NIH HHS/United States
- U01 HL130114/HL/NHLBI NIH HHS/United States
- N01 HC065235/HL/NHLBI NIH HHS/United States
- HHSN268200800007C/HL/NHLBI NIH HHS/United States
- N01 HC085086/HL/NHLBI NIH HHS/United States
- 75N92020D00001/HL/NHLBI NIH HHS/United States
- N01 HC085083/HL/NHLBI NIH HHS/United States
- U01 HL120393/HL/NHLBI NIH HHS/United States
- U01 HL089897/HL/NHLBI NIH HHS/United States
- R01 HL129132/HL/NHLBI NIH HHS/United States
- HHSN268201300048C/HL/NHLBI NIH HHS/United States
- N01 HC095167/HL/NHLBI NIH HHS/United States
- OT3 HL142481/HL/NHLBI NIH HHS/United States
- U54 HG003273/HG/NHGRI NIH HHS/United States
- N01 HC095159/HL/NHLBI NIH HHS/United States
- OT3 HL147154/HL/NHLBI NIH HHS/United States
- 75N92020D00003/HL/NHLBI NIH HHS/United States
- R01 HL105756/HL/NHLBI NIH HHS/United States
- 75N92021D00001/HL/NHLBI NIH HHS/United States
- U01 HL089856/HL/NHLBI NIH HHS/United States
- P30 DK063491/DK/NIDDK NIH HHS/United States
- HHSN268201800007I/HL/NHLBI NIH HHS/United States
- HHSN268201300049C/HL/NHLBI NIH HHS/United States
- N01 HC065234/HL/NHLBI NIH HHS/United States
- HHSN268201700002C/HL/NHLBI NIH HHS/United States
- HHSN268201200036C/HL/NHLBI NIH HHS/United States
- HHSN268201800001C/HL/NHLBI NIH HHS/United States
- HHSN268201700001I/HL/NHLBI NIH HHS/United States
- N01 HC025195/HL/NHLBI NIH HHS/United States
- U01 HG011720/HG/NHGRI NIH HHS/United States
- HHSN268201500015C/HL/NHLBI NIH HHS/United States
- N01 HC055222/HL/NHLBI NIH HHS/United States
- U54 DK110805/DK/NIDDK NIH HHS/United States
- HHSN268201700004I/HL/NHLBI NIH HHS/United States
- HHSN268201500001I/HL/NHLBI NIH HHS/United States
- 75N92021D00003/WH/WHI NIH HHS/United States
- M01 RR000052/RR/NCRR NIH HHS/United States
- N01 HC085079/HL/NHLBI NIH HHS/United States
- HHSN268201300047C/HL/NHLBI NIH HHS/United States
- UL1 TR001420/TR/NCATS NIH HHS/United States
- 75N92020D00004/HL/NHLBI NIH HHS/United States
- HHSN268201300050C/HL/NHLBI NIH HHS/United States
- U01 HL072515/HL/NHLBI NIH HHS/United States
- OT3 HL142480/HL/NHLBI NIH HHS/United States
- N01 HC095163/HL/NHLBI NIH HHS/United States
- 75N92020D00007/HL/NHLBI NIH HHS/United States
- U01 HL072518/HL/NHLBI NIH HHS/United States
- HHSN268201300003C/HG/NHGRI NIH HHS/United States
- HHSN268201500014C/HL/NHLBI NIH HHS/United States
- R01 HL146500/HL/NHLBI NIH HHS/United States
- HHSN268201500003I/HL/NHLBI NIH HHS/United States
- 75N92021D00006/HL/NHLBI NIH HHS/United States
- HHSN268201700005C/HL/NHLBI NIH HHS/United States
- HHSN268201700001C/HL/NHLBI NIH HHS/United States
- R01 HL165061/HL/NHLBI NIH HHS/United States
- HHSN268201700003C/HL/NHLBI NIH HHS/United States
- 75N92019D00031/HL/NHLBI NIH HHS/United States
- OT3 HL142479/HL/NHLBI NIH HHS/United States
- HHSN268201700004C/HL/NHLBI NIH HHS/United States
- UL1 TR000040/TR/NCATS NIH HHS/United States
- HHSN268201300046C/HL/NHLBI NIH HHS/United States
- N01 HC095166/HL/NHLBI NIH HHS/United States
- HHSN268201700002I/HL/NHLBI NIH HHS/United States
- HHSN268201700005I/HL/NHLBI NIH HHS/United States
- UM1 HG008898/HG/NHGRI NIH HHS/United States
- 75N92020D00006/HL/NHLBI NIH HHS/United States
- R01 AG023629/AG/NIA NIH HHS/United States
- R01 HL117626/HL/NHLBI NIH HHS/United States
- N01 HC095162/HL/NHLBI NIH HHS/United States
- UL1 TR001881/TR/NCATS NIH HHS/United States
- HHSN268201800005I/HL/NHLBI NIH HHS/United States
- U24 HG008956/HG/NHGRI NIH HHS/United States
- N01 HC095165/HL/NHLBI NIH HHS/United States
- N01 HC095164/HL/NHLBI NIH HHS/United States
- N01 HC065237/HL/NHLBI NIH HHS/United States
- HHSN268201700003I/HL/NHLBI NIH HHS/United States
- HHSN268201800006I/HL/NHLBI NIH HHS/United States
- R01 AG018728/AG/NIA NIH HHS/United States
- 75N92021D00004/WH/WHI NIH HHS/United States
- N01 HC085081/HL/NHLBI NIH HHS/United States
- U54 DK106829/DK/NIDDK NIH HHS/United States
- R01 HL154385/HL/NHLBI NIH HHS/United States
- N01 HC095160/HL/NHLBI NIH HHS/United States
LinkOut - more resources
Full Text Sources
Research Materials
