A genetically informed Registered Report on adverse childhood experiences and mental health
- PMID: 36482079
- PMCID: PMC7614239
- DOI: 10.1038/s41562-022-01482-9
A genetically informed Registered Report on adverse childhood experiences and mental health
Abstract
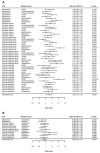
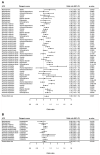
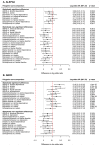
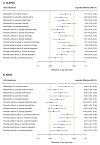
Children who experience adversities have an elevated risk of mental health problems. However, the extent to which adverse childhood experiences (ACEs) cause mental health problems remains unclear, as previous associations may partly reflect genetic confounding. In this Registered Report, we used DNA from 11,407 children from the United Kingdom and the United States to investigate gene-environment correlations and genetic confounding of the associations between ACEs and mental health. Regarding gene-environment correlations, children with higher polygenic scores for mental health problems had a small increase in odds of ACEs. Regarding genetic confounding, elevated risk of mental health problems in children exposed to ACEs was at least partially due to pre-existing genetic risk. However, some ACEs (such as childhood maltreatment and parental mental illness) remained associated with mental health problems independent of genetic confounding. These findings suggest that interventions addressing heritable psychiatric vulnerabilities in children exposed to ACEs may help reduce their risk of mental health problems.
© 2022. The Author(s), under exclusive licence to Springer Nature Limited.
Conflict of interest statement
The authors declare no competing interests.
Figures


References
-
- Chapman DP, et al. Adverse childhood experiences and the risk of depressive disorders in adulthood. J Affect Disord. 2004;82:217–225. - PubMed
-
- Hughes K, et al. The effect of multiple adverse childhood experiences on health: a systematic review and meta-analysis. Lancet Public Health. 2017;2:e356–e366. - PubMed
-
- Felitti VJ, et al. Relationship of childhood abuse and household dysfunction to many of the leading causes of death in adults: The Adverse Childhood Experiences (ACE) Study. Am J Prev Med. 1998;14:245–258. - PubMed
Publication types
MeSH terms
Grants and funding
- U24 DA041147/DA/NIDA NIH HHS/United States
- U01 DA041120/DA/NIDA NIH HHS/United States
- P005918/MRC_/Medical Research Council/United Kingdom
- U01 DA041093/DA/NIDA NIH HHS/United States
- MC_UU_00011/7/MRC_/Medical Research Council/United Kingdom
- U24 DA041123/DA/NIDA NIH HHS/United States
- 218641/WT_/Wellcome Trust/United Kingdom
- U01 DA051016/DA/NIDA NIH HHS/United States
- MR/M020894/1/MRC_/Medical Research Council/United Kingdom
- U01 DA041106/DA/NIDA NIH HHS/United States
- U01 DA041117/DA/NIDA NIH HHS/United States
- U01 DA041148/DA/NIDA NIH HHS/United States
- MC_UU_00011/5/MRC_/Medical Research Council/United Kingdom
- MRF-160-0002-ELP-PINGA/MRF_/MRF_/United Kingdom
- U01 DA051039/DA/NIDA NIH HHS/United States
- MC_PC_19009/MRC_/Medical Research Council/United Kingdom
- MC_UU_00032/4/MRC_/Medical Research Council/United Kingdom
- U01 DA051018/DA/NIDA NIH HHS/United States
- 218641/Z/19/Z/WT_/Wellcome Trust/United Kingdom
- U01 DA051038/DA/NIDA NIH HHS/United States
- 215917/WT_/Wellcome Trust/United Kingdom
- U01 DA041134/DA/NIDA NIH HHS/United States
- U01 DA041022/DA/NIDA NIH HHS/United States
- U01 DA041156/DA/NIDA NIH HHS/United States
- U01 DA050987/DA/NIDA NIH HHS/United States
- U01 DA051037/DA/NIDA NIH HHS/United States
- MC_PC_15018/MRC_/Medical Research Council/United Kingdom
- U01 DA041025/DA/NIDA NIH HHS/United States
- U01 DA050989/DA/NIDA NIH HHS/United States
- U01 DA041089/DA/NIDA NIH HHS/United States
- U01 DA050988/DA/NIDA NIH HHS/United States
- U01 DA041028/DA/NIDA NIH HHS/United States
- U01 DA041048/DA/NIDA NIH HHS/United States
- U01 DA041174/DA/NIDA NIH HHS/United States
- G9815508/MRC_/Medical Research Council/United Kingdom
- 215917/Z/19/Z/WT_/Wellcome Trust/United Kingdom
LinkOut - more resources
Full Text Sources
Medical

