. 2022 Dec;28(12):2521-2529.
doi: 10.1038/s41591-022-02100-x. Epub 2022 Dec 8.

Association of wearable device-measured vigorous intermittent lifestyle physical activity with mortality

Affiliations

Association of wearable device-measured vigorous intermittent lifestyle physical activity with mortality

Emmanuel Stamatakis et al. Nat Med. 2022 Dec.

Abstract

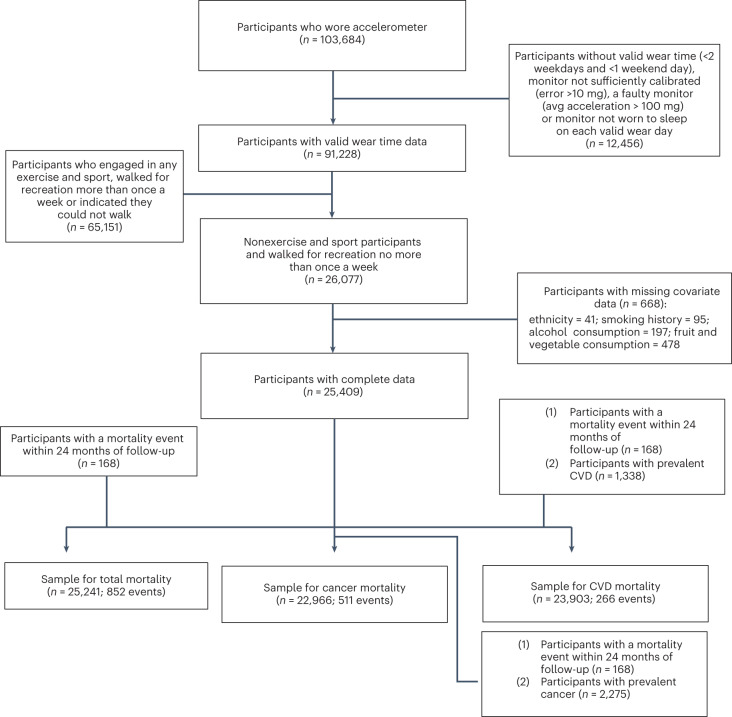
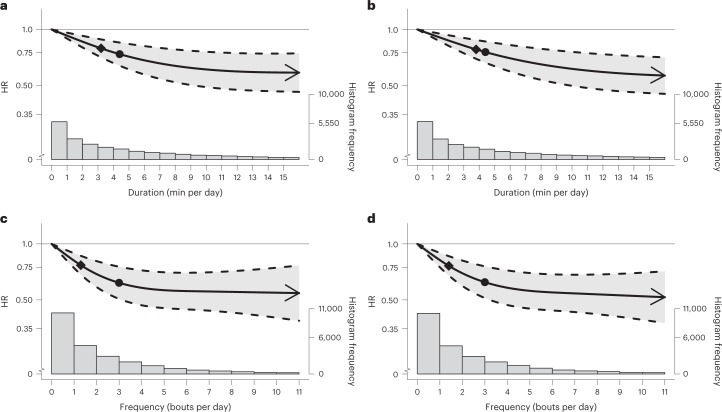
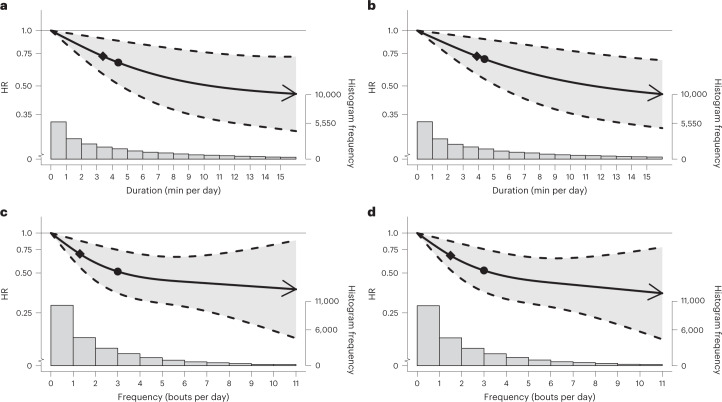
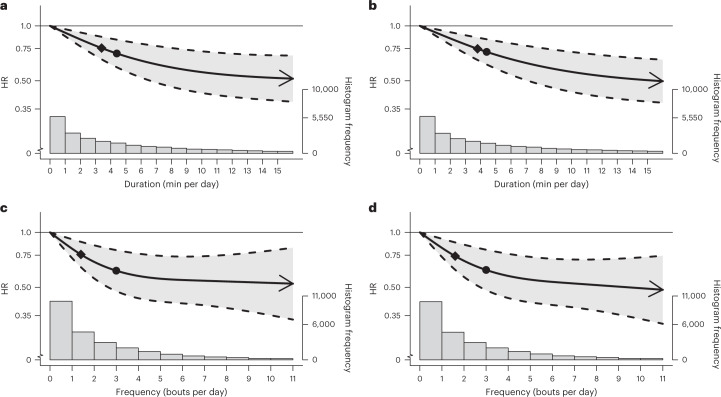
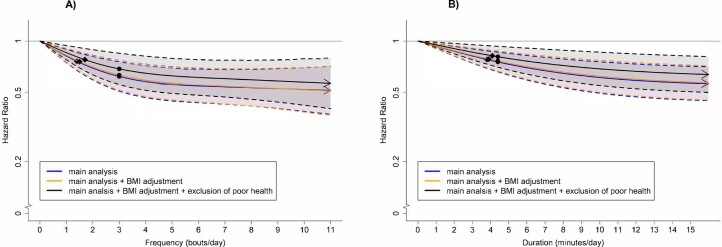
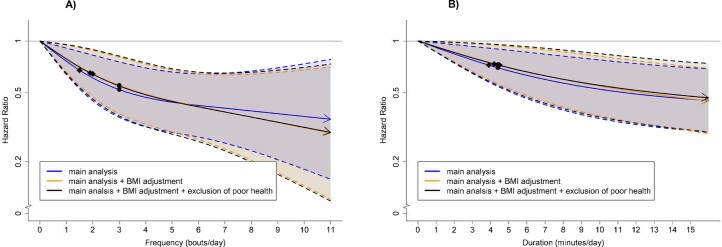
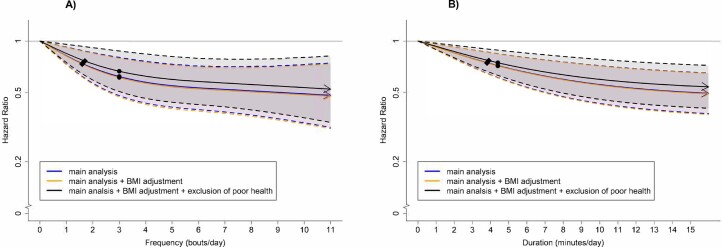
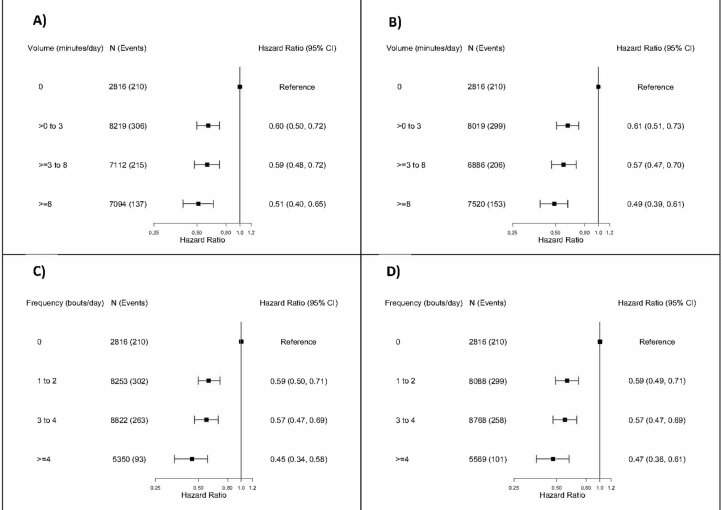
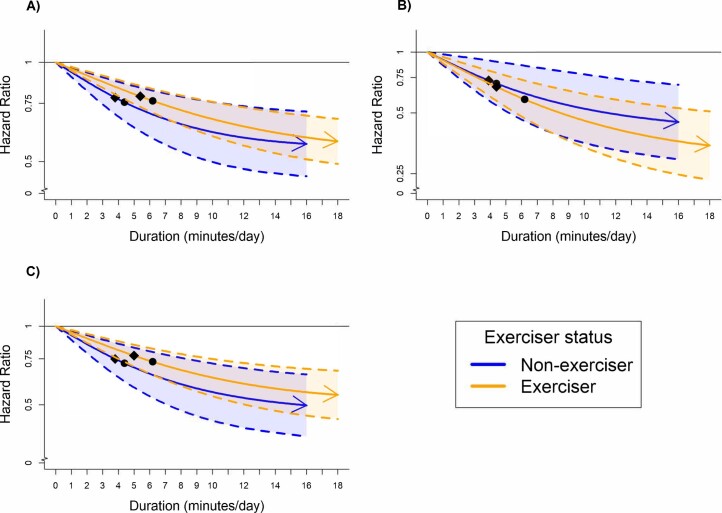
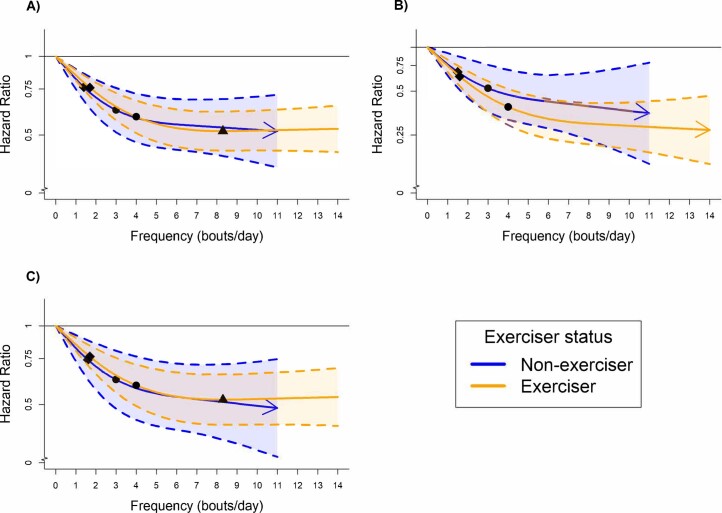
Wearable devices can capture unexplored movement patterns such as brief bursts of vigorous intermittent lifestyle physical activity (VILPA) that is embedded into everyday life, rather than being done as leisure time exercise. Here, we examined the association of VILPA with all-cause, cardiovascular disease (CVD) and cancer mortality in 25,241 nonexercisers (mean age 61.8 years, 14,178 women/11,063 men) in the UK Biobank. Over an average follow-up of 6.9 years, during which 852 deaths occurred, VILPA was inversely associated with all three of these outcomes in a near-linear fashion. Compared with participants who engaged in no VILPA, participants who engaged in VILPA at the sample median VILPA frequency of 3 length-standardized bouts per day (lasting 1 or 2 min each) showed a 38%-40% reduction in all-cause and cancer mortality risk and a 48%-49% reduction in CVD mortality risk. Moreover, the sample median VILPA duration of 4.4 min per day was associated with a 26%-30% reduction in all-cause and cancer mortality risk and a 32%-34% reduction in CVD mortality risk. We obtained similar results when repeating the above analyses for vigorous physical activity (VPA) in 62,344 UK Biobank participants who exercised (1,552 deaths, 35,290 women/27,054 men). These results indicate that small amounts of vigorous nonexercise physical activity are associated with substantially lower mortality. VILPA in nonexercisers appears to elicit similar effects to VPA in exercisers, suggesting that VILPA may be a suitable physical activity target, especially in people not able or willing to exercise.


Conflict of interest statement

The authors do not have any competing interests to declare.

Figures

Fig. 1
Fig. 1. Flow diagram of non-exercisers.
Flow diagram of UK Biobank participants for the dose–response analyses of VILPA.
Fig. 2
Fig. 2. Association of the daily duration and frequency of VILPA with all-cause mortality.
a,b, Dose–response curves showing all-cause mortality HR associated with increasing daily duration of VILPA, for bouts of VILPA up to 1 min (a) and 2 min (b) in duration. c,d, Dose–response curves showing all-cause mortality HR associated with increasing daily frequency of VILPA, for length-standardized bouts of VILPA 1 min (c) and 2 min (d) in duration. Data are shown for n = 25,241 participants with 852 events and with a mean follow-up of 6.9 (0.8) years. Diamond, minimal dose, as indicated by the ED50 statistic which estimates the daily duration/frequency of VILPA associated with 50% of optimal risk reduction. Circle, HR associated with the median VILPA value (see Supplementary Table 4 for the list of values). Data are adjusted for the covariates listed in the online Methods. The shaded region demarcated by dashed lines represents the 95% CI. The solid line that lies within the shaded region represents the HR. The arrowhead represents the absence of an observed inflection point (for example, larger risk reduction with higher amounts of VILPA). The histogram on the right shows the sample distribution.
Fig. 3
Fig. 3. Association of the daily duration and frequency of VILPA with CVD mortality.
a,b, Dose–response curves showing CVD mortality HRs associated with increasing daily duration of VILPA, for bouts of VILPA up to 1 min (a) and 2 min (b) in duration. c,d, Dose–response curves showing CVD mortality HRs associated with increasing daily frequency of VILPA, for length-standardized bouts of VILPA1 min (c) and 2 min (d) in duration. Data are shown for n = 23,903 participants with 266 events and with a mean follow-up of 6.9 (0.8) years. Diamond, minimal dose, as indicated by the ED50 statistic which estimates the daily duration/frequency of VILPA associated with 50% of optimal risk reduction. Circle, HR associated with the median VILPA value (see Supplementary Table 4 for the list of values). Data are adjusted for the covariates listed in the online Methods. The shaded region demarcated by dashed lines represents the 95% CI. The solid line that lies within the shaded region represents the HR. The arrowhead represents the absence of an observed inflection point (for example, larger risk reduction with higher amounts of VILPA). The histogram on the right shows the sample distribution.
Fig. 4
Fig. 4. Association of the daily duration and frequency of VILPA with cancer mortality.
a,b, Dose–response curves showing cancer mortality HRs associated with increasing daily duration of VILPA, for bouts of VILPA up to 1 min (a) and 2 min (b) in duration. c,d, Dose–response curves showing cancer mortality HRs associated with increasing daily frequency of VILPA, for length-standardized bouts of VILPA 1 min (c) and 2 min (d) in duration. Data are shown for n = 22,966 participants with 511 events and with a mean follow-up of 6.9 (0.8) years. Diamond, minimal dose, as indicated by the ED50 statistic which estimates the daily duration/frequency of VILPA associated with 50% of optimal risk reduction. Circle, HR associated with the median VILPA value (see Supplementary Table 4 for the list of values). Data are adjusted for the covariates listed in the online Methods. The shaded region demarcated by dashed lines represents the 95% CI. The solid line that lies within the shaded region represents the HR. The arrowhead represents the absence of an observed inflection point (for example, larger risk reduction with higher amounts of VILPA). The histogram on the right shows the sample distribution.
Extended Data Fig. 1
Extended Data Fig. 1. All-cause mortality dose-response of VILPA frequency and duration with adjustment for body mass index and exclusion of poor health.
Frequency of length-standardized VILPA bouts up to 2 minutes (A) and Duration of VILPA from bouts up to 2 minutes (B). Diamond: the minimal dose, as indicated by the ED50 statistic which estimates the daily duration/frequency of VILPA associated with 50% of optimal risk reduction. Circle: the hazard ratio associated with the median VILPA value. Analyses adjusted for age, sex, duration of light intensity physical activity, duration of moderate intensity physical activity, smoking history, alcohol consumption, accelerometer estimated sleep duration, fruit and vegetable consumption, education, self-reported parental history of cardiovascular disease and cancer, and self-reported medication use (cholesterol, blood pressure, and diabetes), and prevalent cancer and CVD. All analyses were additionally adjusted for vigorous physical activity bouts (VILPA frequency analyses) or vigorous physical activity duration (VILPA duration analyses) coming from bouts lasting more than two minutes. Models are sequentially adjusted for: (1) body mass index; (2) exclusion of participants who were underweight (<18.5 kg/m2 or self-reported poor health). See Online Methods for further details on the statistical methodology. Shaded region with dashed lines represents 95%CI. Solid line represents point estimate. Arrow represents no inflection point.
Extended Data Fig. 2
Extended Data Fig. 2. Cardiovascular disease mortality dose-response of VILPA frequency and duration with adjustment for body mass index and exclusion of poor health.
Frequency of length-standardized VILPA bouts up to 2 minutes (A) and Duration of VILPA from bouts up to 2 minutes (B). Diamond: the minimal dose, as indicated by the ED50 statistic which estimates the daily duration/frequency of VILPA associated with 50% of optimal risk reduction. Circle: the hazard ratio associated with the median VILPA value. Analyses adjusted for age, sex, duration of light intensity physical activity, duration of moderate intensity physical activity, smoking history, alcohol consumption, accelerometer estimated sleep duration, fruit and vegetable consumption, education, self-reported parental history of cardiovascular disease and cancer, and self-reported medication use (cholesterol, blood pressure, and diabetes). All analyses were additionally adjusted for vigorous physical activity bouts (VILPA frequency analyses) or vigorous physical activity duration (VILPA duration analyses) coming from bouts lasting more than two minutes. Models are sequentially adjusted for: (1) body mass index; (2) exclusion of participants who were underweight (<18.5 kg/m2 or self-reported poor health). See Online Methods for further details on the statistical methodology. Shaded region with dashed lines represents 95%CI. Solid line represents point estimate. Arrow represents no inflection point.
Extended Data Fig. 3
Extended Data Fig. 3. Cancer mortality dose-response of VILPA duration and frequency with adjustment for body mass index and exclusion of poor health.
Frequency of length-standardized VILPA bouts up to 2 minutes (A) and Duration of VILPA from bouts up to 2 minutes (B). Diamond: the minimal dose, as indicated by the ED50 statistic which estimates the daily duration/frequency of VILPA associated with 50% of optimal risk reduction. Circle: the hazard ratio associated with the median VILPA value. Analyses adjusted for age, sex, duration of light intensity physical activity, duration of moderate intensity physical activity, smoking history, alcohol consumption, accelerometer estimated sleep duration, fruit and vegetable consumption, education, self-reported parental history of cardiovascular disease and cancer, and self-reported medication use (cholesterol, blood pressure, and diabetes). All analyses were additionally adjusted for vigorous physical activity bouts (VILPA frequency analyses) or vigorous physical activity duration (VILPA duration analyses) coming from bouts lasting more than two minutes. Models were sequentially adjusted for: (1) body mass index; (2) exclusion of participants who were underweight (<18.5 kg/m2 or self-reported poor health). See Online Methods for further details on the statistical methodology. Shaded region with dashed lines represents 95%CI. Solid line represents point estimate. Arrow represents no inflection point.
Extended Data Fig. 4
Extended Data Fig. 4. Dose-response association of categorised Vigorous Intermittent Lifestyle Physical Activity (VILPA) duration quarters with all-cause mortality (n = 25,241).
Duration of VILPA bout up to 1 minute (A); Duration of VILPA bouts up to 2 minutes (B); Frequency of length-standardized VILPA bouts up to 1 minute (C); and Frequency of length-standardized VILPA bouts up to 2 minutes (D). Participants with no VILPA were the reference category. The remaining categories are based on VILPA tertiles. Analyses adjusted for age, sex, duration of light intensity physical activity, duration of moderate intensity physical activity, smoking history, alcohol consumption, accelerometer estimated sleep duration, fruit and vegetable consumption, education, self-reported parental history of cardiovascular disease and cancer, and self-reported medication use (cholesterol, blood pressure, and diabetes), and prevalent cancer and CVD. All analyses were additionally adjusted for vigorous physical activity duration/bouts lasting more than one/two minutes, as appropriate. See Online Methods for further details on the statistical methodology. Sample size = 25,241; events = 868. Error bars represent 95% CI.
Extended Data Fig. 5
Extended Data Fig. 5. Comparison of the dose-response associations of daily duration of vigorous intermittent lifestyle physical activity (non-exercisers) and context-agnostic (that is exercise or non-exercise) vigorous physical activity (exercisers) with mortality (bouts up to 2 minutes).
All-cause mortality (A); cardiovascular disease mortality (B); and cancer mortality (C). Exercisers, n = 62,344 were included in the all-cause mortality (1,552 events), n = 56,810 in the CVD mortality (303 events) and n = 56,397 in the cancer mortality analyses (736 events). Non-exercisers n = 25,241 were included in the all-cause mortality analyses (852 events), were included in the all-cause mortality, n = 23,903 in the CVD mortality analyses (266 events), n = 22,966 in the cancer mortality analyses (511 events). Diamond: the minimal dose, as indicated by the ED50 statistic which estimates the daily duration/frequency of VILPA associated with 50% of optimal risk reduction. Circle: the hazard ratio associated with the median VILPA value. See Supplementary Tables 4 (nonexercisers) and 6 (exercisers) for the list of values. Analyses adjusted for age, sex, duration of light intensity physical activity, duration of moderate intensity physical activity, smoking history, alcohol consumption, accelerometer estimated sleep duration, fruit and vegetable consumption, education, self-reported parental history of cardiovascular disease and cancer, and self-reported medication use (cholesterol, blood pressure, and diabetes), and prevalent cancer and CVD (for all-cause mortality). All analyses were additionally adjusted for vigorous physical activity frequency of bouts lasting more than two minutes. See Online Methods for further details on the statistical methodology. Shaded region with dashed lines represents 95%CI. Solid line represents point estimate. Arrow represents no inflection point.
Extended Data Fig. 6
Extended Data Fig. 6. Comparison of the dose-response associations of daily frequency of vigorous intermittent lifestyle physical activity (non-exercisers) and context-agnostic (that is exercise or non-exercise) vigorous physical activity (exercisers) with mortality (length-standardized bouts up to 2 minutes).
All-cause mortality (A); cardiovascular disease mortality (B); and cancer mortality (C). Exercisers, n = 62,344 were included in the all-cause mortality (1,552 events), n = 56,810 in the CVD mortality (303 events) and n = 56,397 in the cancer mortality analyses (736 events). Non-exercisers n = 25,241 were included in the all-cause mortality analyses (852 events), were included in the all-cause mortality, n = 23,903 in the CVD mortality analyses (266 events), n = 22,966 in the cancer mortality analyses (511 events). Diamond: the minimal dose, as indicated by the ED50 statistic which estimates the daily duration/frequency of VILPA associated with 50% of optimal risk reduction. Circle: the hazard ratio associated with the median VILPA value. See Supplementary Tables 4 (nonexercisers) and 6 (exercisers) for the list of values. Triangle: optimal dose value defined as the nadir of the curve. Analyses adjusted for age, sex, duration of light intensity physical activity, duration of moderate intensity physical activity, smoking history, alcohol consumption, accelerometer estimated sleep duration, fruit and vegetable consumption, education, self-reported parental history of cardiovascular disease and cancer, and self-reported medication use (cholesterol, blood pressure, and diabetes), and prevalent cancer and CVD (for all-cause mortality). All analyses were additionally adjusted for vigorous physical activity bouts lasting more than two minutes. See Online Methods for further details on the statistical methodology. Shaded region with dashed lines represents 95%CI. Solid line represents point estimate. Arrow represents no inflection point.

Comment in

References

    1. Kraus WE, et al. Physical activity, all-cause and cardiovascular mortality, and cardiovascular disease. Med. Sci. Sports Exerc. 2019;51:1270–1281. doi: 10.1249/MSS.0000000000001939. - DOI - PMC - PubMed
    1. Rezende LFMD, et al. Physical activity and cancer: an umbrella review of the literature including 22 major anatomical sites and 770 000 cancer cases. Br. J. Sports Med. 2018;52:826–833. doi: 10.1136/bjsports-2017-098391. - DOI - PubMed
    1. Moore SC, et al. Association of leisure-time physical activity with risk of 26 types of cancer in 1.44 million adults. JAMA Intern. Med. 2016;176:816–825. doi: 10.1001/jamainternmed.2016.1548. - DOI - PMC - PubMed
    1. Bull FC, et al. World Health Organization 2020 guidelines on physical activity and sedentary behaviour. Br. J. Sports Med. 2020;54:1451–1462. doi: 10.1136/bjsports-2020-102955. - DOI - PMC - PubMed
    1. Piercy KL, et al. The physical activity guidelines for Americans. JAMA. 2018;320:2020–2028. doi: 10.1001/jama.2018.14854. - DOI - PMC - PubMed

Publication types