. 2022 Dec;4(12):1674-1683.
doi: 10.1038/s42255-022-00697-4. Epub 2022 Dec 8.

COVID-19 instigates adipose browning and atrophy through VEGF in small mammals

Affiliations

COVID-19 instigates adipose browning and atrophy through VEGF in small mammals

Xu Jing et al. Nat Metab. 2022 Dec.

Abstract

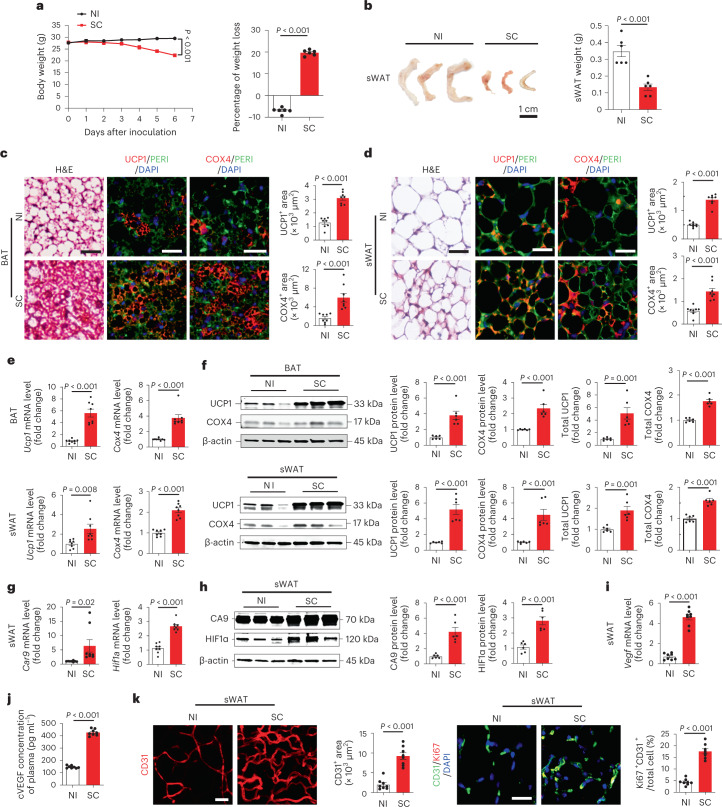
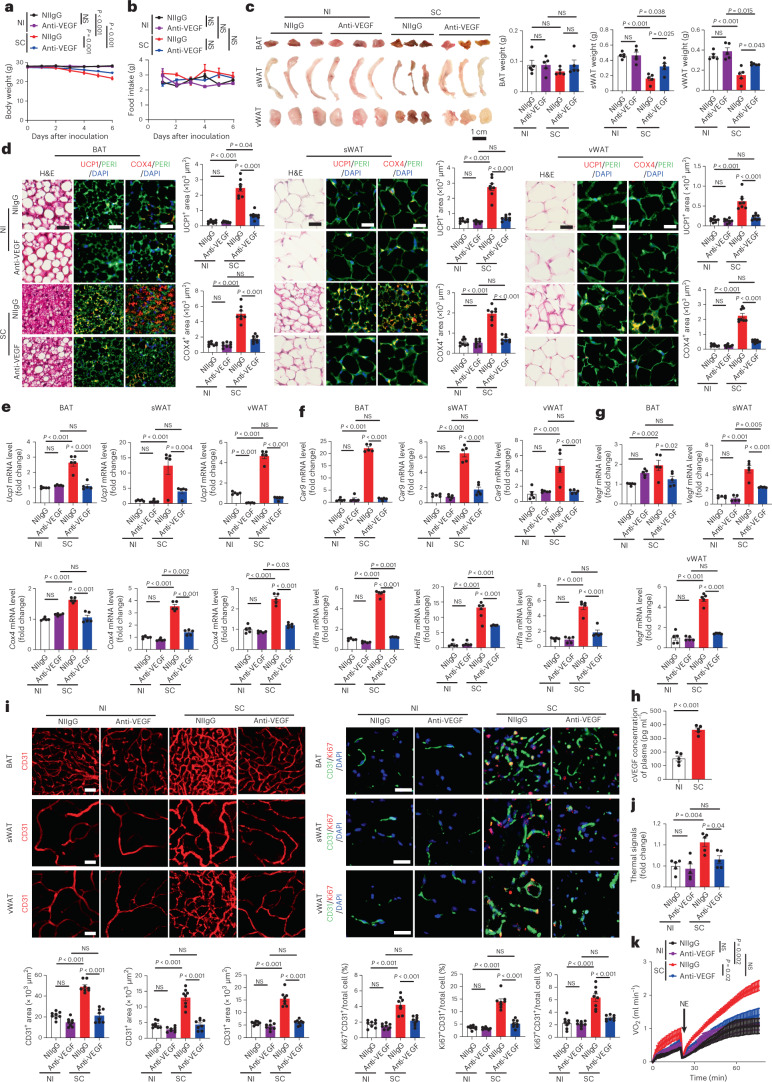
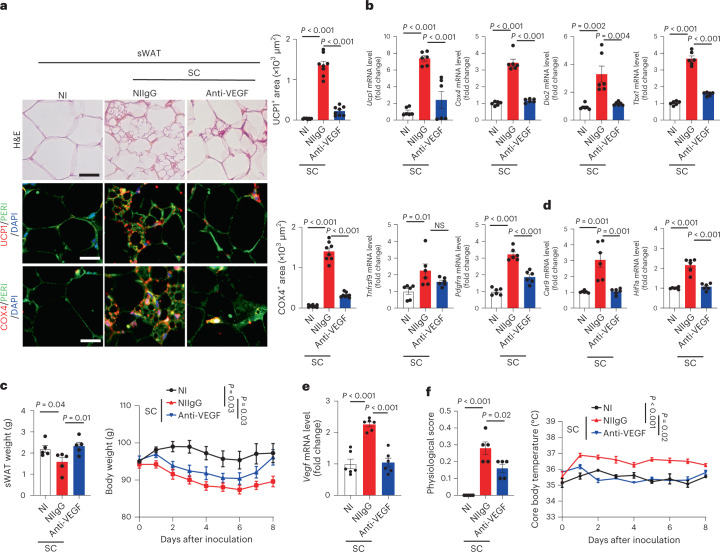
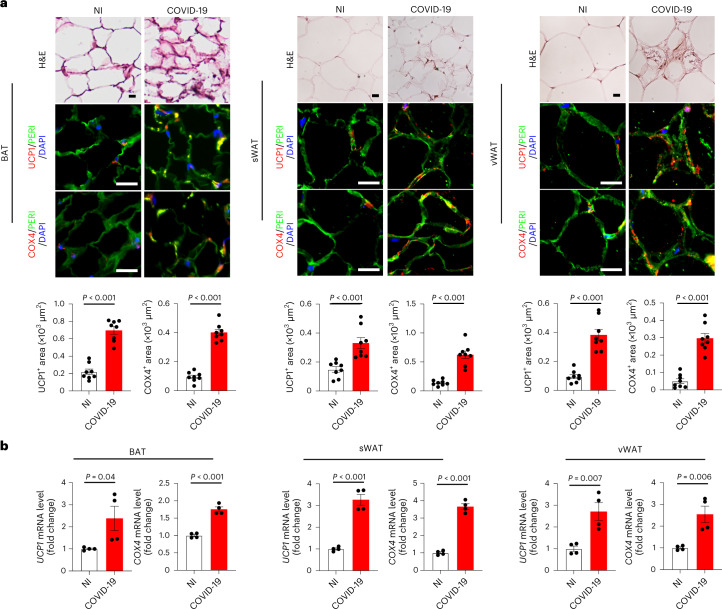
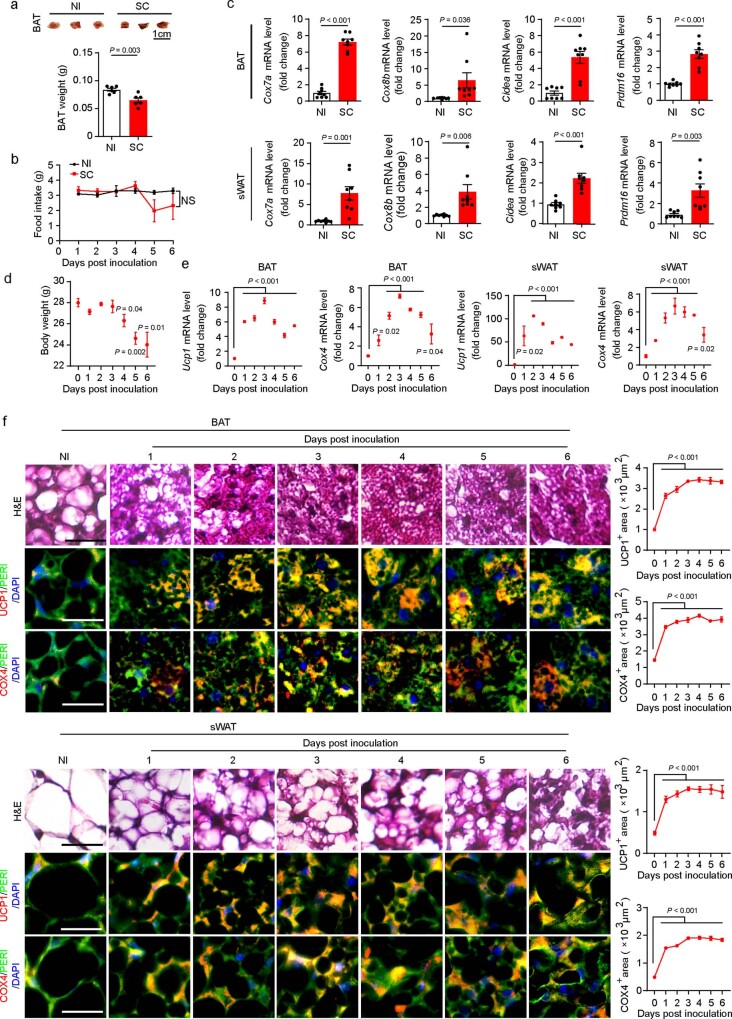
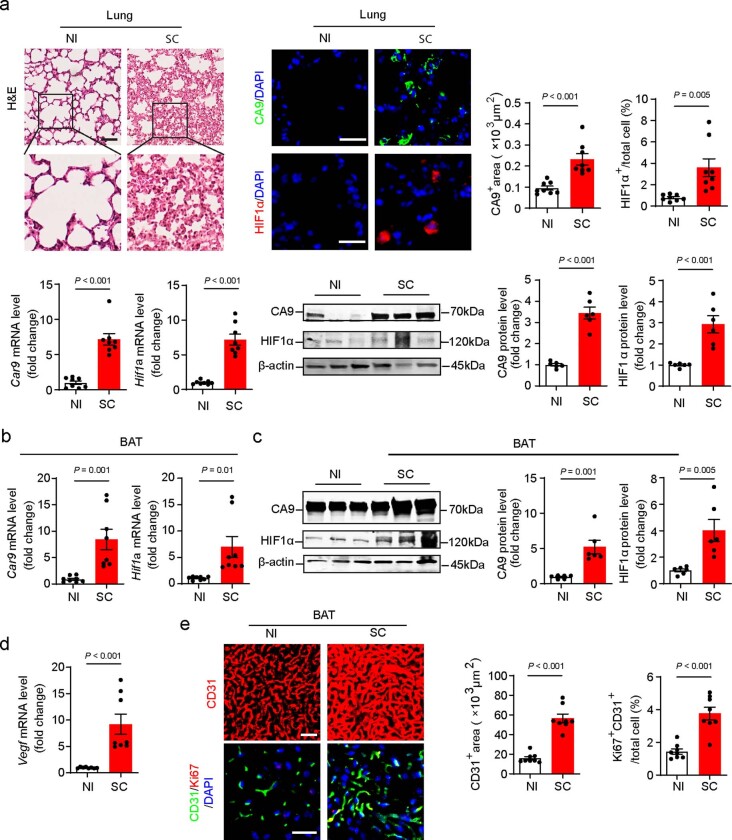
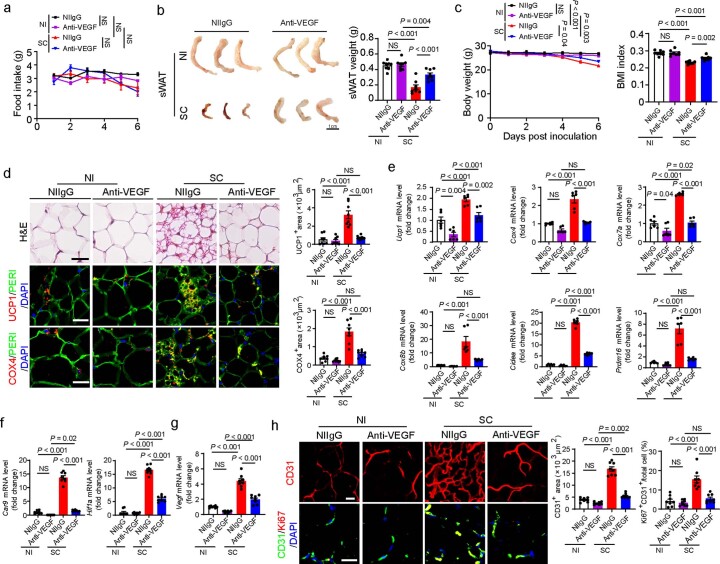
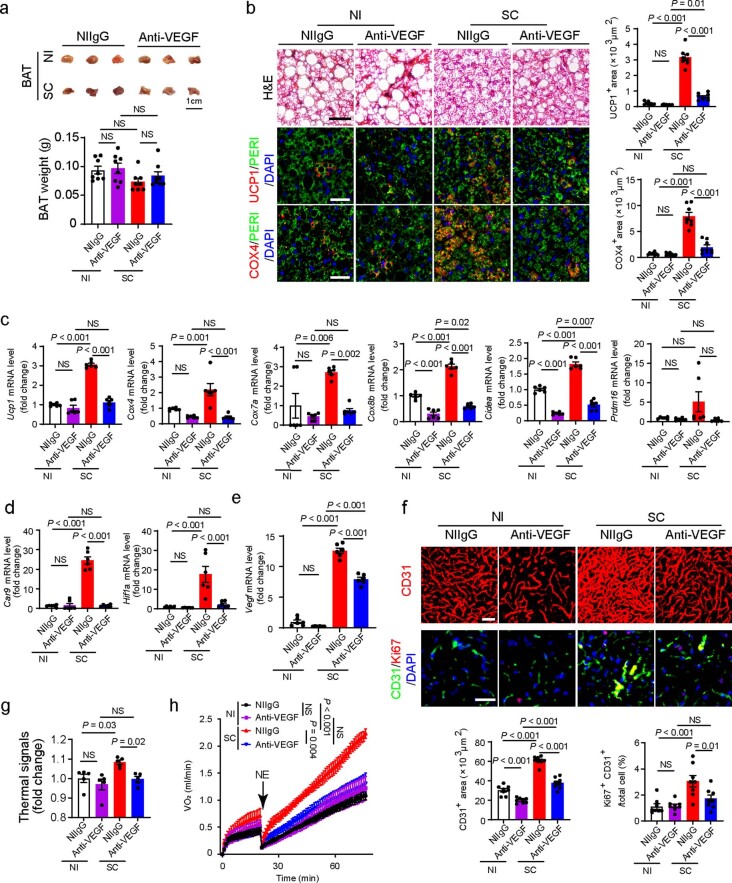
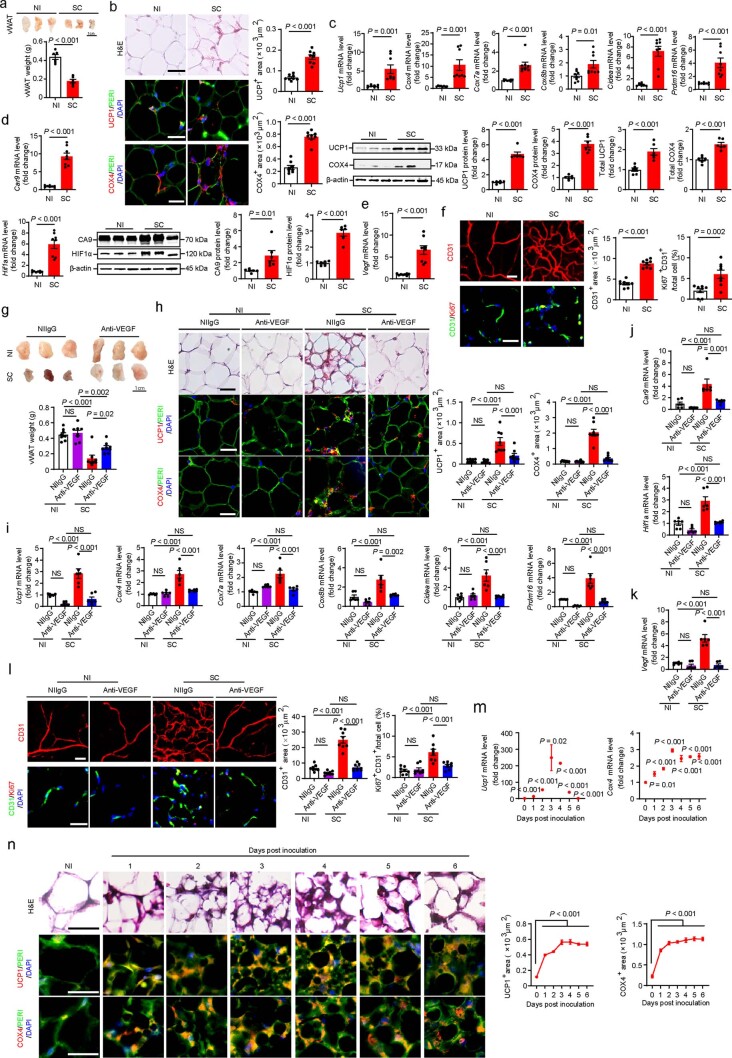
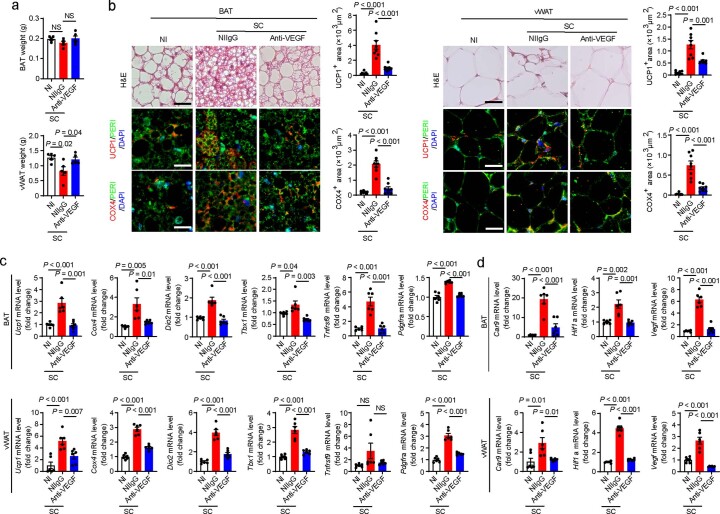
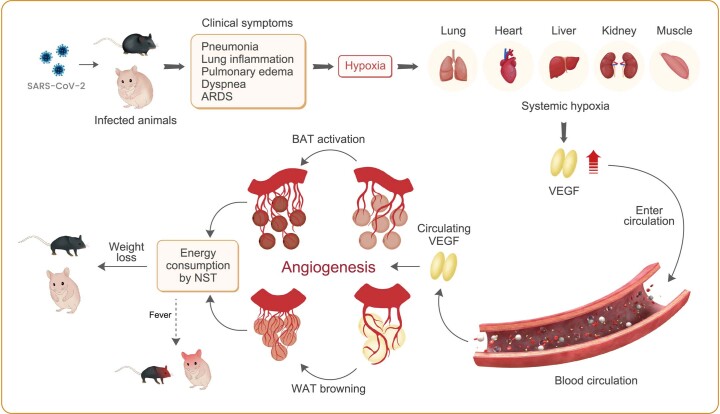
Patients with COVID-19 frequently manifest adipose atrophy, weight loss and cachexia, which significantly contribute to poor quality of life and mortality1,2. Browning of white adipose tissue and activation of brown adipose tissue are effective processes for energy expenditure3-7; however, mechanistic and functional links between SARS-CoV-2 infection and adipose thermogenesis have not been studied. In this study, we provide experimental evidence that SARS-CoV-2 infection augments adipose browning and non-shivering thermogenesis (NST), which contributes to adipose atrophy and body weight loss. In mouse and hamster models, SARS-CoV-2 infection activates brown adipose tissue and instigates a browning or beige phenotype of white adipose tissues, including augmented NST. This browning phenotype was also observed in post-mortem adipose tissue of four patients who died of COVID-19. Mechanistically, high levels of vascular endothelial growth factor (VEGF) in the adipose tissue induces adipose browning through vasculature-adipocyte interaction. Inhibition of VEGF blocks COVID-19-induced adipose tissue browning and NST and partially prevents infection-induced body weight loss. Our data suggest that the browning of adipose tissues induced by COVID-19 can contribute to adipose tissue atrophy and weight loss observed during infection. Inhibition of VEGF signaling may represent an effective approach for preventing and treating COVID-19-associated weight loss.


Conflict of interest statement

The authors declare no competing interests.

Figures

Fig. 1
Fig. 1. SARS-CoV-2 induces adipose atrophy in mice.
a, Body weights of non-infected (NI) and day-6 post-SC-infected mice (n = 6 mice per group). b, Representative images of sWAT and quantification of adipose depot weights of NI- or day-6 post-SC-infected mice (n = 6 samples per group). c,d, Histological and immunohistochemical analyses of BAT and sWAT of NI or day-6 post-SC-infected mice by staining with hematoxylin and eosin (H&E), perilipin (PERI), UCP1 and COX4. Immunohistological sections were counterstained (blue) by 4,6-diamidino-2-phenylindole (DAPI). UCP1- and COX4-positive signals of BAT and sWAT were quantified (n = 8 random fields per group). e, mRNA levels of browning markers of Ucp1 and Cox4 in BAT and sWAT of NI or day-6 post-SC-infected mice were quantified by qPCR (n = 8 samples per group). f, Immunoblot analysis of UCP1 and COX4 protein levels of BAT and sWAT in NI or day-6 post-SC-infected mice. β-actin served as internal control. Quantification of relative and total amount of UCP1 and COX4 (n = 6 samples per group). g, Quantification of Car9 and Hif1a mRNA levels by qPCR in sWAT of NI or day-6 post-SC-infected mice (n = 8 samples per group). h, Quantification of HIF1α and CA9 protein levels by immunoblot in sWAT of NI or day-6 post-SC-infected mice. β-actin served as internal controls (n = 6 samples per group). i, qPCR quantification of Vegf mRNA levels in sWAT of NI or day-6 post-SC-infected mice (n = 8 samples per group). j, Quantification of cVEGF levels in the plasma of NI or day-6 post-SC-infected mice (n = 8 mice per group). k, CD31 staining and quantification of microvessels in sWAT of NI or day-6 post-SC-infected mice. CD31 and Ki67 double-positive signals of sWAT were quantified (n = 8 random fields per group). Data are presented as mean ± s.e.m. Statistical analysis was performed using two-sided unpaired Student’s t-tests. SC, SARS-CoV-2. Scale bar, 50 μm. Source data
Fig. 2
Fig. 2. SARS-CoV-2 instigates adipose browning and NST metabolism under thermoneutrality.
a, Body weights of non-immune IgG (NIIgG)- and anti-VEGF-treated NI or SC-infected mice (n = 5 mice per group). Statistics on day 6 are presented. b, Daily food intake of NIIgG- and anti-VEGF-treated NI or SC-infected mice (n = 5 mice per group). Statistics on day 6 are presented. c, Representative images of adipose depots of each group and quantification of adipose depot weights of NIIgG- and anti-VEGF-treated NI or day-6 post-SC-infected mice (n = 5 samples per group). d, Histological and immunohistochemical analyses of BAT, sWAT and vWAT of NIIgG- and anti-VEGF-treated NI or day-6 post-SC-infected mice by staining with H&E, PERI (green), UCP1 (red) and COX4 (red). Tissue sections were counterstained with DAPI (blue). Quantifications of UCP1- and COX4-positive signals (n = 8 random fields per group). e, mRNA levels of browning markers of Ucp1 and Cox4 of NIIgG- and anti-VEGF-treated NI or day-6 post-SC-infected mice were quantified by qPCR (n = 5 samples per group). f, qPCR quantification of Car9 and Hif1a mRNA levels of NIIgG- and anti-VEGF-treated NI or day-6 post-SC-infected mice (n = 5 samples per group). g, qPCR quantification of Vegf mRNA levels of NIIgG- and anti-VEGF-treated NI or day-6 post-SC-infected mice (n = 5 samples per group). h, Quantification of circulating VEGF (cVEGF) levels in the plasma of NI or day-6 post-SC-infected mice (n = 5 mice per group). i, CD31 and Ki67 staining and quantification of microvessels of NI or day-6 post-SC-infected mice. Tissue sections were counterstained with DAPI. CD31 and Ki67 double-positive signals were quantified (n = 8 random fields per group). j, Quantification of interscapular thermal signals of NIIgG- and anti-VEGF-treated NI or day-3 post-SC-infected mice (n = 5 mice per group). k, Measurements of NST by norepinephrine in NIIgG- and anti-VEGF-treated NI or day-3 post-SC-infected mice. NE, norepinephrine (n = 5 mice per group). Data are presented as mean ± s.e.m. Statistical analysis was performed using one-way analysis of variance (ANOVA) followed by Tukey multiple-comparison test and two-sided unpaired Student’s t-tests. NS, not significant. Scale bar, 50 μm. Source data
Fig. 3
Fig. 3. SARS-CoV-2 induces VEGF-dependent adipose browning in hamsters.
a, Histological and immunohistochemical analyses of sWAT of NI hamsters and NIIgG- or anti-VEGF-treated day-8 post-SC-infected hamsters by staining with H&E, PERI, UCP1 and COX4. Tissue sections were counterstained with DAPI (blue). Quantification of UCP1- and COX4-positive signals in sWAT (n = 8 random fields per group). b, mRNA levels of browning markers of Ucp1, Cox4, Dio2, Tbx1, Tnfrsf9 and Pdgfra in sWAT of NI hamsters and NIIgG- or anti-VEGF-treated day-8 post-SC-infected hamsters were quantified by qPCR (n = 6 samples per group). c, sWAT weight and body weight of NI hamsters and NIIgG- or anti-VEGF-treated day-8 post-SC-infected hamsters (n = 5 hamsters per group). Statistics are shown on day 8 of infection. d, qPCR quantification of Car9 and Hif1a mRNA levels in sWAT of NI hamsters and NIIgG- or anti-VEGF-treated day-8 post-SC-infected hamsters (n = 6 samples per group). e, qPCR quantification of Vegf mRNA levels in sWAT of NI hamsters and NIIgG- or anti-VEGF-treated day-8 post-SC-infected hamsters (n = 6 samples per group). f, Physiological scores and core body temperature of NI hamsters and NIIgG- or anti-VEGF-treated day-8 post-SC-infected hamsters (n = 5 hamsters per group). Statistics are shown on day 8 of infection. Data are presented as mean ± s.e.m. Statistical analysis was performed using two-sided unpaired Student’s t-tests. Scale bar, 50 μm. Source data
Fig. 4
Fig. 4. COVID-19 stimulates adipose browning in human patients with severe COVID-19.
a, Histological and immunohistochemical analyses of sWAT, vWAT and supraclavicular BAT of autopsied fresh tissue samples from patients who died of COVID-19 infection. Non-infected patients who died of other diseases served as controls. Adipose tissues were stained with H&E, PERI, UCP1 and COX4. Tissue sections were counterstained with DAPI (blue). UCP1- and COX4-positive signals in sWAT, vWAT and BAT were quantified (n = 8 random fields per group). b, Quantification of mRNA levels of UCP1 and COX4 in human sWAT, vWAT and BAT (n = 4 samples per group). Data are presented as mean ± s.e.m. Statistical analysis was performed using two-sided unpaired Student’s t-tests. Scale bar, 50 μm. Source data
Extended Data Fig. 1
Extended Data Fig. 1. SARS-CoV-2 instigates adipose browning.
(a) Representative images of BAT and quantification of brown adipose depot weights of NI- or day-6-post SC-infected mice (n = 6 samples per group). (b) Daily food intake of NI- and SC-infected mice (n = 6 mice per group). (c) mRNA levels of browning markers of Cox7a, Cox8b, Cidea, and Prdm16 in BAT and sWAT of NI- or day-6-post SC-infected mice were quantified by qPCR (n = 8 samples per group). (d) Body weight of mice at various infected time points (n = 4 mice per group). (e) mRNA levels of browning markers of Ucp1, Cox4 in BAT and sWAT of mice at various infected time points were quantified by qPCR (n = 4 samples per group). (f) Histological and immunohistochemical analyses of BAT and sWAT of mice at various infected time points by staining with H&E, perilipin (PERI), UCP1 and COX4. Immunohistological sections were counterstained by DAPI (blue). UCP1 and COX4 positive signals of BAT and sWAT were quantified (n = 8 random fields per group). Data are presented as means ± s.e.m. Statistical analysis was performed using two-sided unpaired t-tests. NS = not significant. SC = SARS-CoV-2. Scale bar = 50 μm. Source data
Extended Data Fig. 2
Extended Data Fig. 2. SARS-CoV-2 instigates tissue hypoxia and VEGF expression in mice.
(a) Histological and immunohistochemical analyses of lung tissues of NI- and day-6-post SC-infected mice by staining with H&E, HIF1α and CA9. Tissue sections were counterstained with DAPI (blue). Quantification of HIF1α and CA9 positive signals in lung tissues (n = 8 random fields per group). Quantification of Car9 and Hif1a mRNA and HIF1α and CA9 protein levels by qPCR (n = 8 samples per group) and Western immunoblot (n = 6 samples per group) in lung tissues. (b) Quantification of Car9 and Hif1a mRNA levels by qPCR in BAT of NI- or day-6-post SC-infected mice (n = 8 samples per group). (c) Quantification of HIF1α and CA9 protein levels by Western immunoblot in BAT of NI- or day-6-post SC-infected mice. β-actin served as internal controls (n = 6 samples per group). (d) qPCR quantification of Vegf mRNA levels in BAT of NI- or day-6-post SARS-CoV-2-infected mice (n = 8 samples per group). (e) CD31 and Ki67 staining and quantification of microvessels in BAT of NI- or day-6-post SC-infected mice. Tissue sections were counterstained with DAPI (blue). CD31 and Ki67 double positive signals of BAT were quantified (n = 8 random fields per group). Data are presented as means ± s.e.m. Statistical analysis was performed using two-sided unpaired t-tests. NI = non-infected. SC = SARS-CoV-2. Scale bar = 50 μm. Source data
Extended Data Fig. 3
Extended Data Fig. 3. Blocking VEGF instigates adipose whitening and prevents body weight loss in mice.
(a) Daily food intake of NI- and day-6-post SC-infected mice (n = 8 mice per group). Statistics on day 6 are presented. (b) Representative pictures of sWAT, and quantification of adipose tissue weights of non-immune IgG (NIIgG)- and anti-VEGF-treated NI- or day-6-post SC-infected mice (n = 8 samples per group). (c) Body weight and body mass index (BMI) of NIIgG- and anti-VEGF-treated NI- or day-6-post SC-infected mice (n = 8 mice per group). Statistics of body weight on day 6 are shown. (d) Histological and immunohistochemical analyses of sWAT of NIIgG- and anti-VEGF-treated NI- or day-6-post SC-infected mice by staining with H&E, Perilipin (PERI), UCP1 and COX4. Tissue sections were counter stained with DAPI (blue). Quantifications of UCP1 and COX4 positive signals in sWAT (n = 8 random fields per group). (e) mRNA levels of browning markers of Ucp1, Cox4, Cox7a, Cox8b, Cidea, and Prdm16 in sWAT of NIIgG- and anti-VEGF-treated NI- or day-6-post SC-infected mice were quantified by qPCR (n = 6 samples per group). (f) qPCR quantification of Hif1a and Car9 mRNA levels in sWAT of NIIgG- and anti-VEGF-treated NI- or day-6-post SC-infected mice (n = 8 samples per group). (g) qPCR quantification of Vegf mRNA levels in sWAT of NIIgG- and anti-VEGF-treated NI- or day-6-post SC-infected mice (n = 8 samples per group). (h) CD31 and Ki67 staining and quantification of microvessels in sWAT of NIIgG- and anti-VEGF-treated NI- or day-6-post SC-infected mice. Tissue sections were counterstained with DAPI (blue). CD31 and Ki67 positive signals of sWAT were quantified (n = 8 random fields per group). Data are presented as means ± s.e.m. Statistical analysis was performed using one-way analysis of variance (ANOVA) followed by Tukey multiple-comparison test. NS = not significant. NI = non-infected. SC = SARS-CoV-2. Scale bar = 50 μm. Source data
Extended Data Fig. 4
Extended Data Fig. 4. BAT whitening and ablation of NST by blocking VEGF.
(a) Representative pictures of BAT and quantification of BAT weights of non-immune IgG (NIIgG)- and anti-VEGF-treated NI- or day-6-post SC-infected mice (n = 8 samples per group). (b) Histological and immunohistochemical analyses of BAT of NIIgG- and anti-VEGF-treated NI- or day-6-post SC-infected mice by staining with H&E, Perilipin (PERI), UCP1 and COX4. Tissue sections were counter stained with DAPI (blue). Quantifications of UCP1 and COX4 positive signals in BAT (n = 8 random fields per group). (c) mRNA levels of browning markers of Ucp1, Cox4, Cox7a, Cox8b, Cidea, and Prdm16 in BAT of NIIgG- and anti-VEGF-treated NI- or day-6-post SC-infected mice were quantified by qPCR (n = 6 samples per group). (d) qPCR quantification of Car9 and Hif1a mRNA levels in BAT of NIIgG- and anti-VEGF-treated NI- or day-6-post SC-infected mice (n = 6 samples per group). (e) qPCR quantification of Vegf mRNA levels in BAT of NIIgG- and anti-VEGF-treated NI- or day-6-post SC-infected mice (n = 6 samples per group). (f) CD31 and Ki67 staining and quantification of microvessels in BAT of NIIgG- and anti-VEGF-treated NI- or day-6-post SC-infected mice. Tissue sections were counterstained with DAPI (blue). CD31 and Ki67 double positive signals of BAT were quantified (n = 8 random fields per group). (g) Quantification of interscapular thermal signals of NIIgG- and anti-VEGF-treated NI- or day-3-post SC-infected mice (n = 5 mice per group). (h) Measurements of NST by norepinephrine in NIIgG- and anti-VEGF-treated NI- or day-3-post SC-infected mice. NE = norepinephrine (n = 5 mice per group). Data are presented as means ± s.e.m. Statistical analysis was performed using one-way analysis of variance (ANOVA) followed by Tukey multiple-comparison test. NS = not significant. NI = non-infected. SC = SARS-CoV-2. Scale bar = 50 μm. Source data
Extended Data Fig. 5
Extended Data Fig. 5. VEGF-dependent mechanisms of SARS-CoV-2-induced adipose browning.
(a) Representative pictures and weight of vWAT and vWAT weight of NI- and day-6-post SC-infected mice (n = 6 samples per group). (b) Histological and immunohistochemical analyses of vWAT of NI- and day-6-post SC-infected mice by staining with H&E, Perilipin (PERI), UCP1 and COX4. Quantification of UCP1 and COX4 positive signals in vWAT (n = 8 random fields per group). (c, d, e) Quantification of Ucp1, Cox4, Cox7a, Cox8b, Cidea, Prdm16, Car9, Hif1a and Vegf mRNA level (n = 8 samples per group); UCP1, COX4, HIF1α and CA9 protein level in vWAT of NI- and day-6-post SC-infected (n = 6 samples per group). (f) CD31 and Ki67 staining and quantification of microvessels in vWAT of NI- or day-6-post SC-infected mice (n = 8 random fields per group). (g) Representative pictures of vWAT and vWAT weight of NIIgG- and anti-VEGF-treated NI- or day-6-post SC-infected mice (n = 8 samples per group). (h) Histological and immunohistochemical analyses of vWAT of NIIgG- and anti-VEGF-treated NI- or day-6-post SC-infected mice by staining with H&E, Perilipin (PERI), UCP1 and COX4. Quantifications of UCP1 and COX4 positive signals in vWAT (n = 8 random fields per group). (i, j, k) Quantification of Ucp1, Cox4, Cox7a, Cox8b, Cidea, Prdm16, Car9, Hif1a and Vegf mRNA levels in vWAT of NIIgG- and anti-VEGF-treated NI- or day-6-post SC-infected mice (n = 6 samples per group). (l) CD31 and Ki67 double staining and quantification of microvessels in vWAT of NIIgG- and anti-VEGF-treated NI- or day-6-post SC-infected mice (n = 8 random fields per group). (m) Quantification of Ucp1 and Cox4 mRNA levels in vWAT of SC-infected mice at various time points (n = 4 samples per group). (n) Histological and immunohistochemical analyses of vWAT in SC-infected mice at various time points by staining with H&E, perilipin (PERI), UCP1 and COX4. UCP1+ and COX4+ signals were quantified (n = 8 random fields per group). Data are presented as means ± s.e.m. Statistical analysis was performed using one-way analysis of variance (ANOVA) followed by Tukey multiple-comparison test and two-sided unpaired t-tests. NS = not significant. NI = non-infected. SC = SARS-CoV-2. Scale bar = 50 μm. Source data
Extended Data Fig. 6
Extended Data Fig. 6. Suppression of BAT activation and vWAT browning by VEGF blockade in SARS-CoV-2-infected Syrian hamsters.
(a) BAT and vWAT weights in NI- hamsters and NIIgG- or anti-VEGF-treated day-8-post SC-infected hamsters (n = 5 hamsters per group). (b) Histological and immunohistochemical analyses of BAT and vWAT of NI- hamsters and NIIgG- or anti-VEGF-treated day-8-post SC-infected hamsters by staining with H&E, Perilipin (PERI), UCP1 and COX4. Tissue sections were counterstained with DAPI (blue). Quantification of UCP1 and COX4 positive signals in BAT and vWAT (n = 8 random fields per group). (c) mRNA levels of browning markers of Ucp1, Cox4, Dio2, Tbx1, Tnfrsf9, and Pdgfra in BAT and vWAT of NI- hamsters and NIIgG- or anti-VEGF-treated day-8-post SC-infected hamsters were quantified by qPCR (n = 6 samples per group). (d) mRNA levels of Car9, Hif1a and Vegf in BAT and vWAT of NI- hamsters and NIIgG- or anti-VEGF-treated day-8-post SC-infected hamsters were quantified by qPCR (n = 6 samples per group). Data are presented as means ± s.e.m. Statistical analysis was performed using two-sided unpaired t-tests. NS = not significant. NI = non-infected. SC = SARS-CoV-2. Scale bar = 50 μm. Source data
Extended Data Fig. 7
Extended Data Fig. 7. Schematic illustration of mechanisms underlying SARS-CoV-2-induced adipose atrophy and weight loss.
SARS-CoV-2 infection triggers dyspnea and pathological changes in the infected lung tissues, including pulmonary edema, inflammation, and obstruction of pulmonary alveoli. These pathological alterations induce local hypoxia in the lung tissue and systemic hypoxia in other tissues. Hypoxia serves as a potent factor to induce VEGF expression through the HIF1α-VEGF promoter dependent mechanism. Non-heparin-binding smaller isoforms of VEGF enters the circulation and produces systemic effects on multiple tissues and organs. In the adipose tissue, the local and circulating VEGF promotes browning phenotypes of WATs and BAT. Activation of BAT and browning of WATs augment non-shivering thermogenesis (NST) by heat production, which may partly explain the SARS-CoV-2-induced fever. NST activation by SARS-CoV-2 also markedly augments energy consumption, leading to a lean phenotype and clinically manifesting as adipose atrophy and weight loss.

References

    1. Anker MS, et al. Weight loss, malnutrition, and cachexia in COVID-19: facts and numbers. J. Cachexia Sarcopenia Muscle. 2021;12:9–13. doi: 10.1002/jcsm.12674. - DOI - PMC - PubMed
    1. Morley JE, Kalantar-Zadeh K, Anker SD. COVID-19: a major cause of cachexia and sarcopenia? J. Cachexia Sarcopenia Muscle. 2020;11:863–865. doi: 10.1002/jcsm.12589. - DOI - PMC - PubMed
    1. Cannon B, Nedergaard J. Brown adipose tissue: function and physiological significance. Physiol. Rev. 2004;84:277–359. doi: 10.1152/physrev.00015.2003. - DOI - PubMed
    1. Cypess AM, et al. Identification and importance of brown adipose tissue in adult humans. N. Engl. J. Med. 2009;360:1509–1517. doi: 10.1056/NEJMoa0810780. - DOI - PMC - PubMed
    1. van Marken Lichtenbelt WD, et al. Cold-activated brown adipose tissue in healthy men. N. Engl. J. Med. 2009;360:1500–1508. doi: 10.1056/NEJMoa0808718. - DOI - PubMed

Publication types

Substances