

Predominant SARS-CoV-2 variant impacts accuracy when screening for infection using exhaled breath vapor
- PMID: 36482179
- PMCID: PMC9731983
- DOI: 10.1038/s43856-022-00221-5
Predominant SARS-CoV-2 variant impacts accuracy when screening for infection using exhaled breath vapor
Abstract
Background: New technologies with novel and ambitious approaches are being developed to diagnose or screen for SARS-CoV-2, including breath tests. The US FDA approved the first breath test for COVID-19 under emergency use authorization in April 2022. Most breath-based assays measure volatile metabolites exhaled by persons to identify a host response to infection. We hypothesized that the breathprint of COVID-19 fluctuated after Omicron became the primary variant of transmission over the Delta variant.
Methods: We collected breath samples from 142 persons with and without a confirmed COVID-19 infection during the Delta and Omicron waves. Breath samples were analyzed by gas chromatography-mass spectrometry.
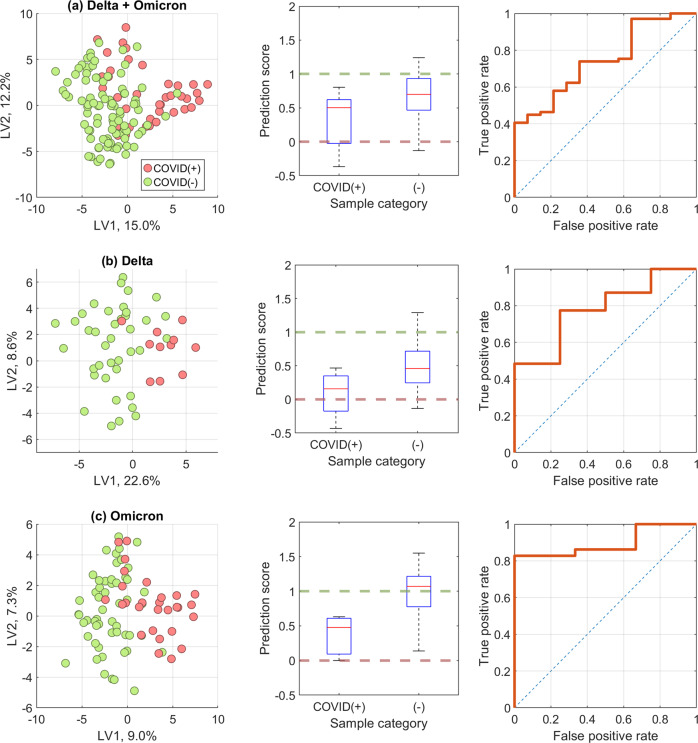
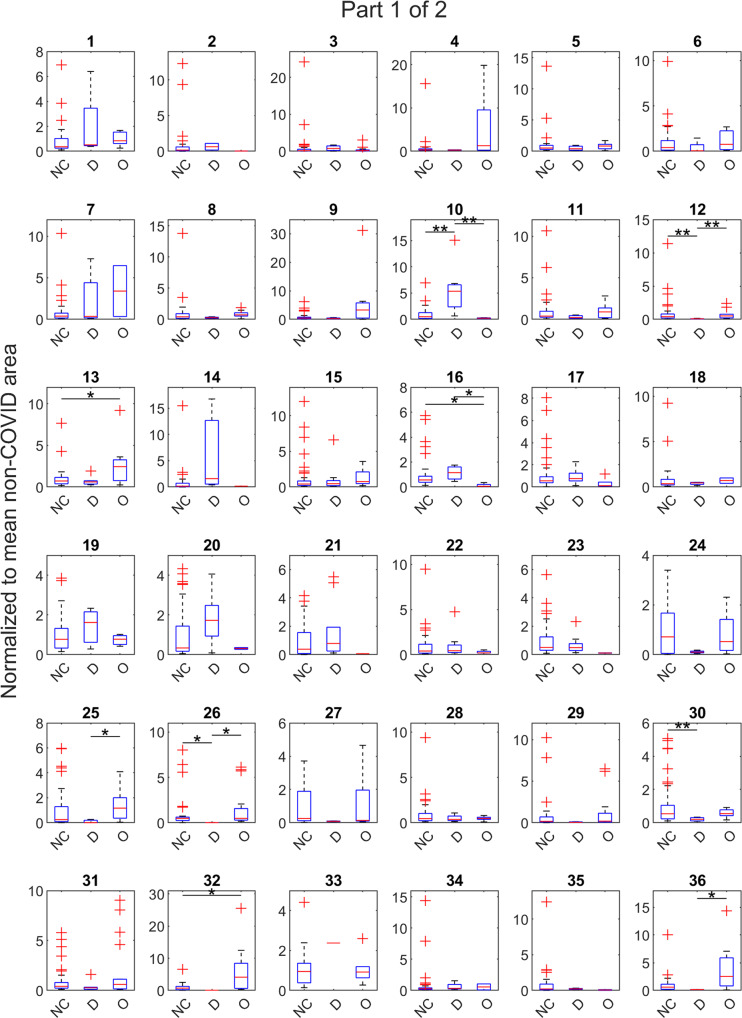
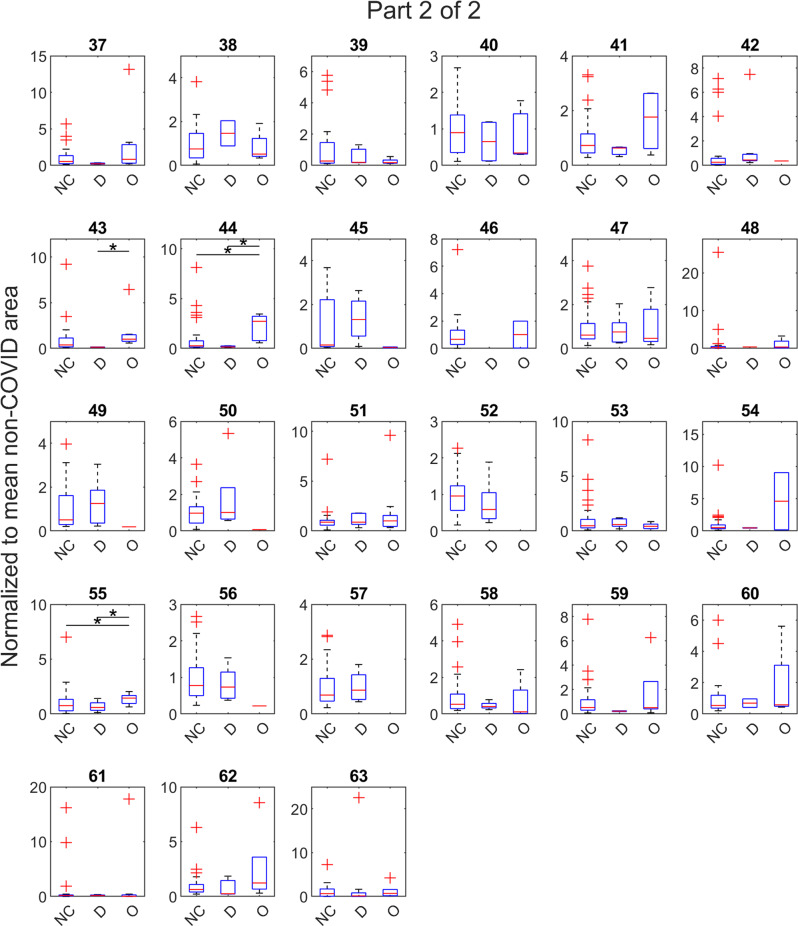
Results: Here we show that based on 63 exhaled compounds, a general COVID-19 model had an accuracy of 0.73 ± 0.06, which improved to 0.82 ± 0.12 when modeling only the Delta wave, and 0.84 ± 0.06 for the Omicron wave. The specificity improved for the Delta and Omicron models (0.79 ± 0.21 and 0.74 ± 0.12, respectively) relative to the general model (0.61 ± 0.13).
Conclusions: We report that the volatile signature of COVID-19 in breath differs between the Delta-predominant and Omicron-predominant variant waves, and accuracies improve when samples from these waves are modeled separately rather than as one universal approach. Our findings have important implications for groups developing breath-based assays for COVID-19 and other respiratory pathogens, as the host response to infection may significantly differ depending on variants or subtypes.
Plain language summary
In recent decades, scientists have found we exhale thousands of compounds that reveal much about our health, including whether we are sick with COVID-19. Our team asked whether the breath profile of someone infected with the Delta variant of COVID-19 would match the breath profile caused by the Omicron variant—a version of the virus that is more transmissible. We analyzed breath samples from 142 people, some sick with either the Delta or Omicron variant of COVID-19, and others who were negative for COVID-19. Our results indicate that the Delta variant altered the contents of our breath in a different way than the Omicron variant, and breath-based tests improved when optimized to detect only one of the variants. These findings might impact the design of future breath-based tests for COVID-19.
© 2022. The Author(s).
Conflict of interest statement
The authors declare no competing interests.
Figures
References
-
- U.S. Food & Drug Administratino. Coronavirus (COVID-19) Update: FDA Authorizes First COVID-19 Diagnostic Test Using Breath Samples.https://www.fda.gov/news-events/press-announcements/coronavirus-covid-19.... (2022).
-
- Davis, M. D. in Breathborne Biomarkers and the Human Volatilome (Second Edition) (eds. Jonathan Beauchamp, Cristina Davis, & Joachim Pleil) 109–119 (Elsevier, 2020).
Grants and funding
- 4U18TR003795/U.S. Department of Health & Human Services | NIH | National Center for Advancing Translational Sciences (NCATS)
- I01 BX004965/BX/BLRD VA/United States
- T31IR1614/Tobacco-Related Disease Research Program (TRDRP)
- U18 TR003795/TR/NCATS NIH HHS/United States
- UG3 OD023365/OD/NIH HHS/United States
- U01 TR004083/TR/NCATS NIH HHS/United States
- I01 BX004965-01A1/U.S. Department of Veterans Affairs (Department of Veterans Affairs)
- UL1 TR001860/TR/NCATS NIH HHS/United States
- P30 ES023513/ES/NIEHS NIH HHS/United States
- 1P30ES023513-01A1/U.S. Department of Health & Human Services | National Institutes of Health (NIH)
- UL1 TR000002/TR/NCATS NIH HHS/United States
- 1U18TR003795/U.S. Department of Health & Human Services | NIH | National Center for Advancing Translational Sciences (NCATS)
- UG3-OD023365/U.S. Department of Health & Human Services | National Institutes of Health (NIH)
- 1U01TR004083/U.S. Department of Health & Human Services | NIH | National Center for Advancing Translational Sciences (NCATS)
LinkOut - more resources
Full Text Sources
Miscellaneous
