. 2022 Dec;29(12):1277-1290.
doi: 10.1038/s41594-022-00882-9. Epub 2022 Dec 8.

A critical period of translational control during brain development at codon resolution

Affiliations

A critical period of translational control during brain development at codon resolution

Dermot Harnett et al. Nat Struct Mol Biol. 2022 Dec.

Erratum in

Abstract

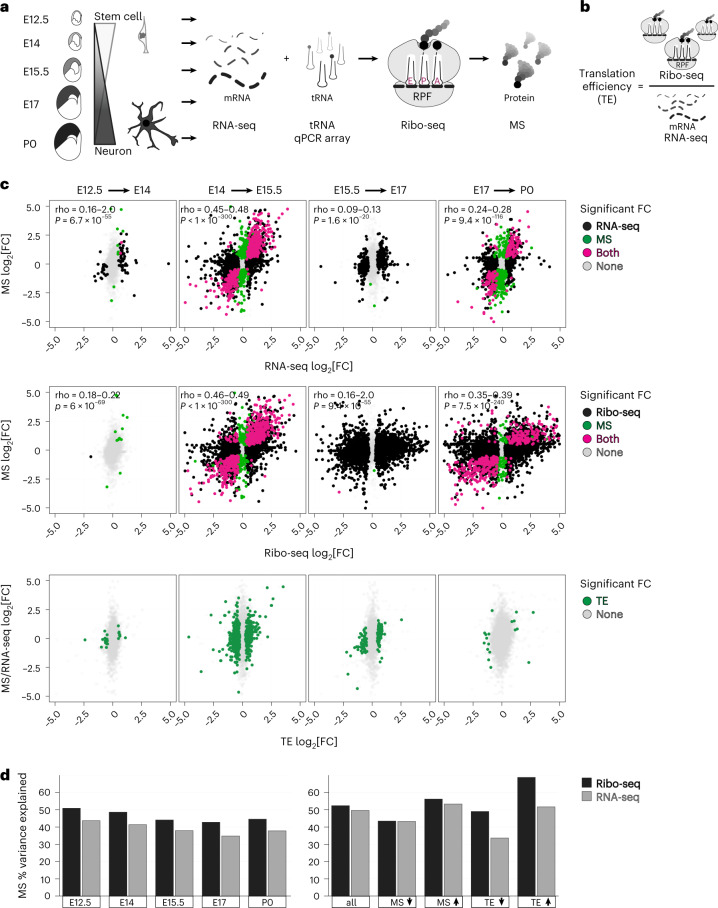
Translation modulates the timing and amplification of gene expression after transcription. Brain development requires uniquely complex gene expression patterns, but large-scale measurements of translation directly in the prenatal brain are lacking. We measure the reactants, synthesis and products of mRNA translation spanning mouse neocortex neurogenesis, and discover a transient window of dynamic regulation at mid-gestation. Timed translation upregulation of chromatin-binding proteins like Satb2, which is essential for neuronal subtype differentiation, restricts protein expression in neuronal lineages despite broad transcriptional priming in progenitors. In contrast, translation downregulation of ribosomal proteins sharply decreases ribosome biogenesis, coinciding with a major shift in protein synthesis dynamics at mid-gestation. Changing activity of eIF4EBP1, a direct inhibitor of ribosome biogenesis, is concurrent with ribosome downregulation and affects neurogenesis of the Satb2 lineage. Thus, the molecular logic of brain development includes the refinement of transcriptional programs by translation. Modeling of the developmental neocortex translatome is provided as an open-source searchable resource at https://shiny.mdc-berlin.de/cortexomics .


Conflict of interest statement

The authors declare no competing interests.

Figures

Fig. 1
Fig. 1. A transient spike in translation regulation occurs at mid-neurogenesis during prenatal development.
a, Neural stem cell differentiation in the brain’s neocortex, analyzed by RNA-seq, Ribo-seq, tRNA qPCR array and mass spectrometry (MS) at embryonic (E12.5–E17) and postnatal (P0) stages. b, Schematic of translation efficiency (TE). c, Sequential fold changes (FCs) in post-transcriptional gene expression between adjacent stages, comparing mRNA vs protein (top), mRNA translation vs protein (middle), and calculated translation efficiency (bottom). Differential expression was called with an empirical Bayes moderated two-sided t-test with adjustment for multiple comparisons. Significance assessed at ≥1.25 fold change, P < 0.05. d, The percent variance in mass spectrometry explained by RNA-seq or Ribo-seq at each developmental stage, and for subgroups with mass spectrometry and translation efficiency changes. See also Extended Data Figs. 1 and 2 and Supplementary Tables 1 and 2.
Fig. 2
Fig. 2. Translation upregulation of Satb2 leads to divergent spatiotemporal mRNA and protein expression.
a, GO (molecular function, MF) analysis of translationally upregulated (TE up) mRNAs. b, The median trajectory of Satb2, Nes and Bcl11b gene expression measured by RNA-seq, Ribo-seq, mass spectrometry and translation efficiency. The E15.5 time point is highlighted for Satb2. c, Satb2, Nes and Bcl11b expression in scRNA-seq data tracking differentiating neocortex cells from 1 h (apical progenitor, AP) to 96 h (neuron 4 days old, N4d) after birth (y axis), at birthdates E12, E13, E14 or E15 (x axis), with expression levels calculated in ref. . Expected distribution of protein expression is outlined. d, Neocortex coronal sections at E12.5, E14.5 and E16.5 analyzed for Satb2 and Bcl11b mRNA by FISH, and protein by IHC. Deep border of the cortical plate is demarcated at E16.5 (dotted line). Nuclei are stained with DAPI. CP, cortical plate; VZ, ventricular zone; UL, upper layers; LL, lower layers. e, Quantification of d; n = 3 independent brains for E16.5 IHC, n = 4 independent brains for all other stages or assays. Mean ± s.d. is shown. Comparison of adjacent cortical layers starting from deep (VZ) to superficial by unpaired two-tailed t-test with Welch’s correction, or Mann–Whitney U-test, after Shapiro–Wilk normality test. *P < 0.05, **P < 0.01, ***P < 0.001, ****P < 0.0001. See also Extended Data Fig. 3a,b and Supplementary Table 3.
Fig. 3
Fig. 3. Satb2 transcription is broad across neuronal lineages with more restricted translation.
a, Schematic of the experimental approach. b, Satb2 transcription activity visualized by Cre-driven (Satb2Cre/+) tdTomato expression, with reporter IUE at E12.5, E13.5 or E14.5 and imaged after 24 h. Co-electroporation of an eGFP plasmid labels all transfected cells. SVZ, subventricular zone; VZ, ventricular zone. c, Satb2tdTom co-immunolabeling with Pax6 (apical progenitors), Tbr2 (intermediate progenitors) and Draq5 (nuclei). In b and c, at least three independently electroporated animals were imaged. d, Satb2tdTom expression at E12.5–E14.5, with co-immunolabeling for neuronal fate determinant proteins Satb2 and Bcl11b, among all electroporated cells (eGFP). Negative control is the absence of Cre (Satb2+/+). e, Quantification of d for the number of total neurons transcribing Satb2 mRNA (Satb2tdTom, left), and the number of Satb2tdTom neurons synthesizing Cre, Satb2 and Bcl11b proteins (right). Mean ± s.d. is shown; n = 3 independently electroporated brains quantified for tdTomato, 4 for Cre, 4 for Satb2, and 5 for Bcl11b protein. Two-tailed t-test, P < 0.05 as shown. See also Extended Data Fig. 3c and Supplementary Table 3.
Fig. 4
Fig. 4. Translation downregulation decreases ribosome levels acutely at mid-neurogenesis.
a, GO (molecular function) analysis of translationally downregulated (TE down) mRNAs. b, The expression trajectories (gray) of all 79 ribosomal protein coding mRNAs in the large (Rpl) and small (Rps) subunits from E12.5 (t0) to subsequent stages (t), measured by RNA-seq, Ribo-seq, mass spectrometry and calculated translation efficiency. Median trajectories are shown in black. c,d, Immuno-electron microscopy (immuno-EM) labeling ribosomal protein uS7 (magenta) in the E12.5 and E15.5 neocortex neural stem cells and neurons (c), with quantification for ribosomes per cytoplasmic area (d); n = electron microscopy images, captured from 2 independent brains, 2 sections per brain at each developmental stage. Mean is shown (line), two-way Welch’s ANOVA and Dunnett’s post hoc test, **P < 0.01, ***P < 0.001. Neural stem cells are located in the ventricular zone (VZ) and subventricular zone (SVZ); post-mitotic neurons are located in the cortical plate (CP), lower layers (LL) and upper layers (UL). Nuclei are outlined. See also Extended Data Fig. 4 and Supplementary Table 3.
Fig. 5
Fig. 5. Ribosome density at the start codon and in the coding sequence shifts sharply at mid-neurogenesis.
a, Ribosome occupancy metagene plot including all mRNAs (top) surrounding the start (left) and stop (right) codons at five stages. Separation of mRNAs by changing or unchanged start codon occupancy (bottom). b, Position-specific fold changes in ribosome P-site counts surrounding the start and stop codons. c, Start (left) and stop (right) codon occupancy vs translation efficiency fold change per gene. Center is the maximum likelihood slope; ribbon is the 95% confidence interval. d, Between-codon variance in ribosome occupancy of A-sites, P-sites and E-sites at each stage. Calculation with both 29 nt (top) and 30 nt (bottom) RPF fragments shown. e, Distribution of per-codon A-site and P-site occupancy at each stage. f, Correlation between A-site and P-site occupancy per codon. Center is the maximum likelihood slope; ribbon is the 95% confidence interval. g, Ribosome A-site occupancy for each amino acid with corresponding synonymous codons at each stage. See also Extended Data Figs. 5 and 6 and Supplementary Table 4.
Fig. 6
Fig. 6. eIF4EBP1 regulation coincides with ribosome abundance and controls neuronal Satb2 fate in vivo.
a, Model of early vs late neurogenesis ribosome levels and per-codon changes in ribosome occupancy. b, Positional weight matrix of the top two motifs ranked by P value in the 5′ UTR and 3′ UTR of TE up or down mRNAs. 5′ TOP motifs are highlighted (pink square). c, Schematic portraying eIF4EBP1 inhibition of ribosomal protein mRNA 5′ TOP sequence translation. d, Western blot analysis of total and phosphorylated eIF4EBP1 levels in neocortex lysates in biological duplicate (n = 4–6 hemispheres per lane). Concurrent trajectory of Rpl and Rps translation is shown below. e,f, IHC of total (e) and phosphorylated (f) eIF4EBP1 expression in neocortex coronal sections across neurogenesis. Blood vessels (stars) are a common staining finding. g, shRNA knockdown of eIF4EBP1 compared with scrambled control by IUE at E13.5, followed by analysis at E15.5 with Satb2 protein immunolabeling. Co-electroporation of eGFP labels all transfected cells. Cortical plate (CP) boundary is demarcated (dotted line), zoom of yellow boxes (right). h, Quantification of g, n = independent electroporated brains, for the percentage of electroporated cells expressing Satb2 protein (left), and number of cells migrating into the cortical plate (right). Median (line), two-sided Mann–Whitney U-test, P < 0.05 as shown. i, Summary of timed translation changes and neuronal specification during neocortex development. See also Supplementary Table 3. Source data
Fig. 7
Fig. 7. Modeling divergent trajectories of mRNA and protein expression by translation regulation.
a, mRNA (RNA-seq) and protein (mass spectrometry) expression per gene from E12.5 (t0) to subsequent stages (t) clustered by trajectory. The median trajectory is shown, with upper and lower quartile ribbons. Enrichment and proportion of TE up and down genes in each cluster, with significant enrichment (*P < 0.05). Fisher’s exact test comparing TE up or down vs no change, within each class. Example neural stem cell and neuronal marker genes are indicated (right). b, GO (biological process, BP) enrichment for each cluster, with unique terms for a cluster outlined in gray. c, Modeling of non-linear relationships between Ribo-seq and mass spectrometry comparing active translation vs steady-state protein, with representative genes shown for each category. A 95% confidence interval on the model fit is shown, n = 2 Ribo-seq, or 3 mass spectrometry, analyses of biologically independent pooled neocortex lysates; see Main and Methods for details. d, Proportion of total genes in each category from c, with enriched GO terms per category. Fisher’s exact test, P < 0.05. See also Extended Data Fig. 7, Supplementary Table 5 and https://shiny.mdc-berlin.de/cortexomics.
Extended Data Fig. 1
Extended Data Fig. 1. Optimized ribosome protected mRNA fragment purification from neocortex.
Nuclease digestion for the generation of ribosome protected mRNA fragments (RPFs) from P0 neocortex, with a, RNAse-I vs. b, a combination of RNAse-T1 & A. Absorbance at 260 nm (A260). Chains of actively translating ribosomes (polysome) should be digested into single ribosomes (monosome). RNAse-I, typically used in yeast, was inefficient in neocortex lysates, and thus an RNAse-T1 & A protocol was used for this study. c, Nuclease digestion and purification of neocortex RPFs in biological duplicates at each developmental stage with the optimized protocol from (b). Each biological replicate included 17–40 brains (34–80 neocortex hemispheres) as detailed in the Methods. d, RPF read length distribution. Associated with Fig. 1. See also Supplementary Table 1.
Extended Data Fig. 2
Extended Data Fig. 2. Neocortex RNA-seq, Ribo-seq, MS, and translation efficiency data characteristics.
a, River plots demonstrating the number of unique genes detected across all 5 stages measured by RNA-seq, Ribo-seq, or mass spectrometry, compared to the number detected in <5 stages. b, Biological replicates of transcripts per million (TPM) measured by RNA-seq (mRNA), Ribo-seq (RPF), and calculated translation efficiency (TE), including correlations between RPF and TE with mRNA to highlight genes with robust translation regulation. c, The distribution of TE up and down fold changes (FC) compared to the earliest stage E12.5, with significant genes highlighted in black (p < 0.05). Differential expression was called with an empirical Bayes moderated two-sided t-test with adjustment for multiple comparisons. d, The distribution of TE and mRNA abundance (TPM) for all genes at each stage, and e, fold changes vs. the earliest stage E12.5. f, Principal component analysis (PCA) of developmental fold changes in RNA-seq, TE, and MS compared to the earliest stage E12.5. The first four components are shown, with percent variance annotated. Associated with Fig. 1. See also Supplementary Tables 1–2.
Extended Data Fig. 3
Extended Data Fig. 3. Satb2−/− control for FISH and IHC and neocortex-specific Satb2 transcription.
a, Fluorescence in situ hybridization (FISH) and immunohistochemistry (IHC) probing for Satb2 and Bcl11b mRNA and protein, respectively, in wild-type (Satb2+/+) and Satb2 knockout (Satb2/) neocortex coronal sections at E14.5. Ventricular zone (VZ), cortical plate (CP). b, Measurement of Satb2 and Bcl11b mRNA cluster sizes in FISH probed neocortex sections at three developmental stages. Intermediate zone (IZ), lower layers (LL), upper layers (UL). Center is median, bounds are quartiles. c, Satb2 transcription activation visualized in Satb2Cre/+ mice by in utero co-electroporation of the neocortex and ganglionic eminence with a loxP-STOP-loxP-tdTomato (Satb2tdTom) fluorescence reporter at E12.5, along with eGFP reporter for all transfected cells, and analysis in coronal sections at E13.5. Sub-ventricular zone (SVZ). Associated with Figs. 2 and 3. See also Supplementary Table 3.
Extended Data Fig. 4
Extended Data Fig. 4. Immuno-electron microscopy labeling of ribosomes.
a, Raw images of neocortex coronal sections at E12.5 and E15.5 shown in Fig. 4c, immunolabeled with anti-ribosomal protein uS7 followed by 2.5 nm gold secondary (dark black spots), which were automatically detected and quantified in FIJI (magenta spots in Fig. 4c). Electron microscopy was performed in regions corresponding to the stem cell niches of the ventricular zone (VZ) and sub-ventricular zone (SVZ), in addition to regions of differentiating neurons in the cortical plate (CP), which includes both lower layers (LL) and upper layers (UL) at later stages. Quantification of nanogold secondary signal was performed per unit area of the cytoplasm, with nuclei excluded by tracing the nuclear membrane (black lines in Fig. 4c). b, Primary antibody leave-out controls were prepared in parallel. Cell images were captured from 2 independent brains, 2 sections/brain, at each developmental stage. Quantification of each image with n images quantified is reported in Fig. 4d.
Extended Data Fig. 5
Extended Data Fig. 5. Analysis of per-codon ribosome density.
5′ normalized ribosome-protected mRNA fragment (RPF) density for a, all codons and b, the top 3 slowest/fastest codons. Plotting the normalized density of Ribo-seq read 5′ ends relative to each codon/read length/sample shows two strongly variable regions corresponding to 5′- and 3′-end cut site biases during nuclease digestion. A third variable region in between corresponds to RPFs with their A/P-sites positioned over the codon. We infer the location of the A-site as the 3 bp region showing the most inter-codon variability (see Methods), and use the normalized occupancy here to measure codon density, and variance between codons. Independently, this region also identifies the location of intra-codon variability between samples. c, Per-codon correlation between tRNA availability calculated from tRNA qPCR array (see Methods), and the ribosome occupancy of that codon when positioned in the A-site of the ribosome footprint. Center is maximum likelihood slope, ribbon is 95% CI. d, Correlation between ribosome occupancy per codon and the optimality of the codon as defined in ref. , with the mean across all stages shown. Association between paired samples in (c, d) was tested with Pearson’s product moment correlation coefficient. Associated with Fig. 5. See also Supplementary Table 4.
Extended Data Fig. 6
Extended Data Fig. 6. Neocortex tRNA qPCR array.
Total tRNA levels at each stage measured by qPCR array in biological duplicate, with Ct values for each tRNA isodecoder (left) or averaged across isodecoders (right) compared to the mean of 5S and 18S rRNA levels in each sample (delta Ct). Associated with Fig. 5. See also Supplementary Table 4.
Extended Data Fig. 7
Extended Data Fig. 7. Modeling of mRNA translation.
a, Hierarchical clustering based on mRNA (RNA-seq) and protein (MS) expression trajectories per gene. Fold change expression increasing or decreasing from E12.5 (t0) to subsequent developmental stages (t) shown in heat map. Neural stem cell and neuronal marker genes are indicated (right). b, Protein half-lives measured by SILAC MS and categorized as exponential decay (ED), non-exponential decay (NED), or neither (UN) in correlated with the model estimates from our data as per. Center is maximum likelihood slope, ribbon is 95% CI. c, The fraction of genes modeled as MS deviating or non-deviating in this study that are categorized as NED proteins in. Fisher’s exact test for significance. Associated with Fig. 7. See also Supplementary Table 5.
Extended Data Fig. 8
Extended Data Fig. 8. Start codon effect and 5′-UTR analysis.
a, Translation efficiency (TE) distribution for genes with increasing start codon occupancy across developmental stages, compared to those without start occupancy changes. b, The association of mRNAs demonstrating start codon occupancy changes with translation in neurites vs. the soma of cultured neurons. c, Change in ribosome density from E12.5-E15.5 upstream of the main open reading frame for TE down vs. up mRNAs. d, Density of predicted G-quadruplex-forming sequences in the 5’-UTR of TE down vs. up mRNAs. Significant differences between groups in (c, d) assessed by unpaired two-tailed Wilcoxon test, n = 1129 TE up, 1131 TE down, and 9968 no TE change genes calculated from Ribo-seq and RNA-seq analyses of 2 biologically independent neocortex lysates. Boxplot centers are median, with quartile bounds, and whiskers are observations ≥ or ≤ hinges + or - 1.5 * IQR, respectively. See Main and Methods text for details. Associated with Fig. 5.

References

    1. Buccitelli, C. & Selbach, M. mRNAs, proteins and the emerging principles of gene expression control. Nat. Rev. Genet.21, 630–644 (2020). - PubMed
    1. DeBoer, E. M., Kraushar, M. L., Hart, R. P. & Rasin, M.-R. Post-transcriptional regulatory elements and spatiotemporal specification of neocortical stem cells and projection neurons. Neuroscience248, 499–528 (2013). - PMC - PubMed
    1. Cadwell, C. R., Bhaduri, A., Mostajo-Radji, M. A., Keefe, M. G. & Nowakowski, T. J. Development and arealization of the cerebral cortex. Neuron103, 980–1004 (2019). - PMC - PubMed
    1. Telley, L. et al. Temporal patterning of apical progenitors and their daughter neurons in the developing neocortex. Science364, eaav2522 (2019). - PubMed
    1. Zahr, S. K. et al. A translational repression complex in developing mammalian neural stem cells that regulates neuronal specification. Neuron97, 520–537.e6 (2018). - PubMed

Publication types