

The anterior gradient homologue 2 (AGR2) co-localises with the glucose-regulated protein 78 (GRP78) in cancer stem cells, and is critical for the survival and drug resistance of recurrent glioblastoma: in situ and in vitro analyses
- PMID: 36482387
- PMCID: PMC9730595
- DOI: 10.1186/s12935-022-02814-5
The anterior gradient homologue 2 (AGR2) co-localises with the glucose-regulated protein 78 (GRP78) in cancer stem cells, and is critical for the survival and drug resistance of recurrent glioblastoma: in situ and in vitro analyses
Abstract
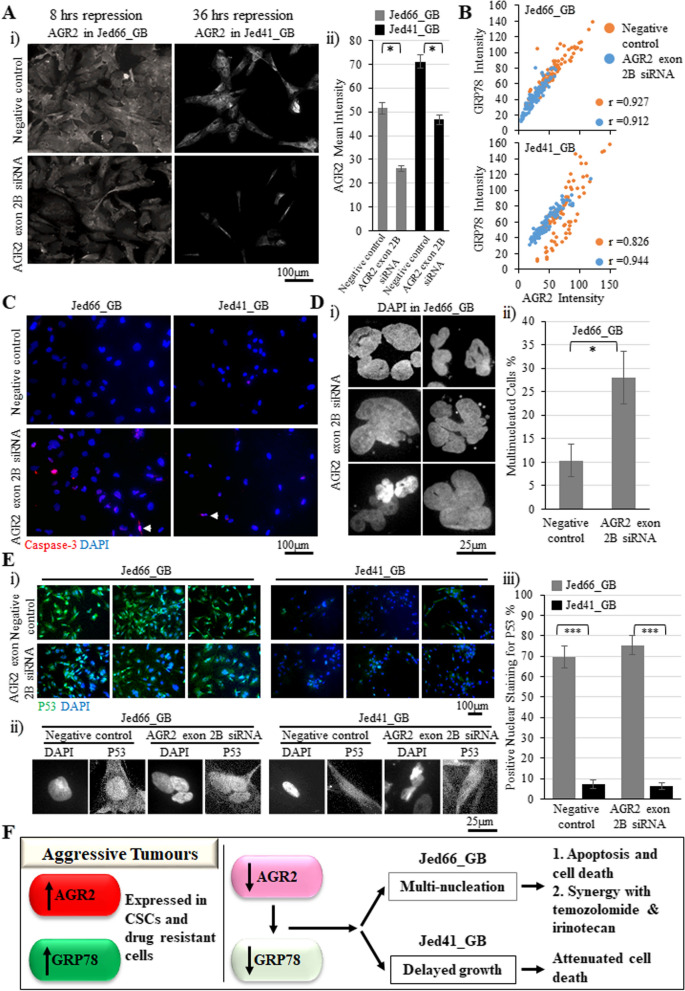
Background: Glioblastomas (GBs) are characterised as one of the most aggressive primary central nervous system tumours (CNSTs). Single-cell sequencing analysis identified the presence of a highly heterogeneous population of cancer stem cells (CSCs). The proteins anterior gradient homologue 2 (AGR2) and glucose-regulated protein 78 (GRP78) are known to play critical roles in regulating unfolded protein response (UPR) machinery. The UPR machinery influences cell survival, migration, invasion and drug resistance. Hence, we investigated the role of AGR2 in drug-resistant recurrent glioblastoma cells.
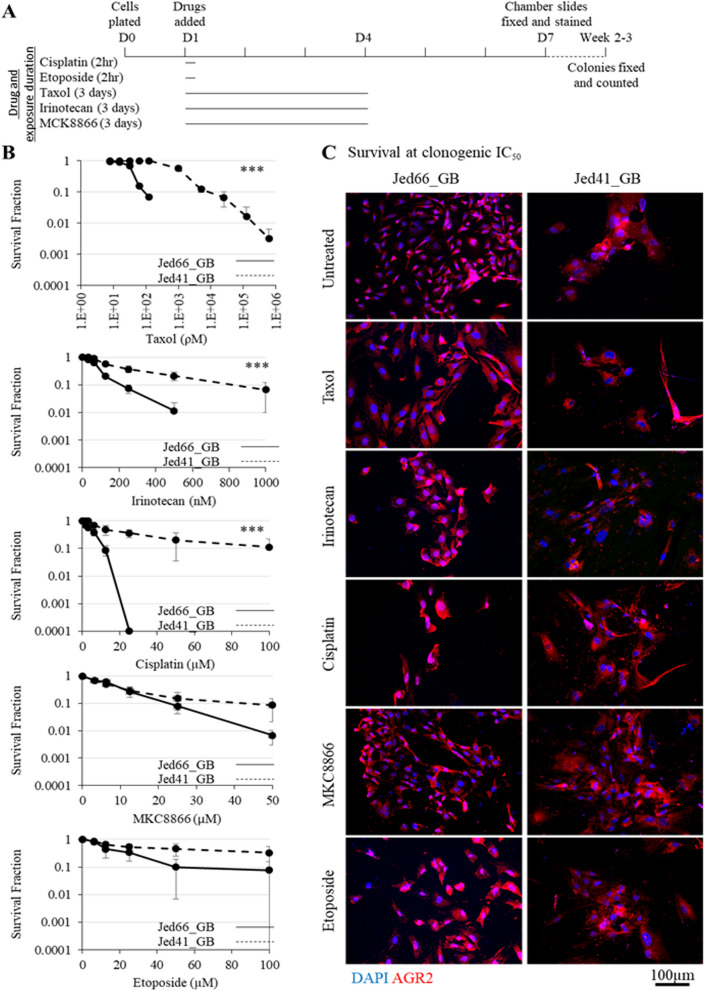
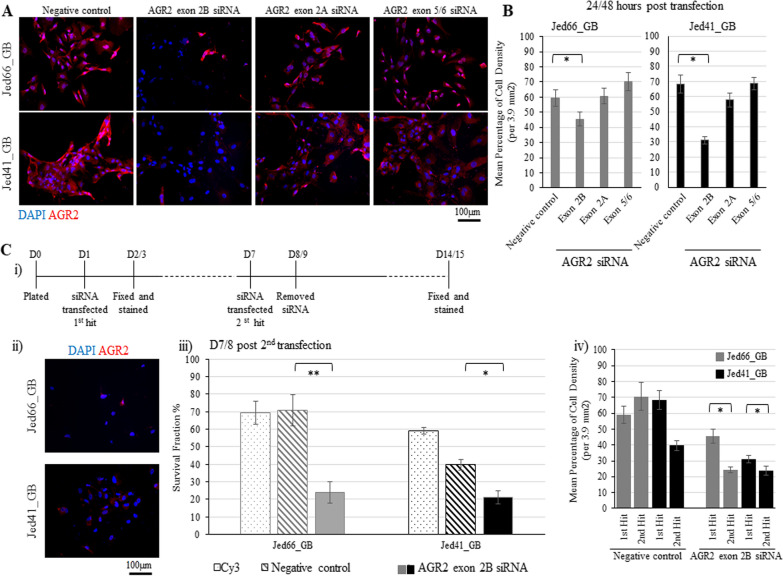
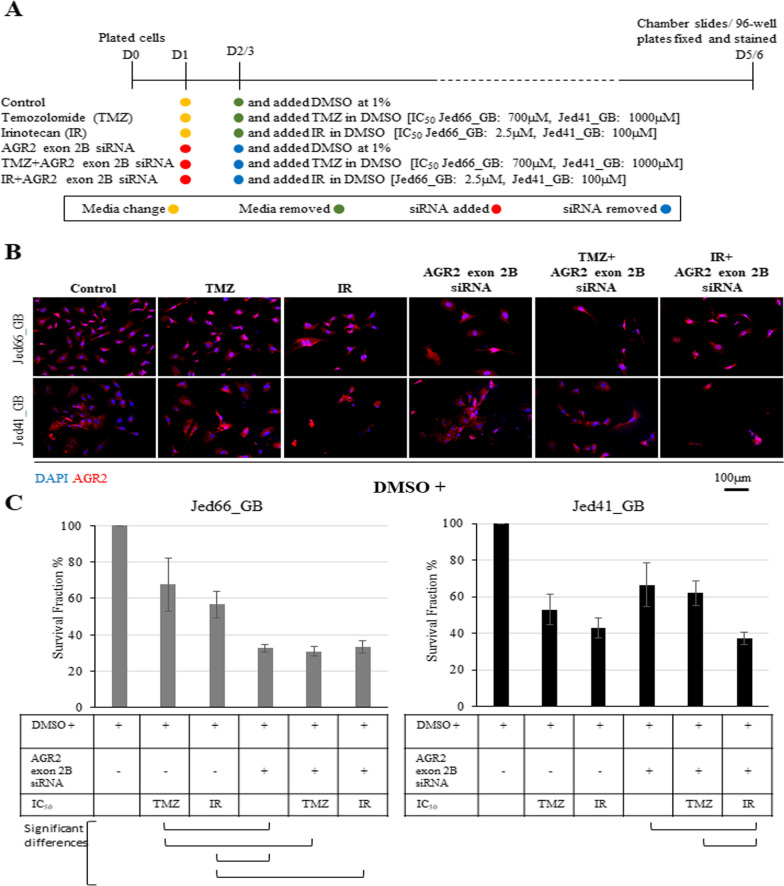
Methods: Immunofluorescence, biological assessments and whole exome sequencing analyses were completed under in situ and in vitro conditions. Cells were treated with CNSTs clinical/preclinical drugs taxol, cisplatin, irinotecan, MCK8866, etoposide, and temozolomide, then resistant cells were analysed for the expression of AGR2. AGR2 was repressed using single and double siRNA transfections and combined with either temozolomide or irinotecan.
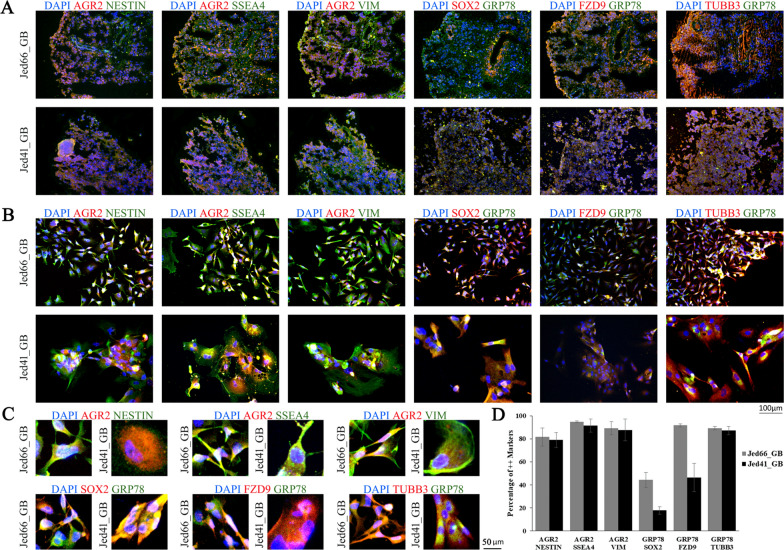
Results: Genomic and biological characterisations of the AGR2-expressed Jed66_GB and Jed41_GB recurrent glioblastoma tissues and cell lines showed features consistent with glioblastoma. Immunofluorescence data indicated that AGR2 co-localised with the UPR marker GRP78 in both the tissue and their corresponding primary cell lines. AGR2 and GRP78 were highly expressed in glioblastoma CSCs. Following treatment with the aforementioned drugs, all drug-surviving cells showed high expression of AGR2. Prolonged siRNA repression of a particular region in AGR2 exon 2 reduced AGR2 protein expression and led to lower cell densities in both cell lines. Co-treatments using AGR2 exon 2B siRNA in conjunction with temozolomide or irinotecan had partially synergistic effects. The slight reduction of AGR2 expression increased nuclear Caspase-3 activation in both cell lines and caused multinucleation in the Jed66_GB cell line.
Conclusions: AGR2 is highly expressed in UPR-active CSCs and drug-resistant GB cells, and its repression leads to apoptosis, via multiple pathways.
Keywords: Anterior gradient homologue 2 (AGR2); Cancer stem cells (CSCs); Drug resistance; Glioblastoma; Glucose-regulated protein 78 (GRP78).
© 2022. The Author(s).
Conflict of interest statement
The authors declare that the research was conducted in the absence of any commercial or financial relationships that could be construed as potential conflicts of interest.
Figures

Similar articles
-
Pleomorphism and drug resistant cancer stem cells are characteristic of aggressive primary meningioma cell lines.Cancer Cell Int. 2017 Jul 21;17:72. doi: 10.1186/s12935-017-0441-7. eCollection 2017. Cancer Cell Int. 2017. PMID: 28736504 Free PMC article.
-
Leveraging the Role of the Metastatic Associated Protein Anterior Gradient Homologue 2 in Unfolded Protein Degradation: A Novel Therapeutic Biomarker for Cancer.Cancers (Basel). 2019 Jun 26;11(7):890. doi: 10.3390/cancers11070890. Cancers (Basel). 2019. PMID: 31247903 Free PMC article. Review.
-
AGR2 is a target of canonical Wnt/β-catenin signaling and is important for stemness maintenance in colorectal cancer stem cells.Biochem Biophys Res Commun. 2019 Aug 6;515(4):600-606. doi: 10.1016/j.bbrc.2019.05.154. Epub 2019 Jun 6. Biochem Biophys Res Commun. 2019. PMID: 31178140
-
AGR2 expression is regulated by HIF-1 and contributes to growth and angiogenesis of glioblastoma.Cell Biochem Biophys. 2013;67(3):1487-95. doi: 10.1007/s12013-013-9650-4. Cell Biochem Biophys. 2013. PMID: 23712868
-
The estrogen-regulated anterior gradient 2 (AGR2) protein in breast cancer: a potential drug target and biomarker.Breast Cancer Res. 2013 Apr 24;15(2):204. doi: 10.1186/bcr3408. Breast Cancer Res. 2013. PMID: 23635006 Free PMC article. Review.
Cited by
-
ER stress and/or ER-phagy in drug resistance? Three coincidences are proof.Cell Commun Signal. 2025 May 13;23(1):223. doi: 10.1186/s12964-025-02232-w. Cell Commun Signal. 2025. PMID: 40361118 Free PMC article. Review.
-
GRP78 as a potential therapeutic target in cancer treatment: an updated review of its role in chemoradiotherapy resistance of cancer cells.Med Oncol. 2025 Jan 18;42(2):49. doi: 10.1007/s12032-024-02586-0. Med Oncol. 2025. PMID: 39827214 Review.
-
Research progress on the GRP78 gene in the diagnosis, treatment and immunity of cervical cancer.Eur J Med Res. 2023 Oct 20;28(1):447. doi: 10.1186/s40001-023-01241-0. Eur J Med Res. 2023. PMID: 37858217 Free PMC article. Review.
-
Function and mechanism of exogenous AGR2 in colorectal cancer cells.Heliyon. 2024 Mar 19;10(7):e28175. doi: 10.1016/j.heliyon.2024.e28175. eCollection 2024 Apr 15. Heliyon. 2024. PMID: 38560175 Free PMC article.
-
TGM2, HMGA2, FXYD3, and LGALS4 genes as biomarkers in acquired oxaliplatin resistance of human colorectal cancer: A systems biology approach.PLoS One. 2023 Aug 3;18(8):e0289535. doi: 10.1371/journal.pone.0289535. eCollection 2023. PLoS One. 2023. PMID: 37535601 Free PMC article.
References
Grants and funding
LinkOut - more resources
Full Text Sources
Research Materials
Miscellaneous
