. 2022 Dec 8;17(1):80.
doi: 10.1186/s13024-022-00585-1.

Nuclear import receptors are recruited by FG-nucleoporins to rescue hallmarks of TDP-43 proteinopathy

Affiliations

Nuclear import receptors are recruited by FG-nucleoporins to rescue hallmarks of TDP-43 proteinopathy

Bilal Khalil et al. Mol Neurodegener. .

Abstract

Background: Cytoplasmic mislocalization and aggregation of TAR DNA-binding protein-43 (TDP-43) is a hallmark of the amyotrophic lateral sclerosis and frontotemporal dementia (ALS/FTD) disease spectrum, causing both nuclear loss-of-function and cytoplasmic toxic gain-of-function phenotypes. While TDP-43 proteinopathy has been associated with defects in nucleocytoplasmic transport, this process is still poorly understood. Here we study the role of karyopherin-β1 (KPNB1) and other nuclear import receptors in regulating TDP-43 pathology.

Methods: We used immunostaining, immunoprecipitation, biochemical and toxicity assays in cell lines, primary neuron and organotypic mouse brain slice cultures, to determine the impact of KPNB1 on the solubility, localization, and toxicity of pathological TDP-43 constructs. Postmortem patient brain and spinal cord tissue was stained to assess KPNB1 colocalization with TDP-43 inclusions. Turbidity assays were employed to study the dissolution and prevention of aggregation of recombinant TDP-43 fibrils in vitro. Fly models of TDP-43 proteinopathy were used to determine the effect of KPNB1 on their neurodegenerative phenotype in vivo.

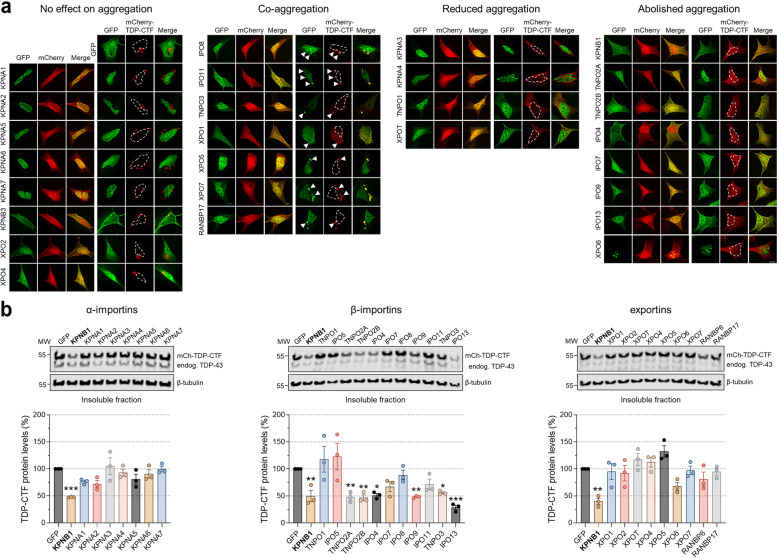
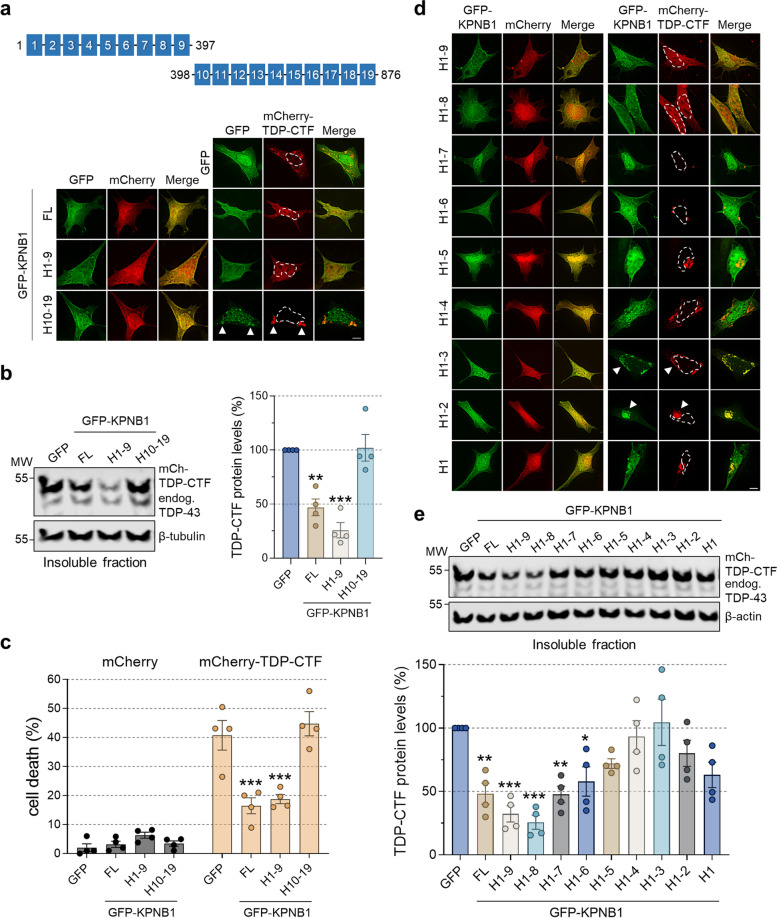
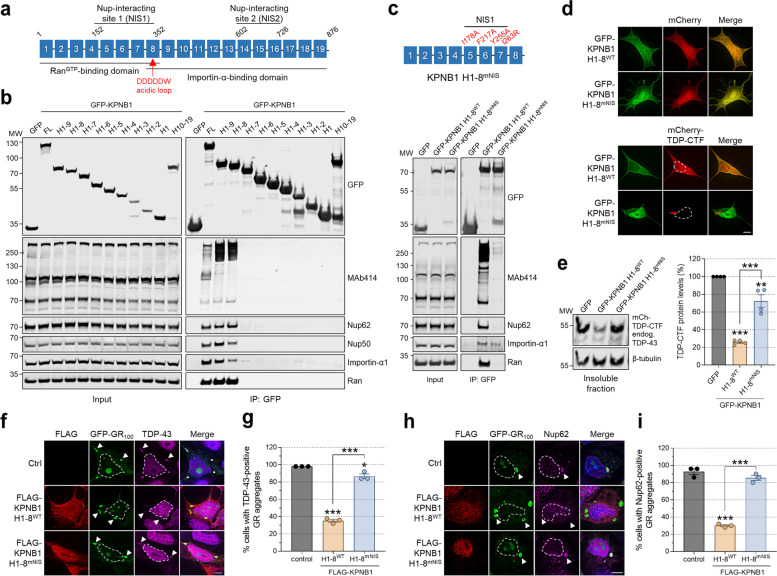
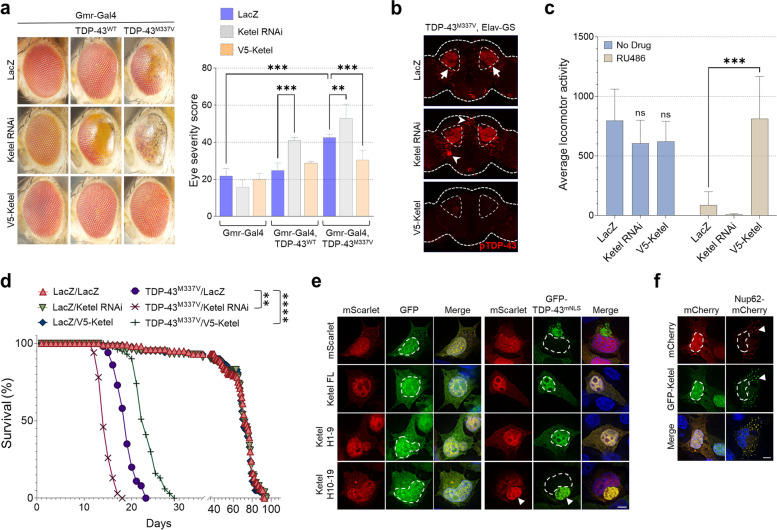
Results: We discovered that several members of the nuclear import receptor protein family can reduce the formation of pathological TDP-43 aggregates. Using KPNB1 as a model, we found that its activity depends on the prion-like C-terminal region of TDP-43, which mediates the co-aggregation with phenylalanine and glycine-rich nucleoporins (FG-Nups) such as Nup62. KPNB1 is recruited into these co-aggregates where it acts as a molecular chaperone that reverses aberrant phase transition of Nup62 and TDP-43. These findings are supported by the discovery that Nup62 and KPNB1 are also sequestered into pathological TDP-43 aggregates in ALS/FTD postmortem CNS tissue, and by the identification of the fly ortholog of KPNB1 as a strong protective modifier in Drosophila models of TDP-43 proteinopathy. Our results show that KPNB1 can rescue all hallmarks of TDP-43 pathology, by restoring its solubility and nuclear localization, and reducing neurodegeneration in cellular and animal models of ALS/FTD.

Conclusion: Our findings suggest a novel NLS-independent mechanism where, analogous to its canonical role in dissolving the diffusion barrier formed by FG-Nups in the nuclear pore, KPNB1 is recruited into TDP-43/FG-Nup co-aggregates present in TDP-43 proteinopathies and therapeutically reverses their deleterious phase transition and mislocalization, mitigating neurodegeneration.

Keywords: Aggregation; Amyotrophic lateral sclerosis; Drosophila; Frontotemporal dementia; Importin; Nuclear pore; Nucleocytoplasmic transport; Prion-like domain; TDP-43.


Conflict of interest statement

The authors declare they have no financial competing interests. BK and WR are co-inventors on a patent relating to the content of the manuscript.

Figures

Fig. 1
Fig. 1
KPNB1 and other nuclear import receptors (NIRs) reduce the pathological aggregation of TDP-CTF. a Immunofluorescence of SH-SY5Y human neuroblastoma cells co-expressing mCherry or mCherry-TDP-CTF with GFP or one of 27 GFP-tagged α-importins, β-importins, and exportins. Based on this microscopy screen, transport proteins were divided in four categories according to their activity towards TDP-CTF aggregates: “no effect on aggregation”, “co-aggregation”, “reduced aggregation” (=transport proteins that only reduce the size of TDP-CTF aggregates), and “abolished aggregation” which includes most β-importins. Arrowheads indicate co-aggregation. Hoechst staining was used to outline nuclei. Scale bar: 5 μm. b Western blot analysis and quantification of insoluble mCherry-TDP-CTF protein levels in SH-SY5Y cells expressing GFP or one of each 27 GFP-tagged α-importins, β-importins, and exportins. Several β-importin family NIRs significantly reduced insoluble TDP-CTF levels, including KPNB1, IPO3/TNPO2, IPO4, IPO9, and IPO13. KPNB1 (in bold) was used as a reference. β-tubulin was used as a loading control. Statistical analysis was performed using one-way ANOVA and Bonferroni’s post hoc test (*p < 0.05, **p < 0.01, ***p < 0.001, n = 3)
Fig. 2
Fig. 2
The N-terminal half of KPNB1 is required and sufficient to reduce TDP-CTF aggregation and toxicity. a (Top) Schematic domain structure of the N-terminal half (HEAT repeats 1–9, H1–9) and C-terminal half (HEAT repeats 10–19, H10–19) of KPNB1. (Bottom) Immunofluorescence (IF) of SH-SY5Y cells co-expressing mCherry or mCherry-TDP-CTF with GFP, GFP-KPNB1 full-length (FL), H1–9 or H10–19. Both full-length and the N-terminal half of KPNB1 reduce TDP-CTF aggregation, whereas the C-terminal half of KPNB1 co-aggregates with TDP-CTF in the cytoplasm. Arrowheads indicate co-aggregation. Hoechst staining was used to outline nuclei. Scale bar: 5 μm. b Western blot analysis and quantification of insoluble mCherry-TDP-CTF protein levels in SH-SY5Y cells expressing GFP, GFP-KPNB1 full-length (FL), H1–9 or H10–19. Both full-length and the N-terminal half of KPNB1 significantly reduced insoluble TDP-CTF levels. β-tubulin was used as a loading control. Statistical analysis was performed using one-way ANOVA and Bonferroni’s post hoc test (**p < 0.01, ***p < 0.001, n = 4). c Quantification of TDP-CTF-induced cytotoxicity upon overexpression of KPNB1. mCherry or mCherry-TDP-CTF were co-expressed in SH-SY5Y cells with GFP, GFP-KPNB1 full-length (FL), H1–9 or H10–19. Forty-eight hours after transfection, cells were labelled with the Live-or-Dye™ 640/662 dye and dying cells were quantified for each group. Both full-length and the N-terminal half of KPNB1 significantly ameliorated TDP-CTF-mediated toxicity. Statistical analysis was performed with two-way ANOVA and Bonferroni’s post hoc test (four independent experiments; ***p < 0.001. mCherry: GFP (n = 400), GFP-KPNB1FL (n = 405), GFP-KPNB1H1–9 (n = 426), GFP-KPNB1H10–19 (n = 406); mCherry-TDP-CTF: GFP (n = 405), GFP-KPNB1FL (n = 401), GFP-KPNB1H1–9 (n = 405), GFP-KPNB1H10–19 (n = 400)). d IF of SH-SY5Y cells co-expressing mCherry or mCherry-TDP-CTF with GFP-KPNB1 H1–9 or C-terminal deletion constructs. TDP-CTF appeared nucleocytoplasmic with KPNB1 H1–9 and H1–8, while it formed small aggregates in presence of KPNB1 H1–7 or H1–6. Arrowheads indicate co-aggregation. Hoechst staining was used to outline nuclei. Scale bar: 5 μm. e, Western blot analysis and quantification of insoluble mCherry-TDP-CTF protein levels in SH-SY5Y cells expressing GFP, GFP-KPNB1 full-length (FL), H1–9 or C-terminal deletion constructs. KPNB1 H1–8 was the most active fragment in reducing insoluble TDP-CTF levels. β-actin was used as a loading control. Statistical analysis was performed using one-way ANOVA and Bonferroni’s post hoc test (*p < 0.05, **p < 0.01, ***p < 0.001, n = 4)
Fig. 3
Fig. 3
KPNB1-mediated reduction of TDP-CTF and TDP-43 aggregates depends on its FG-Nup interaction domain. a Schematic domain structure of KPNB1. KPNB1 is comprised of 19 HEAT repeats (H1–19). RanGTP and importin-α interact with H1–8 and H8–19, respectively. FG-Nups bind to two regions of KPNB1, H5–7 and H14–16. b Lysates from HEK293T cells expressing GFP, GFP-KPNB1 full-length (FL), N-terminal fragments of KPNB1 (H1–9…H1) or the C-terminal fragment of KPNB1 (H10–19) were subjected to immunoprecipitation with GFP-Trap magnetic beads. Whole cell lysates (input) and immunoprecipitates (IP) were subjected to western blot analysis using indicated antibodies. KPNB1 H1–8, the smallest fully active KPNB1 fragment in reducing TDP-43 aggregation, strongly interacts with FG-Nups and Ran, and weakly with importin-α1 in comparison with full-length KPNB1. c (Top) Schematic domain structure of KPNB1 H1–8mNIS harboring four missense mutations (I178A, F217A, Y255A, I263R) in the nucleoporin-interacting site (NIS). (Bottom) Lysates from HEK293T cells expressing GFP, GFP-KPNB1 H1–8WT or H1–8mNIS were subjected to immunoprecipitation with GFP-Trap magnetic beads. Whole cell lysates (input) and immunoprecipitates (IP) were subjected to western blot analysis using indicated antibodies. KPNB1 H1–8mNIS shows strongly reduced interaction with FG-Nups. d Immunofluorescence (IF) of SH-SY5Y cells co-expressing mCherry or mCherry-TDP-CTF with GFP-KPNB1 H1–8WT or H1–8mNIS. KPNB1 H1–8mNIS does not reduce cytoplasmic TDP-CTF aggregates. Hoechst staining was used to outline nuclei. Scale bar: 5 μm. e Western blot analysis and quantification of insoluble mCherry-TDP-CTF in SH-SY5Y cells expressing GFP, GFP-KPNB1 H1–8WT or H1–8mNIS. KPNB1 H1–8WT strongly decreased insoluble TDP-CTF levels, whereas KPNB1 H1–8mNIS did not. β-tubulin was used as a loading control. Statistical analysis was performed using one-way ANOVA and Bonferroni’s post hoc test (**p < 0.01, ***p < 0.001, n = 4). f IF of HEK293T cells co-expressing GFP-(GR)100 with an empty plasmid (ctrl), FLAG-tagged KPNB1 H1–8WT or H1–8mNIS and stained for endogenous TDP-43. Unlike KPNB1 H1–8mNIS, KPNB1 H1–8WT prevents the sequestration of endogenous TDP-43 in cytoplasmic GR aggregates. Arrowheads point to cytoplasmic GR aggregates. Hoechst staining was used to outline nuclei. Scale bar: 5 μm. g Quantification of the percentage of cells with cytoplasmic GR aggregates positive for endogenous TDP-43. KPNB1 H1–8WT significantly reduced the number of TDP-43-positive GR aggregates, while KPNB1 H1–8mNIS had no effect. Statistical analysis was performed using one-way ANOVA and Bonferroni’s post hoc test (three independent experiments; *p < 0.05, ***p < 0.001, n = 50–52 cells per group). h IF of HEK293T cells co-expressing GFP-(GR)100 with an empty plasmid (ctrl), FLAG-tagged KPNB1 H1–8WT or H1–8mNIS and stained for endogenous Nup62. Unlike KPNB1 H1–8mNIS, KPNB1 H1–8WT prevents the sequestration of endogenous Nup62 in cytoplasmic GR aggregates. Arrowheads point to cytoplasmic GR aggregates. Hoechst staining was used to outline nuclei. Scale bar: 5 μm. i Quantification of the percentage of cells with cytoplasmic GR aggregates positive for endogenous Nup62. KPNB1 H1–8WT significantly reduced the number of Nup62-positive GR aggregates, while KPNB1 H1–8mNIS had no effect. Statistical analysis was performed using one-way ANOVA and Bonferroni’s post hoc test (three independent experiments; ***p < 0.001, n = 50–51 cells per group)
Fig. 4
Fig. 4
Nup62 co-aggregates with TDP-43 PrLD and recruits KPNB1 to facilitate reduction of aggregation. a Immunofluorescence (IF) of HEK293T cells co-expressing GFP-tagged TDP-CTF, sTDP or TDP-43mNLS with mCherry or mCherry-KPNB1. KPNB1 abolished TDP-CTF and TDP-43mNLS aggregates, whereas sTDP aggregates were only reduced in size. Hoechst staining was used to outline nuclei. Scale bar: 5 μm. b Western blot analysis and quantification of insoluble GFP-tagged TDP-CTF, sTDP and TDP-43mNLS in HEK293T cells expressing mCherry or mCherry-KPNB1. KPNB1 strongly reduced insoluble TDP-CTF and TDP-43mNLS protein levels, and sTDP levels to a lesser extent. β-actin was used as a loading control. Statistical analysis was performed using two-way ANOVA and Bonferroni’s post hoc test (*p < 0.05, ***p < 0.001, n = 3). c IF of HEK293T cells co-expressing mCherry or Nup62-mCherry with GFP or GFP-tagged TDP-CTF, TDP-43mNLS, TDP-43mNLS 1–265, TDP-PrLD or sTDP. TDP-CTF and TDP-43mNLS strongly colocalize with Nup62 via their PrLD, whereas sTDP lacking this domain does not. Arrowheads indicate co-aggregation. Hoechst staining was used to outline nuclei. Scale bar: 5 μm. d Lysates from HEK293T cells expressing GFP, GFP-TDP-CTF or GFP-sTDP were subjected to immunoprecipitation with GFP-Trap magnetic beads. Whole cell lysates (input) and immunoprecipitates (IP) were subjected to western blot analysis using indicated antibodies. Unlike sTDP, TDP-CTF strongly interacts with endogenous Nup62 and KPNB1. e IF of HEK293T cells co-expressing mCherry/Nup62-mCherry/mCherry-Nup85, GFP-TDP-CTF/GFP-sTDP and FLAG-KPNB1. Nup62 recruits KPNB1 to TDP-CTF but not sTDP aggregates. Nup85 which lacks FG repeats does not recruit KPNB1 to either TDP-CTF or sTDP, although it colocalizes with both aggregates. Arrowheads indicate co-aggregation. Hoechst staining was used to outline nuclei. Scale bar: 5 μm. f Dissolution assays for fluorophore-labeled recombinant His6-tagged TDP-CTF (ATTO488) and Nup62FG (ATTO610) co-aggregates in the presence of BSA or GST-tagged KPNB1 WT, KPNB1 mNIS, H1–9WT or H1–9mNIS. KPNB1 and H1–9 WT strongly dissolved TDP-CTF–Nup62 aggregates, whereas NIS mutations abolished this activity. g Quantification of dissolution of pre-formed aggregates (top) and prevention of aggregation (bottom) assays of TDP-CTF in the presence or absence of Nup62FG and different KPNB1 constructs. Optical density at 395 nm was measured to assess turbidity. Statistical analysis was performed using one-way ANOVA and Bonferroni’s post hoc test (*p < 0.05, **p < 0.005, ***p < 0.001, n = 3). h IF of HEK293T cells co-expressing Nup62-mCherry with GFP or GFP-tagged KPNB1WT, KPNB1mNIS, KPNB1 H1–8WT or H1–8mNIS. KPNB1WT associated with Nup62 aggregates and strongly reduced their size, whereas KPNB1 H1–8WT rendered Nup62 completely soluble. Arrowheads indicate co-aggregation. Hoechst staining was used to outline nuclei. Scale bar: 5 μm. i IF of HEK293T cells co-expressing Nup62-mCherry with GFP or GFP-tagged IPO13, TNPO1, XPO1, XPO7 or RANBP17. IPO13 associated with Nup62 aggregates and strongly reduced their size. TNPO1 and exportins co-aggregated with Nup62 but only TNPO1 slightly reduced individual aggregate size. Arrowheads indicate co-aggregation. Hoechst staining was used to outline nuclei. Scale bar: 5 μm
Fig. 5
Fig. 5
The Drosophila KPNB1 ortholog Ketel reduces human TDP-43 pathology and toxicity in fly models of TDP-43 proteinopathy. a Eye phenotypes from flies expressing the indicated transgenes via the eye-specific Gmr-Gal4 driver. Ketel knock-down (RNAi) enhances TDP-43-induced neurodegeneration whereas its overexpression (V5-Ketel) rescues it. Statistical analysis was performed using one-way ANOVA and Bonferroni’s post hoc test (**p < 0.01, ***p < 0.001, n ≥ 4). b Immunostaining of phosphorylated TDP-43M337V (pTDP-43) in adult fly brains treated with RU486 (40 μg/ml). This conditional Drosophila model of TDP-43 proteinopathy is based on expression of mutant human TDP-43M337V under the control of the Elav-GS driver in adult flies upon administration of RU486. Ketel RNAi enhances and extends the accumulation of pTDP-43-positive aggregates in the fly brain (arrowheads), compared to LacZ control (arrows), whereas overexpression of V5-Ketel dramatically reduces the pTDP-43 staining. c Locomotion assays on flies expressing mutant TDP-43M337V under the control of the Elav-GS driver in the presence or absence of RU486. Ketel downregulation enhances mutant TDP-43-induced locomotor dysfunction in adult flies, whereas Ketel overexpression rescues it. Locomotion was assessed with the DAM2 activity monitor from TriKinetics, Inc. Statistical analysis was performed using two-way ANOVA and Bonferroni’s post hoc test (***p < 0.001, n = 13). d Survival curves of flies expressing the indicated transgenes under the control of the Elav-GS driver in the presence of the drug RU486. Flies co-expressing TDP-43M337V with the innocuous transgene LacZ have a dramatic lifespan reduction in the presence of RU486 (blue line) compared to flies lacking mutant TDP-43 (gray line). Co-expression of Ketel (green line) improves this phenotype, whereas a Ketel RNAi transgene (red line) exacerbates it. Survival analysis was performed using the OASIS online tool, and p-values were calculated using Fisher’s exact test (**p < 0.01 and ****p < 0.0001, n = 80). e Immunofluorescence (IF) of HEK293T cells co-expressing GFP or GFP-TDP-43mNLS with mScarlet or mScarlet-tagged Ketel full-length (FL), H1–9 or H10–19. Both full-length and the N-terminal half of Ketel reduce human TDP-43mNLS aggregation and cytoplasmic mislocalization, whereas the C-terminal half of Ketel co-aggregates with TDP-43mNLS. Arrowheads indicate co-aggregation. Hoechst staining was used to outline nuclei. Scale bar: 5 μm. f IF of HEK293T cells co-expressing GFP-Ketel with mCherry or Nup62-mCherry. While Ketel is mostly nuclear with mCherry, it strongly colocalizes with Nup62-mCherry aggregates in the cytoplasm. Arrowheads indicate co-aggregation. Hoechst staining was used to outline nuclei. Scale bar: 5 μm
Fig. 6
Fig. 6
KPNB1 promotes nuclear localization of TDP-43mNLS in primary neurons and mouse brain tissue. a Immunofluorescence (IF) of primary cortical neurons co-expressing NLS-mTagBFP (nuclear marker), HaloTag (cell marker), GFP or GFP-tagged TDP-43WT/TDP-43mNLS/TDP-CTF and mScarlet/mScarlet-KPNB1. KPNB1 increased the nuclear localization of TDP-43mNLS and TDP-CTF. Scale bar: 25 μm. b Quantitative analysis of the N-to-C ratio of GFP or GFP-tagged TDP-43WT, TDP-43mNLS or TDP-CTF in primary neurons expressing mScarlet or mScarlet-KPNB1 72 h post-transfection. Statistical analysis was performed using one-way ANOVA and Bonferroni’s post hoc test (**p < 0.01, ***p < 0.001, n = 52–264 neurons per group). c IF of HEK293T cells co-expressing GFP-TDP-43mNLS with mCherry or mCherry-tagged KPNB1 full-length (FL) or its fragments. KPNB1 FL, H1–9 and H1–8 constructs increase the nuclear localization of TDP-43mNLS. Arrowheads point to co-aggregation. Hoechst staining was used to outline nuclei. Scale bar: 5 μm. d Quantification of the percentage of HEK293T cells exhibiting nuclear (N), nucleocytoplasmic (NC) or cytoplasmic (C) GFP-TDP-43mNLS distribution upon expression of different mCherry-KPNB1 constructs. Statistical analysis was performed using two-way ANOVA and Bonferroni’s post hoc test (three independent experiments; n = 66–81 cells per group; statistics are summarized in Supplementary Table 2). e IF of mouse brain slice cultures (DIV12) co-expressing AAV-GFP-TDP-43mNLS with AAV-FLAG-mCherry or AAV-FLAG-KPNB1 H1–9WT, H1–9mNIS, H1–8WT, H1–8mNIS or H10–19. KPNB1 H1–9WT and H1–8WT increase the nuclear localization of TDP-43mNLS, whereas NIS mutations abolished this effect. Hoechst staining was used to outline nuclei. Scale bar: 50 μm. f Quantification of the percentage of neurons exhibiting nuclear (N), nucleocytoplasmic (NC) or cytoplasmic (C) GFP-TDP-43mNLS distribution upon expression of different AAV-KPNB1 constructs. Statistical analysis was performed using two-way ANOVA and Bonferroni’s post hoc test (three independent experiments; n = 150–154 neurons per group; statistics are summarized in Supplementary Table 2)
Fig. 7
Fig. 7
Nup62 and KPNB1 colocalize with pathological pTDP-43 aggregates in human post-mortem brain and spinal cord tissue. Co-immunofluorescence (IF) staining was conducted in fixed spinal cord, posterior hippocampus, and motor cortex of neuropathologically diagnosed ALS and FTLD cases, respectively, and including unaffected control tissue. a,b High resolution co-IF staining of pTDP-43 (red) and Nup62 or KPNB1 (green) with Hoechst (blue) in spinal cord (ALS) and hippocampus (FTLD). Each image is shown as a panel of projected optical sections from each z-series for red and green channels and merged with Hoechst DNA staining. Volume rendered z-series of all channels are shown as the 3D inset. Scale bar: 5 μm. c,d Hippocampal tile scan images of Nup62 or KPNB1 co-IF with pTDP-43 aggregates in the sFTLD-B#1 case. Scale bar: 50 μm. e,f High resolution co-IF staining of pTDP-43 (red) and Nup62 or KPNB1 (green) with Hoechst (blue) in the motor cortex. Scale bar: 5 μm. g,h Cortical tile scan images of Nup62 or KPNB1 co-IF with pTDP-43 aggregates in TARDBP ALS case. Scale bar: 50 μm
Fig. 8
Fig. 8
A model for a novel role of KPNB1 and other NIRs as molecular chaperones for FG-Nup-containing assemblies. a KPNB1 facilitates nuclear transport by disengaging hydrophobic interactions between FG-repeats that form the hydrogel barrier within nuclear pore complexes. b KPNB1 prevents detrimental phase transition of FG-Nups and other aggregation-prone proteins that form cytoplasmic foci under cellular crowding conditions. c, KPNB1 is recruited into pathological FG-Nups and TDP-43 co-aggregates in an NLS-independent manner, counters their aberrant phase transition, and relocates TDP-43 into the nucleus. Similar mechanisms may apply to other NIRs. IDR: intrinsically disordered region; RRM: RNA-recognition motif; PrLD: prion-like domain. (Created with BioRender.com)

References

    1. Neumann M, Sampathu DM, Kwong LK, Truax AC, Micsenyi MC, Chou TT, et al. Ubiquitinated TDP-43 in frontotemporal lobar degeneration and amyotrophic lateral sclerosis. Science. 2006;314:130–133. doi: 10.1126/science.1134108. - DOI - PubMed
    1. Arai T, Hasegawa M, Akiyama H, Ikeda K, Nonaka T, Mori H, et al. TDP-43 is a component of ubiquitin-positive tau-negative inclusions in frontotemporal lobar degeneration and amyotrophic lateral sclerosis. Biochem Biophys Res Commun. 2006;351:602–611. doi: 10.1016/j.bbrc.2006.10.093. - DOI - PubMed
    1. Prasad A, Bharathi V, Sivalingam V, Girdhar A, Patel BK. Molecular mechanisms of TDP-43 Misfolding and pathology in amyotrophic lateral sclerosis. Front Mol Neurosci. 2019;12:25. doi: 10.3389/fnmol.2019.00025. - DOI - PMC - PubMed
    1. Ling SC, Polymenidou M, Cleveland DW. Converging mechanisms in ALS and FTD: disrupted RNA and protein homeostasis. Neuron. 2013;79:416–438. doi: 10.1016/j.neuron.2013.07.033. - DOI - PMC - PubMed
    1. Nelson PT, Dickson DW, Trojanowski JQ, Jack CR, Boyle PA, Arfanakis K, et al. Limbic-predominant age-related TDP-43 encephalopathy (LATE): consensus working group report. Brain. 2019;142:1503–1527. doi: 10.1093/brain/awz099. - DOI - PMC - PubMed

Publication types

LinkOut - more resources