. 2022 Dec 8;19(1):292.
doi: 10.1186/s12974-022-02655-z.

Microglial diversity along the hippocampal longitudinal axis impacts synaptic plasticity in adult male mice under homeostatic conditions

Affiliations

Microglial diversity along the hippocampal longitudinal axis impacts synaptic plasticity in adult male mice under homeostatic conditions

E De Felice et al. J Neuroinflammation. .

Abstract

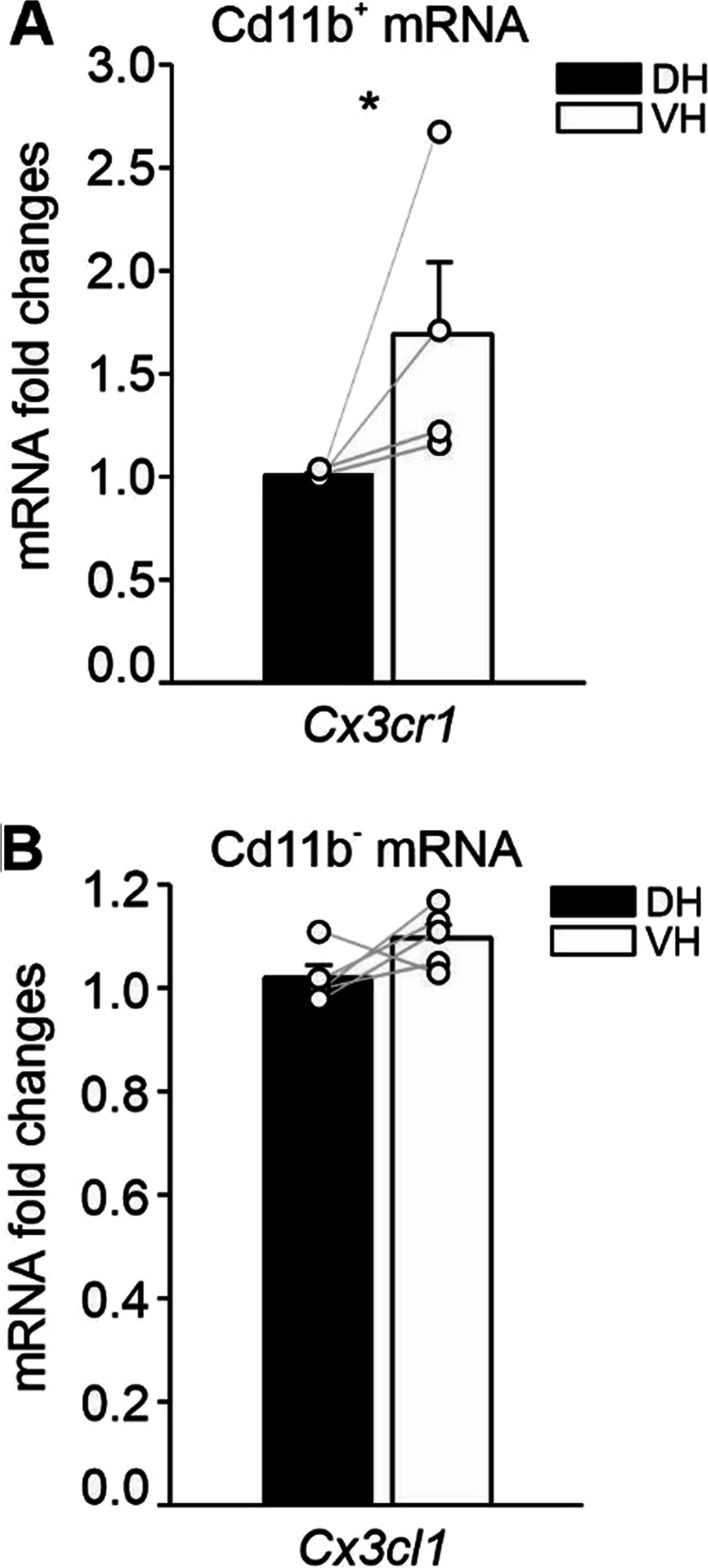
The hippocampus is a plastic brain area that shows functional segregation along its longitudinal axis, reflected by a higher level of long-term potentiation (LTP) in the CA1 region of the dorsal hippocampus (DH) compared to the ventral hippocampus (VH), but the mechanisms underlying this difference remain elusive. Numerous studies have highlighted the importance of microglia-neuronal communication in modulating synaptic transmission and hippocampal plasticity, although its role in physiological contexts is still largely unknown. We characterized in depth the features of microglia in the two hippocampal poles and investigated their contribution to CA1 plasticity under physiological conditions. We unveiled the influence of microglia in differentially modulating the amplitude of LTP in the DH and VH, showing that minocycline or PLX5622 treatment reduced LTP amplitude in the DH, while increasing it in the VH. This was recapitulated in Cx3cr1 knockout mice, indicating that microglia have a key role in setting the conditions for plasticity processes in a region-specific manner, and that the CX3CL1-CX3CR1 pathway is a key element in determining the basal level of CA1 LTP in the two regions. The observed LTP differences at the two poles were associated with transcriptional changes in the expression of genes encoding for Il-1, Tnf-α, Il-6, and Bdnf, essential players of neuronal plasticity. Furthermore, microglia in the CA1 SR region showed an increase in soma and a more extensive arborization, an increased prevalence of immature lysosomes accompanied by an elevation in mRNA expression of phagocytic markers Mertk and Cd68 and a surge in the expression of microglial outward K+ currents in the VH compared to DH, suggesting a distinct basal phenotypic state of microglia across the two hippocampal poles. Overall, we characterized the molecular, morphological, ultrastructural, and functional profile of microglia at the two poles, suggesting that modifications in hippocampal subregions related to different microglial statuses can contribute to dissect the phenotypical aspects of many diseases in which microglia are known to be involved.

Keywords: CX3CL1–CX3CR1 signaling; Cytokines; Dorsal hippocampus; K+ current; LTP; Microglial morphology; Microglial ultrastructure; Ventral hippocampus.


Conflict of interest statement

The authors have no conflict of interest or competing interests to declare.

Figures

Fig. 1
Fig. 1
Hippocampal LTP in the two poles is influenced by microglia. Time course of normalized averaged amplitudes of fEPSPs recorded from CA1 region of dorsal and ventral hippocampal slices in A control, B minocycline, C PLX5622, D Cx3cr1−/− groups following Schaffer collateral high-frequency stimulation (HFS, 2 trains of stimuli at 100 Hz of 1 s duration each, 3 s inter-train interval, arrow). Symbols represent mean ± S.E.M. of normalized fEPSP amplitude evoked every 20 s. Above are representative traces taken before (grey) and after (black) HFS from each region. Comparison of the mean LTP amplitude, recorded at 35 min after HFS, between experimental groups in dorsal (E) and ventral (F) hippocampus. Dots represent individual slices. Statistical significance was assessed by t-test and one-way ANOVA, Holm–Sidak for post hoc comparison. *p < 0.05, **p < 0.01, ***p < 0.001
Fig. 2
Fig. 2
Paired-pulse ratio (PPR) is not affected by microglia. Bar histograms represent averaged PPR values for dorsal (A) and ventral (B) hippocampus in all experimental conditions. Above, fEPSP representative traces of PPR from DH and VH in all experimental conditions, scale bars: 0.2 mV, 10 ms. Data are shown as mean ± S.E.M., dots represent values from single slice. Note that PPR in the VH is reduced compared to the DH for all experimental conditions (***p < 0.001 not shown). Statistical significance was assessed using one-way ANOVA, Holm–Sidak for post hoc comparison
Fig. 3
Fig. 3
CX3CR1 is overexpressed in CD11b+ cells from VH versus DH. A RT-PCR of Cx3cr1 gene expression on CD11b+ cells sorted from DH and VH of CTRL mice. B RT-PCR of Cx3cl1 gene expression on CD11b cells sorted from DH and VH of CTRL mice. Data are shown as mean ± S.E.M. with dots representing values from single mice. Statistical significance was assessed using paired t-test. *p < 0.05
Fig. 4
Fig. 4
Molecules involved in plasticity are differentially expressed in the two hippocampal poles. Gene expression of Il-1β, Tnf-α, Il-6 and Bdnf in total mRNA extracted from the whole dorsal and ventral hippocampus (A), in CD11b+ cells (B), and CD11b cells (C) sorted from DH and VH of CTRL mice. Data are shown as mean ± S.E.M., dots represent values from single mice. Statistical significance was assessed by paired t-test. *p < 0.05, **p < 0.01, ***p ≤ 0.001
Fig. 5
Fig. 5
Variations in microglial density and distribution in the DH versus VH CA1 stratum radiatum. Representative brightfield images at a ×20 magnification illustrating IBA1+ microglia in the DH (A) and VH (B) CA1 SR. The DH had a higher microglial density compared to the VH (C). Accordingly, the NND was decreased (D) and the spacing index also differed between the two hippocampal poles (E). Data are expressed as mean ± S.E.M. Statistical significance was assessed using a paired Student’s t-test (n = 6 mice). *p-value < 0.1, **p-value < 0.01, and ***p-value < 0.001. a.u.: arbitrary units; DH: dorsal hippocampus; Lac-mol: stratum lacunosum-moleculare; NND: nearest neighbor distance; Rad: stratum radiatum; S.E.M.: standard error of the mean; SP: pyramidal cell layer; VH: ventral hippocampus
Fig. 6
Fig. 6
Variations in microglial morphology and ultrastructure in the DH versus VH CA1 stratum radiatum. Representative brightfield images at a ×40 magnification showing IBA1+ microglia in the dorsal (A) and ventral (B) CA1 stratum radiatum (SR). The soma (C) and manual arbor perimeters (D), as well as the automatic arbor solidity (E), manual arbor circularity (F) and lacunarity (G), were calculated for IBA1+ cells in the DH and VH using brightfield microscopy (n = 6 mice). The mean relative number of microglial cell bodies containing immature (H) and mature (I) lysosomes per animal were determined using scanning electron microscopy (SEM) (n = 4 mice). Representative SEM of microglia in the dorsal (J, K) and ventral (L, M) CA1 SR. SEM images are pseudocolored as follows: light blue, microglia; grey, microglial nucleus; green, extracellular digestions; beige, dendritic spine; pink, axon terminal; dark blue, altered mitochondria; purple, immature lysosomes; and yellow, mature lysosomes. Data are expressed as mean ± S.E.M. For normally distributed data, two-tailed paired Student’s t-test was used (C, D, FI), while for non-normally distributed data the paired Wilcoxon test was used (E). Levels of significance were set to: *p < 0.05, **p < 0.01
Fig. 7
Fig. 7
Phagocytic markers expression is increased in VH compared to DH. Gene expression of the phagocytic marker Trem2, Mertk and Cd68 in total mRNA extracted from dorsal and ventral hippocampus (A), and in CD11b+ cells (B) sorted from the DH and the VH of CTRL mice. Data are shown as mean ± S.E.M., dots represent values from single mice. Statistical significance was assessed using paired t-test. *p < 0.05
Fig. 8
Fig. 8
Outward K+ currents are enhanced in VH. A Representative steps and recordings from DH and VH microglia (odd sweeps were selected for graphical reasons). B Current–voltage relationship and C current densities–voltage relationship evoked in GFP+ microglia cells by voltage steps from − 150 to + 70 mV starting from the holding potential of − 70 mV. Mean histograms (± S.E.M.), with dots representing values from single cell of capacitance (D), input resistance (E), and resting membrane potential (F) measured from DH and VH microglia (n = 38 and 40, respectively). Statistical significance was assessed by two-way ANOVA RM. *p < 0.05

References

    1. Papatheodoropoulos C. Electrophysiological evidence for long-axis intrinsic diversification of the hippocampus. Front Biosci Landmark Ed. 2018;23(1):109–145. doi: 10.2741/4584. - DOI - PubMed
    1. Strange BA, Witter MP, Lein ES, Moser EI. Functional organization of the hippocampal longitudinal axis. Nat Rev Neurosci. 2014;15(10):655–669. doi: 10.1038/nrn3785. - DOI - PubMed
    1. Hargreaves EL, Rao G, Lee I, Knierim JJ. Major dissociation between medial and lateral entorhinal input to dorsal hippocampus. Science. 2005;308(5729):1792–1794. doi: 10.1126/science.1110449. - DOI - PubMed
    1. Lee H, Wang C, Deshmukh SS, Knierim JJ. Neural population evidence of functional heterogeneity along the CA3 transverse axis: pattern completion vs. pattern separation. Neuron. 2015;87(5):1093–1105. doi: 10.1016/j.neuron.2015.07.012. - DOI - PMC - PubMed
    1. Nadel L. Dorsal and ventral hippocampal lesions and behavior. Physiol Behav. 1968;3(6):891–900. doi: 10.1016/0031-9384(68)90174-1. - DOI