Comparative epigenomics reveals the impact of ruminant-specific regulatory elements on complex traits
- PMID: 36482458
- PMCID: PMC9730597
- DOI: 10.1186/s12915-022-01459-0
Comparative epigenomics reveals the impact of ruminant-specific regulatory elements on complex traits
Abstract
Background: Insights into the genetic basis of complex traits and disease in both human and livestock species have been achieved over the past decade through detection of genetic variants in genome-wide association studies (GWAS). A majority of such variants were found located in noncoding genomic regions, and though the involvement of numerous regulatory elements (REs) has been predicted across multiple tissues in domesticated animals, their evolutionary conservation and effects on complex traits have not been fully elucidated, particularly in ruminants. Here, we systematically analyzed 137 epigenomic and transcriptomic datasets of six mammals, including cattle, sheep, goats, pigs, mice, and humans, and then integrated them with large-scale GWAS of complex traits.
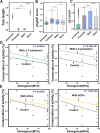
Results: Using 40 ChIP-seq datasets of H3K4me3 and H3K27ac, we detected 68,479, 58,562, 63,273, 97,244, 111,881, and 87,049 REs in the liver of cattle, sheep, goats, pigs, humans and mice, respectively. We then systematically characterized the dynamic functional landscapes of these REs by integrating multi-omics datasets, including gene expression, chromatin accessibility, and DNA methylation. We identified a core set (n = 6359) of ruminant-specific REs that are involved in liver development, metabolism, and immune processes. Genes with more complex cis-REs exhibited higher gene expression levels and stronger conservation across species. Furthermore, we integrated expression quantitative trait loci (eQTLs) and GWAS from 44 and 52 complex traits/diseases in cattle and humans, respectively. These results demonstrated that REs with different degrees of evolutionary conservation across species exhibited distinct enrichments for GWAS signals of complex traits.
Conclusions: We systematically annotated genome-wide functional REs in liver across six mammals and demonstrated the evolution of REs and their associations with transcriptional output and conservation. Detecting lineage-specific REs allows us to decipher the evolutionary and genetic basis of complex phenotypes in livestock and humans, which may benefit the discovery of potential biomedical models for functional variants and genes of specific human diseases.
Keywords: Epigenetic regulation; GWAS enrichment; Liver; Regulatory elements; Ruminant evolution.
© 2022. The Author(s).
Conflict of interest statement
The authors declare that they have no competing interests.
Figures


Similar articles
-
Cross-Species Comparative DNA Methylation Reveals Novel Insights into Complex Trait Genetics among Cattle, Sheep, and Goats.Mol Biol Evol. 2024 Feb 1;41(2):msae003. doi: 10.1093/molbev/msae003. Mol Biol Evol. 2024. PMID: 38266195 Free PMC article.
-
Comparative epigenetics of domestic animals: focusing on DNA accessibility and its impact on gene regulation and traits.J Vet Sci. 2025 Jan;26(1):e9. doi: 10.4142/jvs.24259. J Vet Sci. 2025. PMID: 39901471 Free PMC article. Review.
-
Epigenomics and genotype-phenotype association analyses reveal conserved genetic architecture of complex traits in cattle and human.BMC Biol. 2020 Jul 3;18(1):80. doi: 10.1186/s12915-020-00792-6. BMC Biol. 2020. PMID: 32620158 Free PMC article.
-
Pig genome functional annotation enhances the biological interpretation of complex traits and human disease.Nat Commun. 2021 Oct 6;12(1):5848. doi: 10.1038/s41467-021-26153-7. Nat Commun. 2021. PMID: 34615879 Free PMC article.
-
Fine mapping with epigenetic information and 3D structure.Semin Immunopathol. 2022 Jan;44(1):115-125. doi: 10.1007/s00281-021-00906-4. Epub 2022 Jan 12. Semin Immunopathol. 2022. PMID: 35022890 Free PMC article. Review.
Cited by
-
Cross-Species Comparative DNA Methylation Reveals Novel Insights into Complex Trait Genetics among Cattle, Sheep, and Goats.Mol Biol Evol. 2024 Feb 1;41(2):msae003. doi: 10.1093/molbev/msae003. Mol Biol Evol. 2024. PMID: 38266195 Free PMC article.
-
Comparative epigenetics of domestic animals: focusing on DNA accessibility and its impact on gene regulation and traits.J Vet Sci. 2025 Jan;26(1):e9. doi: 10.4142/jvs.24259. J Vet Sci. 2025. PMID: 39901471 Free PMC article. Review.
-
PigBiobank: a valuable resource for understanding genetic and biological mechanisms of diverse complex traits in pigs.Nucleic Acids Res. 2024 Jan 5;52(D1):D980-D989. doi: 10.1093/nar/gkad1080. Nucleic Acids Res. 2024. PMID: 37956339 Free PMC article.
-
Genetic and Epigenetic Adaptation Mechanisms of Sheep Under Multi-Environmental Stress Environment.Int J Mol Sci. 2025 Apr 1;26(7):3261. doi: 10.3390/ijms26073261. Int J Mol Sci. 2025. PMID: 40244095 Free PMC article. Review.
-
Genetic advancements and future directions in ruminant livestock breeding: from reference genomes to multiomics innovations.Sci China Life Sci. 2025 Apr;68(4):934-960. doi: 10.1007/s11427-024-2744-4. Epub 2024 Nov 26. Sci China Life Sci. 2025. PMID: 39609363 Review.
References
-
- Deelen J, Uh H-W, Monajemi R, van Heemst D, Thijssen PE, Böhringer S, van den Akker EB, de Craen AJM, Rivadeneira F, Uitterlinden AG, et al. Gene set analysis of GWAS data for human longevity highlights the relevance of the insulin/IGF-1 signaling and telomere maintenance pathways. AGE. 2013;35(1):235–249. doi: 10.1007/s11357-011-9340-3. - DOI - PMC - PubMed
-
- Al-Mamun HA, Kwan P, Clark SA, Ferdosi MH, Tellam R, Gondro C. Genome-wide association study of body weight in Australian Merino sheep reveals an orthologous region on OAR6 to human and bovine genomic regions affecting height and weight. Genet Sel Evol. 2015;47(1):66. doi: 10.1186/s12711-015-0142-4. - DOI - PMC - PubMed
MeSH terms
Grants and funding
LinkOut - more resources
Full Text Sources
Molecular Biology Databases
Miscellaneous

