. 2022 Dec 8;24(1):88.
doi: 10.1186/s13058-022-01585-1.

Identification of a novel ER-NFĸB-driven stem-like cell population associated with relapse of ER+ breast tumors

Affiliations

Identification of a novel ER-NFĸB-driven stem-like cell population associated with relapse of ER+ breast tumors

Svetlana E Semina et al. Breast Cancer Res. .

Abstract

Background: Up to 40% of patients with estrogen receptor-positive (ER+) breast cancer experience relapse. This can be attributed to breast cancer stem cells (BCSCs), which are known to be involved in therapy resistance, relapse, and metastasis. Therefore, there is an urgent need to identify genes/pathways that drive stem-like cell properties in ER+ breast tumors.

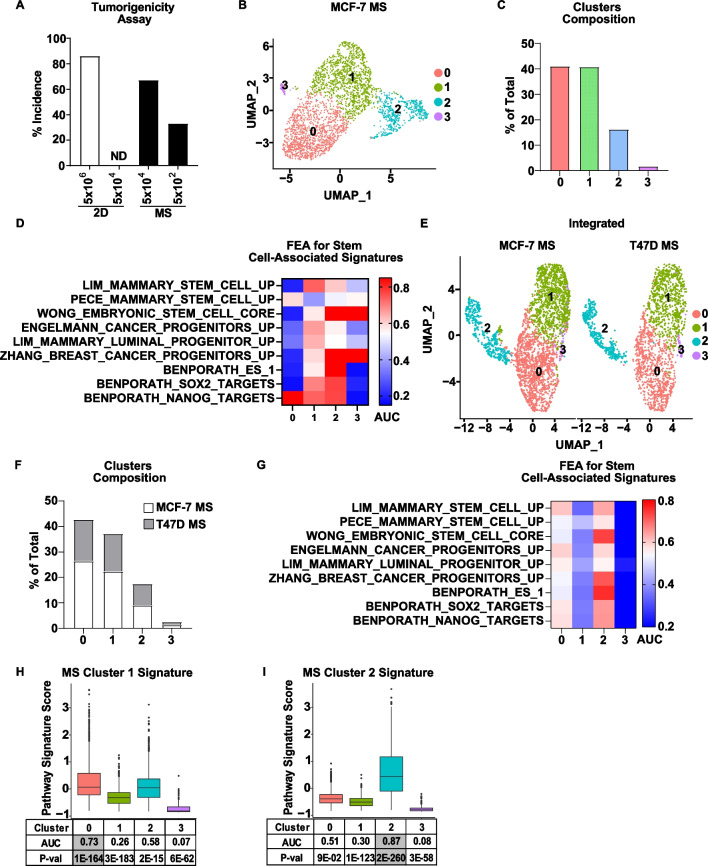
Methods: Using single-cell RNA sequencing and various bioinformatics approaches, we identified a unique stem-like population and established its clinical relevance. With follow-up studies, we validated our bioinformatics findings and confirmed the role of ER and NFĸB in the promotion of stem-like properties in breast cancer cell lines and patient-derived models.

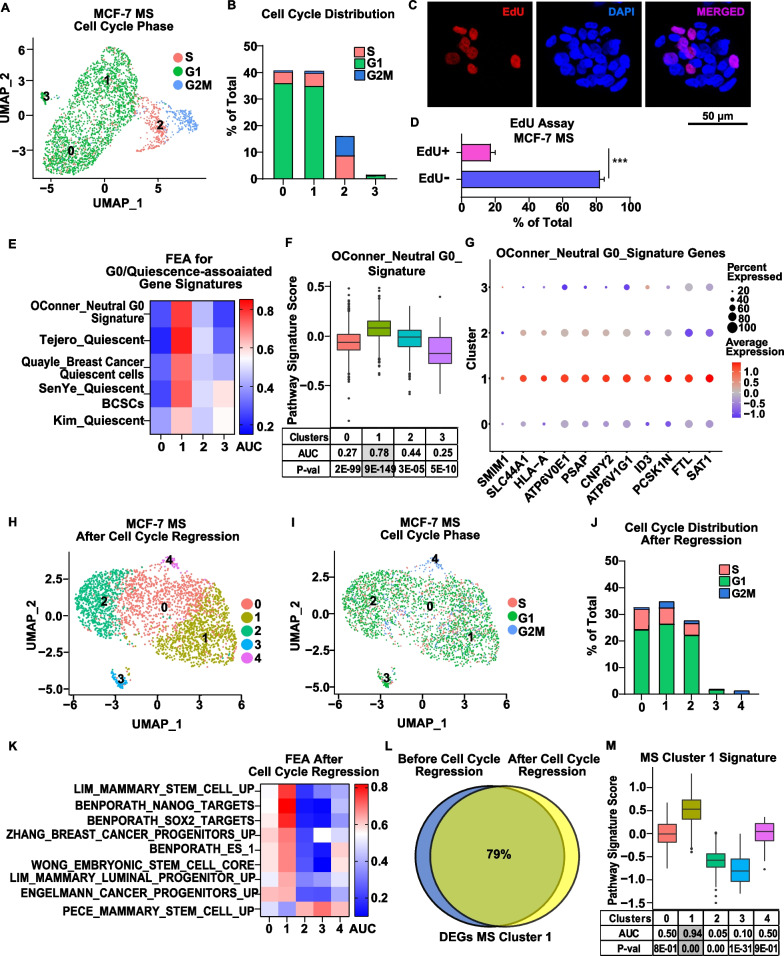
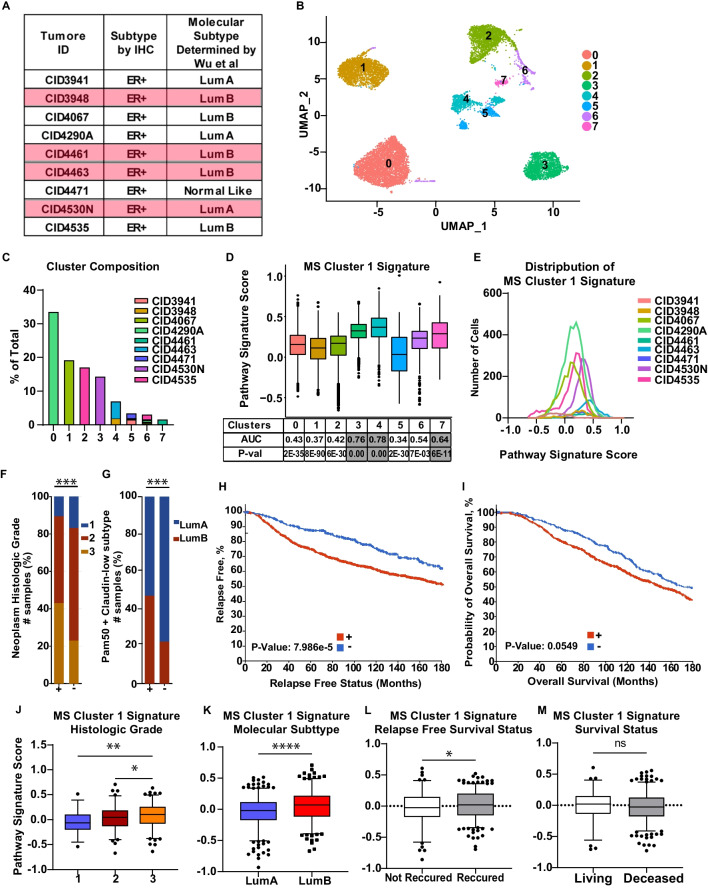
Results: We identified a novel quiescent stem-like cell population that is driven by ER and NFĸB in multiple ER+ breast cancer models. Moreover, we found that a gene signature derived from this stem-like population is expressed in primary ER+ breast tumors, endocrine therapy-resistant and metastatic cell populations and predictive of poor patient outcome.

Conclusions: These findings indicate a novel role for ER and NFĸB crosstalk in BCSCs biology and understanding the mechanism by which these pathways promote stem properties can be exploited to improve outcomes for ER+ breast cancer patients at risk of relapse.

Keywords: Breast cancer; Estrogen receptor; NFĸB; Single-cell RNA sequencing; Stem cells.


Conflict of interest statement

The authors declare they have no competing interests.

Figures

Fig. 1
Fig. 1
Single-cell RNA sequencing reveals two putative stem-like cell population clusters in mammospheres derived from ER+ breast cancer cell lines. A Different numbers of MCF-7 cells, cultured in standard 2D or mammosphere conditions, were injected into the mammary gland of athymic mice. The incidence of tumor formation was determined over 6 weeks. A significant difference in stem cell frequency, based on the tumor incidence per condition, was determined by ELDA (P < 0.05). ND, not detected. B scRNA-seq was conducted on MS derived from MCF-7 cells. Bi-dimensional representation of 2974 single-cell transcriptomes is shown (UMAP). C The percentage of cells in each cluster relative to the total number of cells is shown. D FEA was performed for stem cell-associated gene signatures from MsigDB. AUC values are shown in a heatmap, and P-values are presented in Additional file 2: Supplemental Table 3. E 5739 single-cell transcriptomes derived from MCF-7 MS and T47D MS were integrated and represented bi-dimensionally. F The distribution of MCF-7 and T47D cells in each cluster relative to the total cell number is shown. G FEA for stem cell-associated gene signatures was performed on the MCF-7 and T47D integrated dataset. AUC values are shown in a heatmap, and P-values are presented in Additional file 2: Supplemental Table 4. H, I FEA was performed for the gene signatures derived from the DEGs of MCF-7 MS Cluster 1 (H) and MCF-7 MS Cluster 2 (I) Signatures on the MCF-7 and T47D integrated dataset. Box plots show signatures scores per integrated cluster with significant AUC and P-values indicated in grey
Fig. 2
Fig. 2
MS Cluster 1 is a quiescent stem-like cluster. A, B Cell cycle analysis was performed on MCF-7 MS using the Cell Cycle Scoring vignette provided by Seurat. A Bi-dimensional representations of 2974 single-cell transcriptomes colored by cell cycle phase (UMAP) and B cell cycle distribution for each cluster are shown. C An EdU assay was performed on MCF-7 MS. Representative pictures of MS stained for EdU (red) and DAPI (blue) are shown (bar = 50 µm) (D) A bar chart of EdU+ and EdU- cells presented as a percent of total number of cells from 11 MS is shown. E, F FEA was performed on the MS MCF-7 dataset with G0/quiescence-associated gene signatures with one representative example shown in a box plot. A detailed description of signatures is presented in Additional file 2: S. Table 6.1. AUC values are shown in a heatmap, and P-values are presented in Additional file 2: Supplemental Table 6.2. G Expression of genes associated with G0/Quiescence are represented in dot plots, with color representing expression level and size representing the percentage of cells in the cluster expressing the gene. H Cell cycle regression was performed using the Cell Cycle Regression vignette by Seurat. I, J Cell cycle phase and distribution are indicated after cell cycle regression of the MCF-7 MS dataset. K FEA was performed on MS MCF-7 dataset after cell cycle regression for stem cell-associated gene signatures from MsigDB. AUC values are shown in a heatmap, and P-values are presented in Additional file 2: Supplemental Table 7. (L) A Venn diagram shows percent of common DEGs derived from the MS Cluster 1 before and after cell cycle regression. M FEA was performed for the original MCF-7 MS Cluster 1 Signature on the MS MCF-7 dataset after cell cycle regression
Fig. 3
Fig. 3
Integration of single-cell RNA sequencing datasets from MCF-7 cells cultured in standard 2D conditions and MS. A 5592 single-cell transcriptomes derived from 2D- and MS-cultured MCF-7 cells were integrated and represented bi-dimensionally. B The distribution of 2D- and MS-cultured MCF-7 cells in each cluster relative to the total cell number is indicated. C, D FEA was performed for the gene signatures derived from the DEGs of the original MS Cluster 1 (C) and MS Cluster 2 (D) on the integrated dataset. E Cell cycle distribution for each cluster as the percent of total cell number is indicated. F QPCR for the top DEGs of MS Cluster 1 and MS Cluster 2 was performed in MCF-7 cells cultured in 2D vs MS conditions. Data are presented as fold change (FC) normalized to 2D cells on a per gene basis. *P < 0.05, **P < 0.005, ***P < 0.001, ns not significant
Fig. 4
Fig. 4
ER and the NFĸB pathway are active in MS Cluster 1 and required for MS formation. A IPA network analysis was performed for DEGs of the original MS Cluster 1. Two central nodes were identified, ESR1 (P-val = 4.73E-9) and NFĸB complex (P-val = 3.72E-3). Expression of ESR1 and ER target genes (B) and NFĸB family members and NFĸB target genes (D) are presented in dot plots, with color representing expression level and size representing the percentage of cells in each cluster expressing the gene. FEA was performed for ER (C) and NFĸB (E) gene signatures from MsigDB. AUC values are shown in a heatmap, and P-values are presented in Additional file 2: Supplemental Table 8. F Correlation between Hallmark ER or Hallmark NFĸB signatures with other Hallmark gene signatures in MS Cluster 1 was calculated using Pearson’s Correlation function in RStudio software. Correlation values are shown in a heatmap and P-values are presented in Additional file 2: Supplemental Table 9. G FEA was performed for the Hallmark TGFβ pathway gene signature on MCF-7 MS Clusters. Box plot shows signature scores per cluster and table indicates AUC and P-values for each cluster. H Multiple linear regression analysis between Hallmark ER, NFĸB and TGFβ pathway gene signatures was performed for MS Cluster 1. Single cells individually placed in 3D graph with each axis representing the z-score for each pathway and each rectangle representing individual cells
Fig. 5
Fig. 5
Dual reporter cell lines identify an ER and NFĸB-driven stem-like cell population. A, B ERE-mCherry and NFĸB-RE-eGFP activity in 2D-cultured MCF-7 dual reporter cells treated with E2 (10 nM), hTNFα (10 ng/ml), ICI (1 µM) and/or IKK7 (1 µM) for 24 h was measured using a Celigo imaging cytometer. Bar charts represent the percentage of mCherry confluence (A) and eGFP (B) confluence normalized to total brightfield confluence for each treatment group. C ERE-mCherry and NFĸB-RE-eGFP activity in MCF-7 MS was measured over time. D A representative image of MS derived from MCF-7 dual reported cell line is shown (bar = 100 µm). E A schematic of sorting experiments performed on MS derived from the MCF-7 dual reporter cells is presented. F MS derived from MCF-7 dual reporter cells were collected, trypsinized and sorted for 4 cell populations, based on expression of fluorescent proteins eGFP and mCherry. A secondary MS assay was performed on 4 sorted populations and secondary MFE for each group is plotted. G Cell distribution of secondary MS is plotted for each group based on ERE-mCherry and NFĸB-RE-eGFP activity. H The expression of DEGs of MS Cluster was determined in each cell population by QPCR. Fold change, normalized to dual-negative cell population, for each gene is presented on a heatmap. K, L Distribution of z-scores for the Hallmark ER (I) and NFĸB (J) signatures are shown on a per cell basis. K Each cell from MS Cluster 1 was assigned to one of the groups based on z-scores for ER and NFĸB signatures: dual-negative cells (white), dual-positive cells (yellow), ER-active cells (red), NFĸB-active cells (green). The percent change in abundance of MS Cluster 1 relative to the total population for each group is shown. L A bar charts representing GFD15 mRNA expression in each sorted group in (K). M, P The role of GDF15 on secondary MS formation was examined using an anti-GDF-15 antibody (200 ng/ml) on 2 sorted cell population from: dual-positive (M) and ER-active (N). *P < 0.05, ***P < 0.001, ns not significant
Fig. 6
Fig. 6
The MS Cluster 1 signature is associated with more aggressive metastatic disease. A Single-cell transcriptomes from 4OHT-treated MCF-7 cells (GSE181812) and LTED (Long-Term Estrogen Deprived) MCF-7 cells (GSE122743) were integrated and represented bi-dimensionally. B The distribution of 4OHT-treated MCF-7 cells and LTED MCF-7 cells in each cluster relative to the total cell number is shown. C FEA was performed on integrated datasets for the MS Cluster 1 Signature. D Bi-dimensional representation of 6519 single-cell transcriptomes of peripheral blood mononuclear cells derived from patients with metastatic breast cancer are shown (UMAP) with Cluster 13 presenting of Circulation Tumor Cells (CTCs) (GSE174463). E FEA was performed for the custom genes signatures derived from DEGs of each MS Cluster on CTCs Cluster 13. AUC values are shown in a heatmap, and P-values are presented in Additional file 2: Supplemental Table 9. F, I Single-cell transcriptomes from primary and metastatic tumors of PDX models UCD46 (F) and UCD4 (I) are represented in UMAP plots (GSE131007). G, J The proportion of cells in each cluster is indicated by their origin (i.e., primary tumor or metastatic location) relative to the total number of cells of each origin. H, K FEA was performed for the MS Cluster 1 Signature on both datasets with box plots showing signature scores per cluster
Fig. 7
Fig. 7
The MS Cluster 1 Signature is associated with poor patient outcome. A A description of nine ER+ breast tumors processed with scRNA-seq technologies which datasets were downloaded from GEO portal (GSE176078) . B, C 31,259 single-cell transcriptomes of epithelial cells from (A) were clustered and represented bi-dimensionally (B) with cluster compositions (C). D FEA was performed for the MS Cluster 1 Signature on ER+ breast cancer datasets (AC) with box plot showing signature scores, AUC and P-value per cluster. E Distribution of z-scores for the MS Cluster 1 Signature is shown on a per cell basis for each tumor from (A). FI The MS Cluster 1 Signature was interrogated in 1175 ER+ breast tumors from the METABRIC cohort available in cBioPortal for Cancer Genomics. Histologic grade (F), molecular subtype (G), patient relapse free survival (H) and overall survival (I) between tumors+ vs.— for expression of the MS Cluster 1 Signature are displayed. Statistical significance was determined using chi-squared test (F, G) or log-rank test (H, I). JM The MS Cluster 1 signature score distribution across ER+ breast tumors from (H–I) stratified by histologic grade (J), molecular subtype (K), relapse free survival status (L), and survival status (M). P-values are from Student’s tests. *P < 0.05,**P < 0.01, ***P < 0.001, ns not significant

Similar articles

Cited by

References

    1. Siegel RL, Miller KD, Fuchs HE, Jemal A. Cancer statistics, 2021. CA Cancer J Clin. 2021;71:7–33. doi: 10.3322/caac.21654. - DOI - PubMed
    1. Acheampong T, Kehm RD, Terry MB, Argov EL, Tehranifar P. Incidence trends of breast cancer molecular subtypes by age and race/ethnicity in the US From 2010 to 2016. JAMA Netw Open. 2020;3:e2013226. doi: 10.1001/jamanetworkopen.2020.13226. - DOI - PMC - PubMed
    1. Pan H, et al. 20-year risks of breast-cancer recurrence after stopping endocrine therapy at 5 years. N Engl J Med. 2017;377:1836–1846. doi: 10.1056/NEJMoa1701830. - DOI - PMC - PubMed
    1. Jatoi I, Anderson WF, Jeong JH, Redmond CK. Breast cancer adjuvant therapy: time to consider its time-dependent effects. J Clin Oncol. 2011;29:2301–2304. doi: 10.1200/JCO.2010.32.3550. - DOI - PMC - PubMed
    1. Yu KD, Wu J, Shen ZZ, Shao ZM. Hazard of breast cancer-specific mortality among women with estrogen receptor-positive breast cancer after five years from diagnosis: implication for extended endocrine therapy. J Clin Endocrinol Metab. 2012;97:E2201–2209. doi: 10.1210/jc.2012-2423. - DOI - PubMed

MeSH terms

Substances