. 2023 Jun 6;122(11):2112-2124.
doi: 10.1016/j.bpj.2022.12.009. Epub 2022 Dec 7.

Protein overexpression can induce the elongation of cell membrane nanodomains

Affiliations

Protein overexpression can induce the elongation of cell membrane nanodomains

Julie Cornet et al. Biophys J. .

Abstract

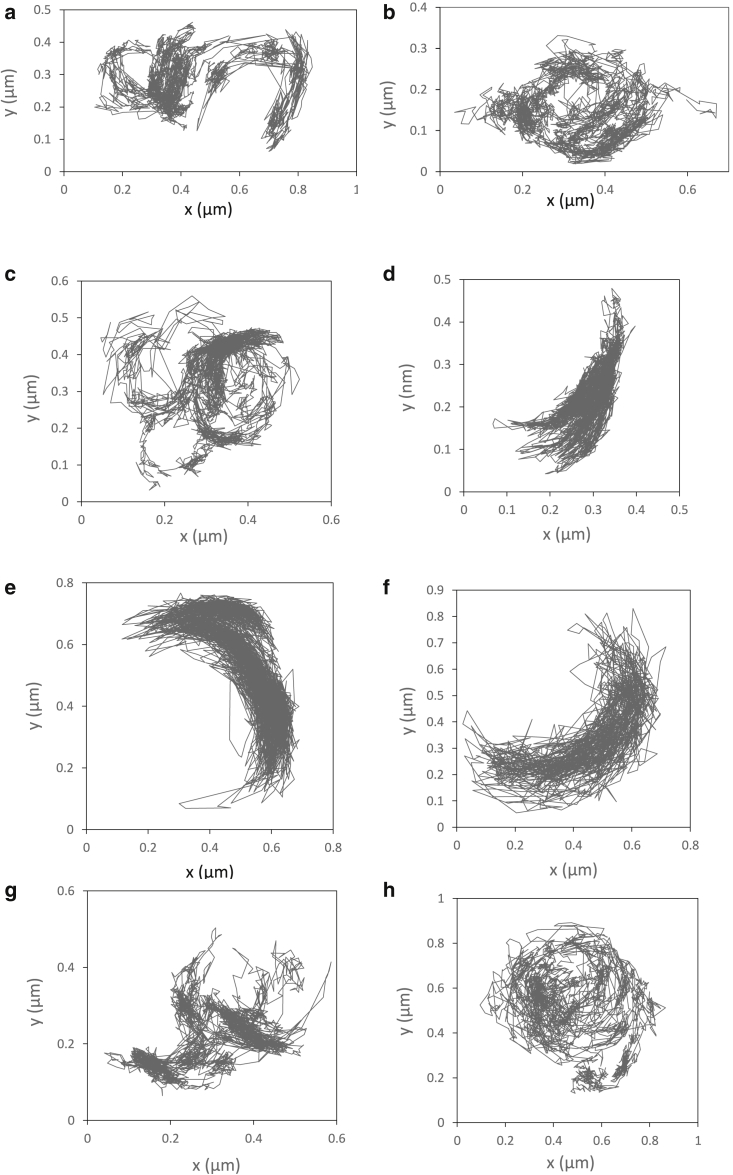
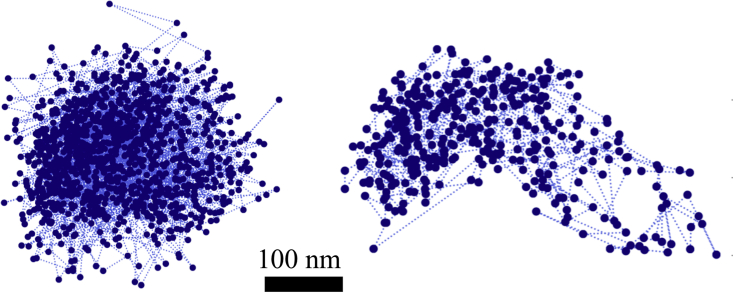
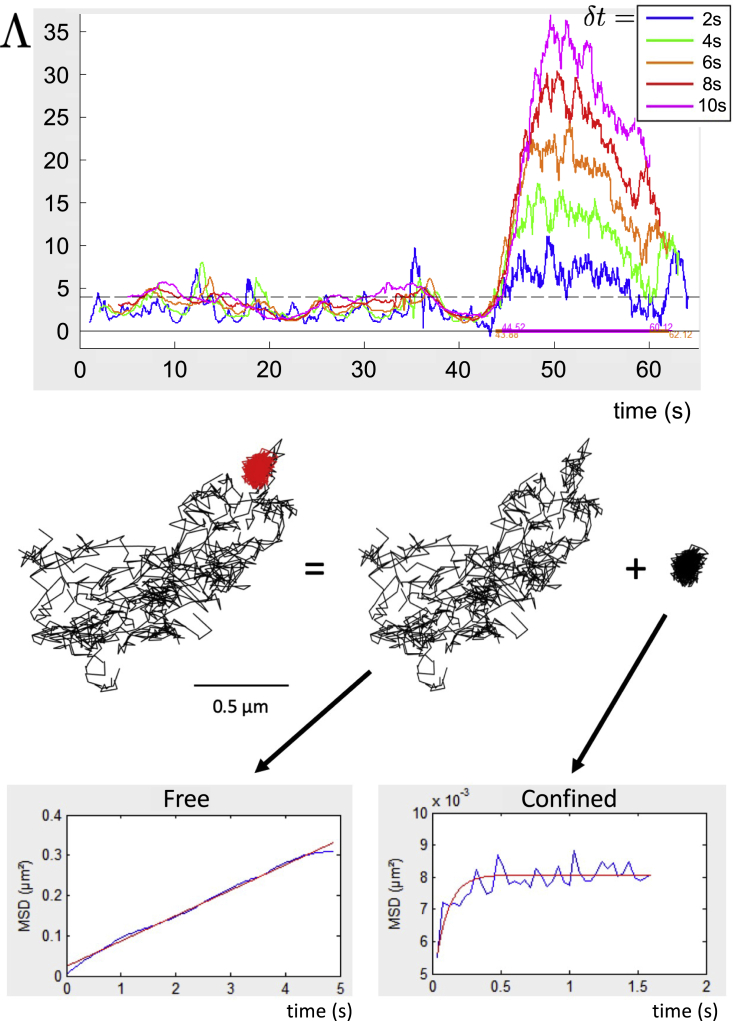
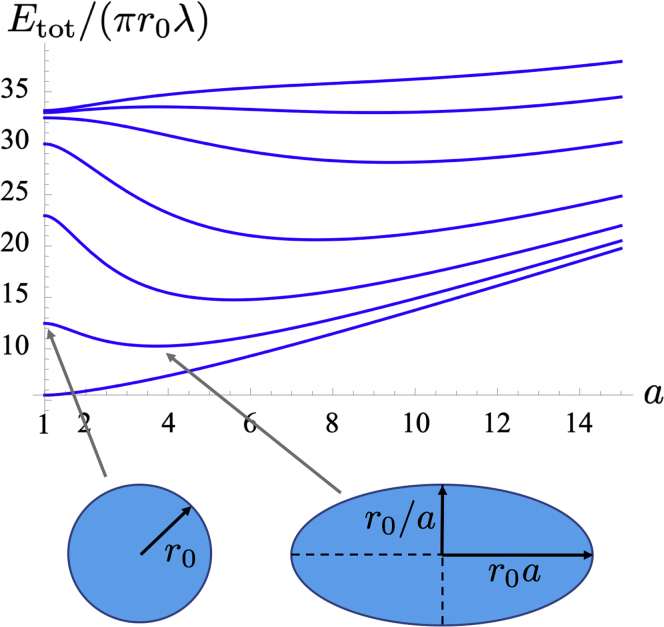
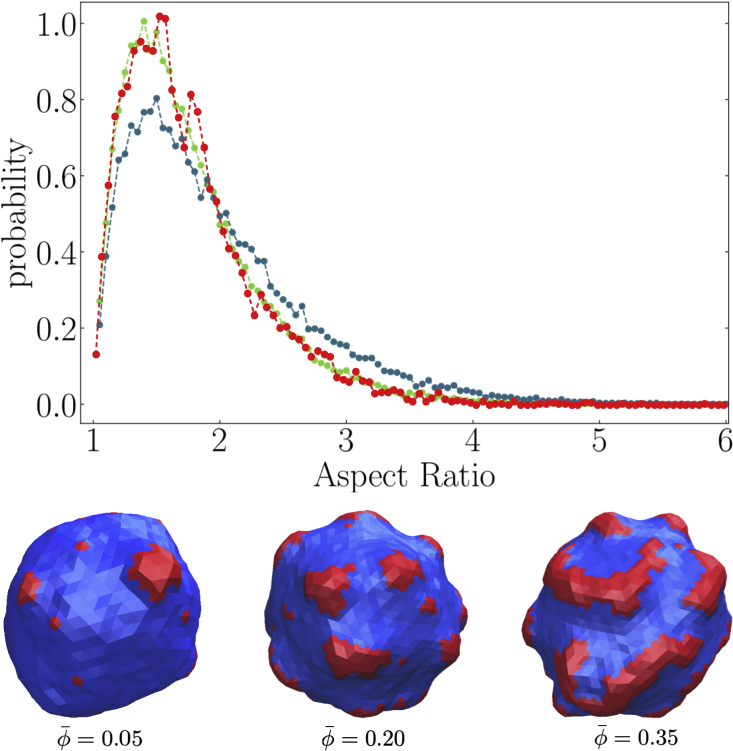
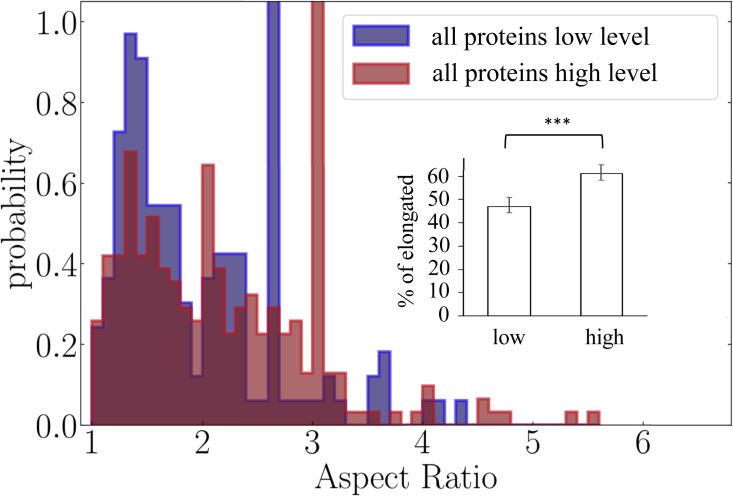
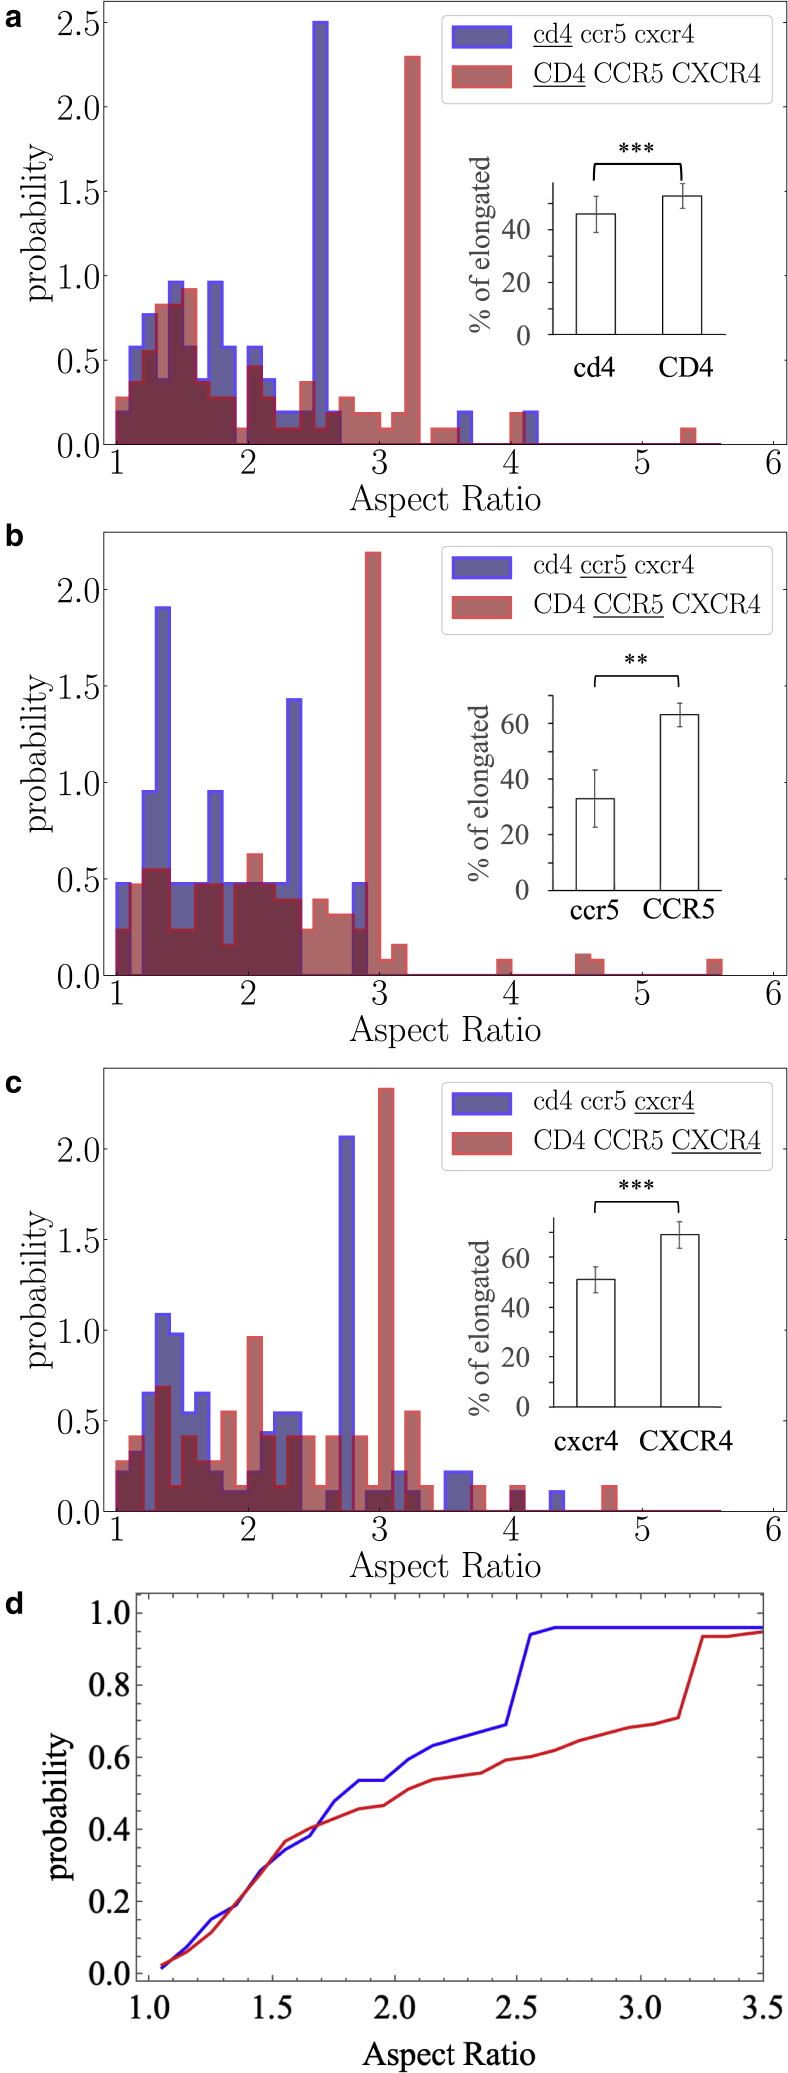
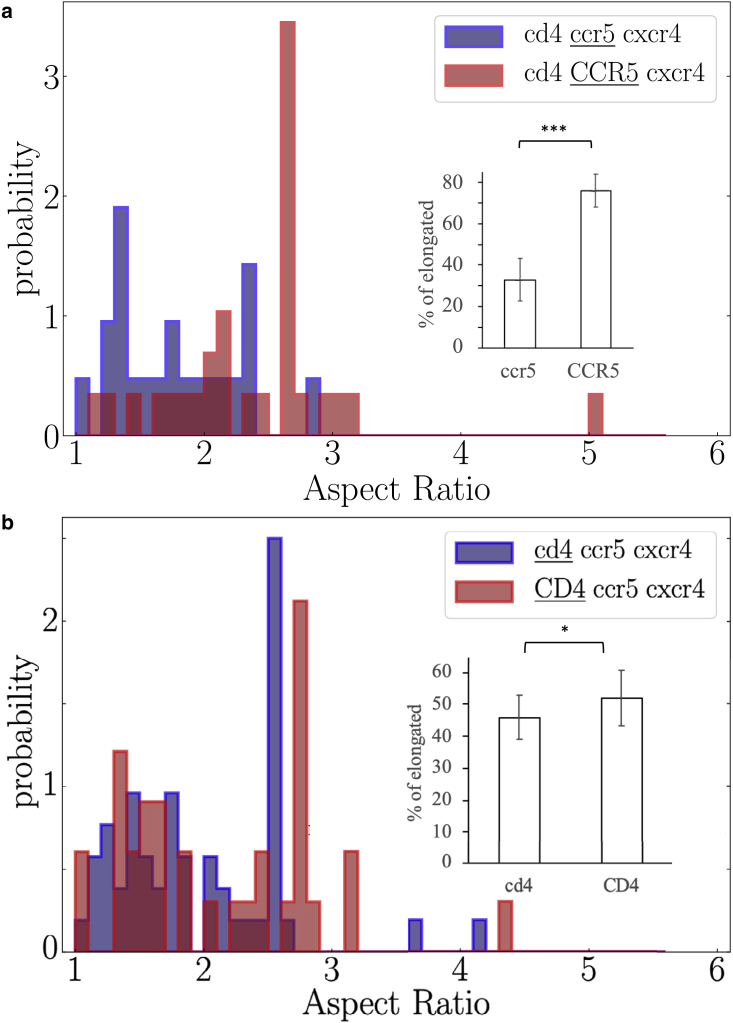
In cell membranes, proteins and lipids are organized into submicrometric nanodomains of varying sizes, shapes, and compositions, performing specific functions. Despite their biological importance, the detailed morphology of these nanodomains remains unknown. Not only can they hardly be observed by conventional microscopy due to their small size, but there is no full consensus on the theoretical models to describe their structuring and their shapes. Here, we use a combination of analytical calculations and Monte Carlo simulations based upon a model coupling membrane composition and shape to show that increasing protein concentration leads to an elongation of membrane nanodomains. The results are corroborated by single-particle tracking measurements on HIV receptors, whose level of expression in the membrane of specifically designed living cells can be tuned. These findings highlight that protein abundance can modulate nanodomain shape and potentially their biological function. Beyond biomembranes, this mesopatterning mechanism is of relevance in several soft-matter systems because it relies on generic physical arguments.


Conflict of interest statement

Declaration of interests The authors declare no competing interests.

Figures

Figure 1
Figure 1
Example of oddly shaped mu-opioid receptor trajectories acquired by SPT on NRK fibroblasts. Trajectories have been acquired in the absence of ligand (a and b) or in the presence of 1 μM agonist ligand DAMGO (ch). Out of 100 trajectories without ligand, 2 are curled (2%), whereas in the presence of DAMGO, this increases to 9 over 60 (15%).
Figure 2
Figure 2
Examples of SPT trajectories of CCR5 receptors confined into nanodomains at the surface of Affinofile cells (see main text). More roundish nanodomains are observed when the proteins have a low expression level (left) and more elongated ones when the proteins are overexpressed (right). To see this figure in color, go online.
Figure 3
Figure 3
Top: example of use of the confinement index on one of our SPT experimental trajectories in function of time. It is calculated over a sliding time window of duration δt given by the color code. By the end of the trajectory, the index becomes larger than the threshold four (dashed line), indicating a marked confinement zone (52). The colored line below the plots represents the duration of the confinement. Middle: the so-obtained transient confinement zone is represented in red on the SPT trajectory, which is split into two parts, presumably a free random walk and the confined transient confinement zone. Bottom: this is confirmed by inspection of the MSD plots; the first one is linear, and the second one is typical of diffusion confined in a nanodomain. The time is in s on all axes. To see this figure in color, go online.
Figure 4
Figure 4
The nanodomain adimensional energy Etot/(πr0λ) as a function of the ellipse aspect ratio parameter a, for ε=10 and l=0.5, 1, 2, 4, 8, 12, and 16, from bottom to top. To see this figure in color, go online.
Figure 5
Figure 5
Top: simulation aspect ratio probability distributions of A (red) domains for vesicles with φ¯=0.05 (red), φ¯=0.20 (green), and φ¯=0.35 (blue). Other parameters are c1=8.0, σ˜=300, and J˜I=0.5. Whereas the φ¯=0.05 and φ¯=0.2 distributions are close, the φ¯=0.35 one is significantly different from the φ¯=0.20 one (p value below the computer accuracy, Kolmogorov-Smirnov [KS] statistical test, see supporting material). Bottom: simulation snapshots of the corresponding vesicles with the given values of φ¯. To see this figure in color, go online.
Figure 6
Figure 6
Experimental aspect ratio probability distributions when all proteins have a low (blue, nlow=165 measurements in 113 cells acquired in 21 independent experiments) or high (red, nhigh=317 measurements in 211 cells acquired in 38 independent experiments) expression level (p<107 for KS statistical test, see supporting material). Inset: fractions of elongated nanodomains in both conditions. Error bars are standard errors of the mean. To see this figure in color, go online.
Figure 7
Figure 7
Same as Fig. 6 for the three types of proteins tracked separately when they all have low (blue) and high (red) expression levels. (a) p2×104, nlow=52 measurements in 29 cells acquired in 7 independent experiments, and nhigh=111 measurements in 83 cells acquired in 13 independent experiments; (b) p0.002, nlow=21 measurements in 15 cells acquired in 4 independent experiments, and nhigh=131 measurements in 88 cells acquired in 15 independent experiments; and (c) p0.001, nlow=92 measurements in 69 cells acquired in 10 independent experiments, and nhigh=75 measurements in 47 cells acquired in 9 independent experiments. Protein name is written in lowercase letters when expressed at low level and in uppercase letters when overexpressed. The protein that has been tracked is underlined. Error bars on histograms are mean ± SEM. The p values are not calculated with these error bars but with the full distributions via a KS statistical test (see below). In (d), the cumulative distribution of (a). To see this figure in color, go online.
Figure 8
Figure 8
Same as Fig. 6 for different conditions. (a) p9×104, nlow, and nhigh=29 measurements in 16 cells acquired in 5 independent experiments, and (b) p0.03, nlow, and nhigh=33 measurements in 19 cells acquired in 6 independent experiments. Protein name is written in lowercase letters when expressed at low level and in uppercase letters when overexpressed. The protein that has been tracked is underlined. To see this figure in color, go online.

Similar articles

Cited by

References

    1. Singer S.J., Nicolson G.L. The fluid mosaic model of the structure of cell membranes. Science. 1972;175:720–731. - PubMed
    1. Jacobson K., Sheets E., Simson R. Revisiting the fluid mosaic model of membranes. Science. 1995;268:1441–1442. - PubMed
    1. Vereb G., Szöllsi J., et al. Damjanovich S. Dynamic, yet structured: the cell membrane three decades after the Singer-Nicolson model. Proc. Natl. Acad. Sci. USA. 2003;100:8053–8058. - PMC - PubMed
    1. Kusumi A., Fujiwara T.K., et al. Suzuki K.G.N. Dynamic organizing principles of the plasma membrane that regulate signal transduction: commemorating the fortieth anniversary of Singer and Nicolson’s fluid-mosaic model. Annu. Rev. Cell Dev. Biol. 2012;28:215–250. - PubMed
    1. Garcia-Parajo M.F., Cambi A., et al. Jacobson K. Nanoclustering as a dominant feature of plasma membrane organization. J. Cell Sci. 2014;127:4995–5005. - PMC - PubMed

MeSH terms

LinkOut - more resources